Spatial Distribution of Grass Trees and Red Ash Trees in Toohey Forest
VerifiedAdded on 2023/06/07
|15
|2968
|133
AI Summary
This study explores the spatial distribution of two plant species, Grass Tree and Red Ash, in Toohey Forest and investigates if they show a positive or negative association and speculate on the drivers. The study area, methods, results, and discussion are presented in detail. The chi-square test has clearly rejected the H0= the two species are independent. The comparison made in the studies have proved that the species have no associations.
Contribute Materials
Your contribution can guide someone’s learning journey. Share your
documents today.

Running head: ECOLOGY
Ecology
Name of the Student:
Name of the University:
Author Note:
Ecology
Name of the Student:
Name of the University:
Author Note:
Secure Best Marks with AI Grader
Need help grading? Try our AI Grader for instant feedback on your assignments.
1ECOLOGY
Abstract
Spatial patterns in the vegetation exist and emerge due to the interactions between the
environment and the species. A positive association is noticed within the plant species when the
plants are found to be occurring more than usual with the other plant species, and this
phenomenon is more of a random chance. The spatial associations are found to be affected and
influenced by both the biotic and the abiotic factors. The biotic factors include the moisture
availability and the nutrient availability, fire, anthropogenic factors, flood. While the biotic
factors are the disease, predation and competition. This study has laid emphasis on the two plant
species like the Grass Tree (Xanthorrhoea johnsoni) and the Red Ash (Alphitonia excels) and
their spatial distribution in a natural community. Alphitonia excels is known to be used in the
bush regeneration and the Xanthorrhoea johnsoni is known to withstand the fire and have a long
span of life. Toohey forest is selected for the study and the data are collected through a quadrat
study of 155 quadrats that are of 5x5 metre square. The quadrats are selected randomly and they
are around a riparian area. The analysis is done through a chi square test that determined the
spatial association between red ash trees and grass trees. The two hypothesis set for the study
are: H0= the two species are independent (i.e. there is no association between Xanthorrhoea
johnsoni and Alphitonia excelsa); H1= the two species are not independent (i.e. there is an
association between Xanthorrhoea johnsoni and Alphitonia excelsa). The chi square test has
clearly rejected the H0= the two species are independent (i.e. there is no association between
Xanthorrhoea johnsoni and Alphitonia excelsa). The comparison made in the studies have
proved that the species have no associations. The grass tress and the red ash are independent of
each other and are not found together in the eucalypt forest of Toohey. The 155 quadrats studied
have shown that both the plant species have no such spatial association with each other.

2ECOLOGY
Although considering a larger number of the quadrats could have provided a different and more
coherent result.
Although considering a larger number of the quadrats could have provided a different and more
coherent result.
3ECOLOGY
Table of Contents
Introduction......................................................................................................................................4
Methods...........................................................................................................................................5
Results..............................................................................................................................................6
Discussion........................................................................................................................................9
Conclusion.....................................................................................................................................12
Reference.......................................................................................................................................13
Secure Best Marks with AI Grader
Need help grading? Try our AI Grader for instant feedback on your assignments.
4ECOLOGY
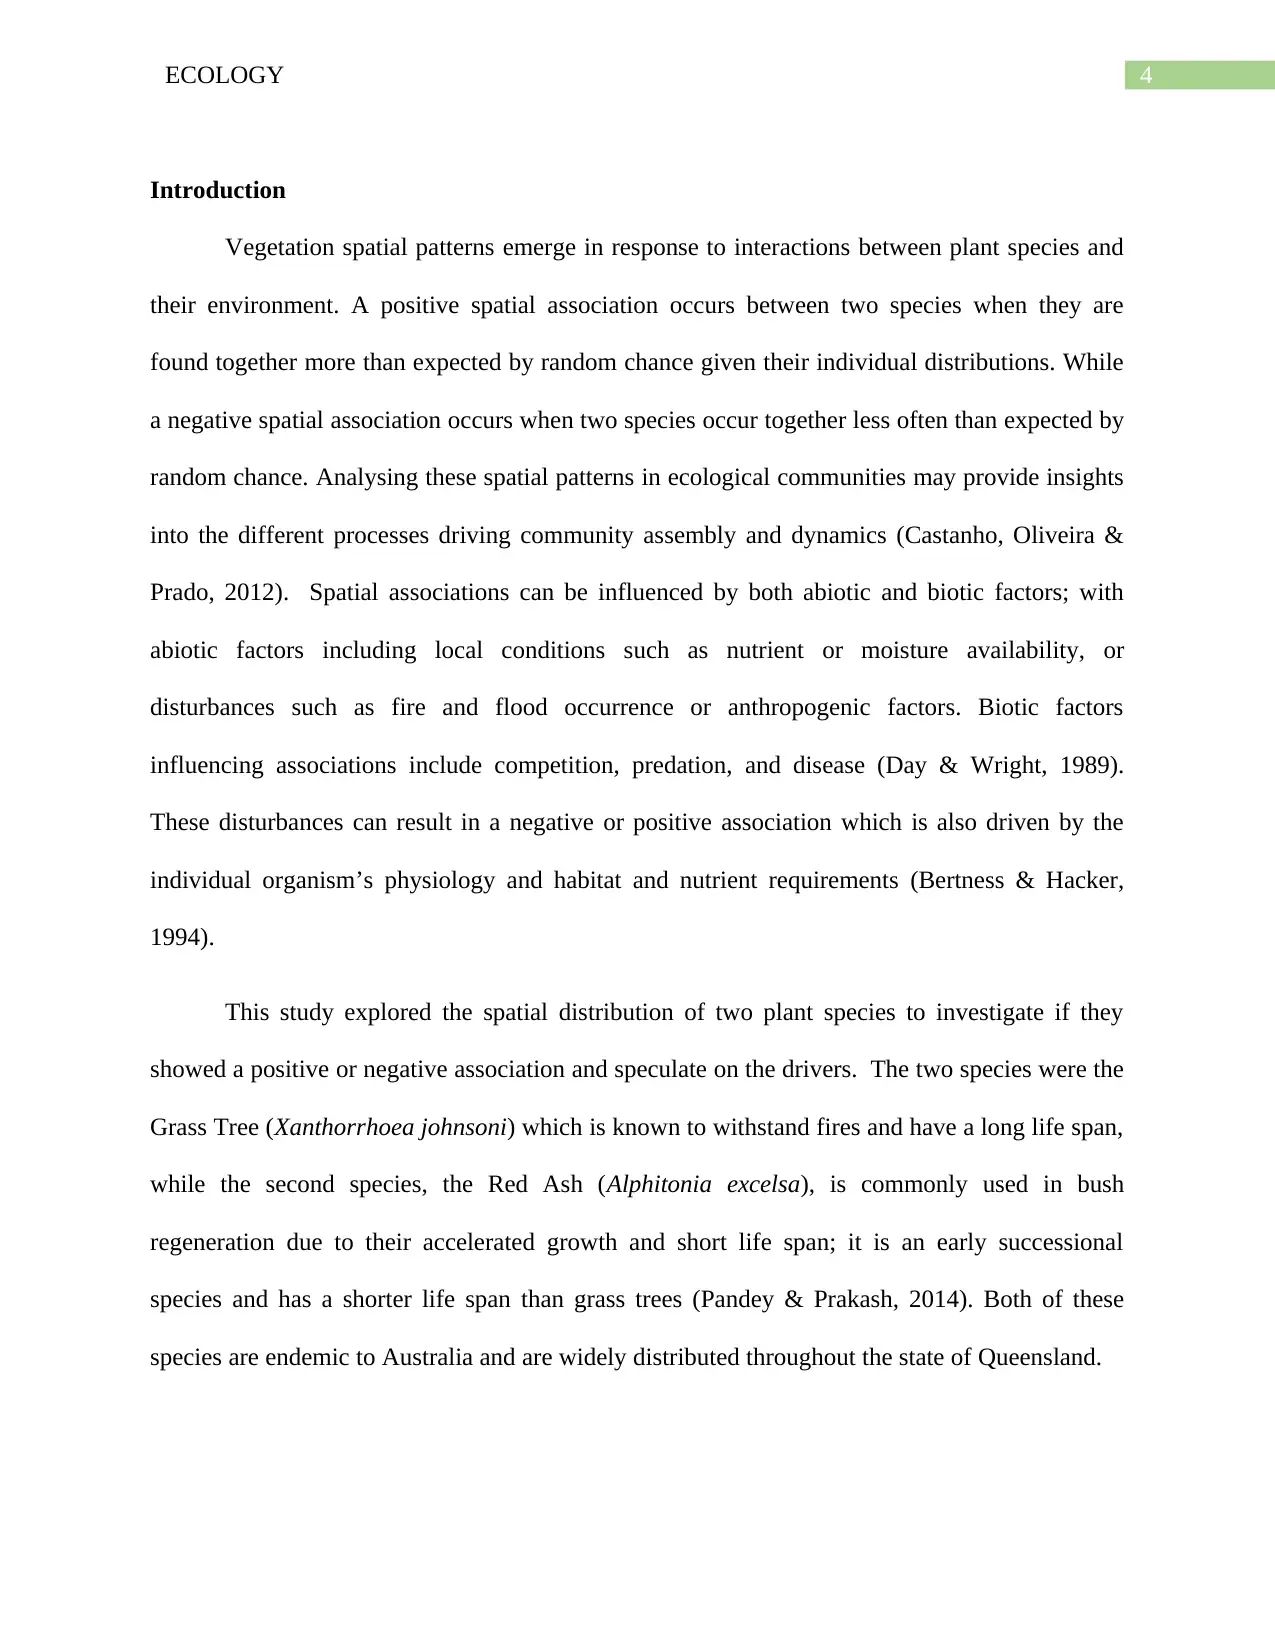
Introduction
Vegetation spatial patterns emerge in response to interactions between plant species and
their environment. A positive spatial association occurs between two species when they are
found together more than expected by random chance given their individual distributions. While
a negative spatial association occurs when two species occur together less often than expected by
random chance. Analysing these spatial patterns in ecological communities may provide insights
into the different processes driving community assembly and dynamics (Castanho, Oliveira &
Prado, 2012). Spatial associations can be influenced by both abiotic and biotic factors; with
abiotic factors including local conditions such as nutrient or moisture availability, or
disturbances such as fire and flood occurrence or anthropogenic factors. Biotic factors
influencing associations include competition, predation, and disease (Day & Wright, 1989).
These disturbances can result in a negative or positive association which is also driven by the
individual organism’s physiology and habitat and nutrient requirements (Bertness & Hacker,
1994).
This study explored the spatial distribution of two plant species to investigate if they
showed a positive or negative association and speculate on the drivers. The two species were the
Grass Tree (Xanthorrhoea johnsoni) which is known to withstand fires and have a long life span,
while the second species, the Red Ash (Alphitonia excelsa), is commonly used in bush
regeneration due to their accelerated growth and short life span; it is an early successional
species and has a shorter life span than grass trees (Pandey & Prakash, 2014). Both of these
species are endemic to Australia and are widely distributed throughout the state of Queensland.
5ECOLOGY
The aim of this study was to explore the spatial distribution of Xanthorrhoea johnsoni
and Alphitonia excelsa to explore any significant associations between the two species and
speculate on the drivers.
Methods
Study Area:
Toohey Forest is located 10km south of the Brisbane CBD on 260 hectares of bushland.
It is classified as an open eucalypt forest, with more than 400 distinct species of flora and fauna.
It is a managed forest that is sequentially burnt to prevent bushfire hazards within the urban area.
Collection:
Data were collected from a total of 155 5x5m2 quadrats selected at random within an area
in Toohey Forest that spanned the riparian zone of Mimosa Creek to the top of a ridge. The
number of grass trees (Xanthorrhoea johnsoni) and red ash trees (Alphitonia excelsa) were
counted in each quadrat to build a contingency table to be used for analysis. The approximate
distance (in meters) from each quadrat to the creek was also estimated.
Analysis:
Raw data was collated into a contingency table which reflected the presence/absence of
each species in a quadrat. This table was used to calculate a chi-squared test of independence.
This test was used to determine if there was a spatial association between red ash trees and grass
trees. The hypotheses were as follows;
H0= the two species are independent (i.e. there is no association between Xanthorrhoea johnsoni
and Alphitonia excelsa)
6ECOLOGY
H1= the two species are not independent (i.e. there is an association between Xanthorrhoea
johnsoni and Alphitonia excelsa)
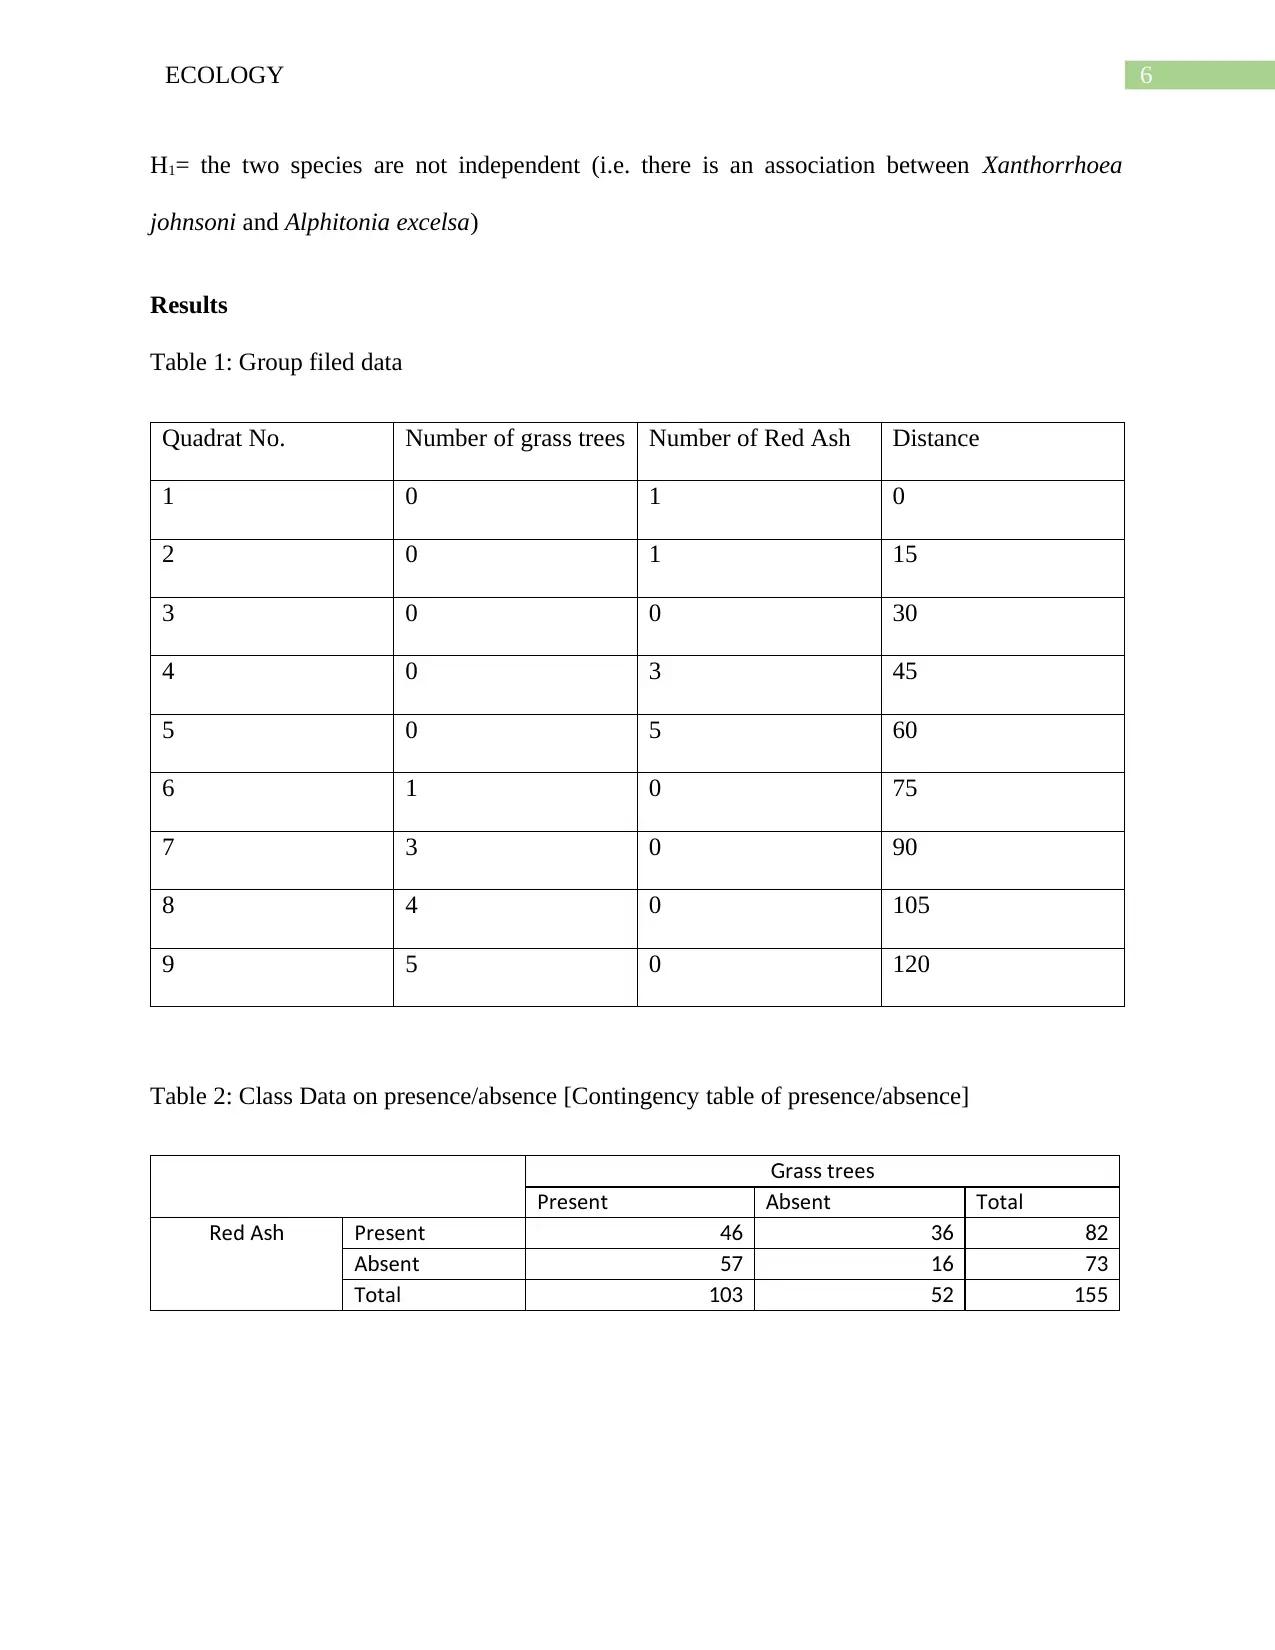
Results
Table 1: Group filed data
Quadrat No. Number of grass trees Number of Red Ash Distance
1 0 1 0
2 0 1 15
3 0 0 30
4 0 3 45
5 0 5 60
6 1 0 75
7 3 0 90
8 4 0 105
9 5 0 120
Table 2: Class Data on presence/absence [Contingency table of presence/absence]
ra treeG ss s
Pre ents A entbs Total
ed AR sh Pre ents 46 36 82
A entbs 57 16 73
Total 103 52 155
H1= the two species are not independent (i.e. there is an association between Xanthorrhoea
johnsoni and Alphitonia excelsa)
Results
Table 1: Group filed data
Quadrat No. Number of grass trees Number of Red Ash Distance
1 0 1 0
2 0 1 15
3 0 0 30
4 0 3 45
5 0 5 60
6 1 0 75
7 3 0 90
8 4 0 105
9 5 0 120
Table 2: Class Data on presence/absence [Contingency table of presence/absence]
ra treeG ss s
Pre ents A entbs Total
ed AR sh Pre ents 46 36 82
A entbs 57 16 73
Total 103 52 155
Paraphrase This Document
Need a fresh take? Get an instant paraphrase of this document with our AI Paraphraser
7ECOLOGY
1 2 3 4 5 6 7 8 9
0
1
2
3
4
5
6
elation ip et een t o pecieR sh b w w s s
m er o ra treeNu b f g ss s m er o ed ANu b f R sh
adrat n m erQu u b
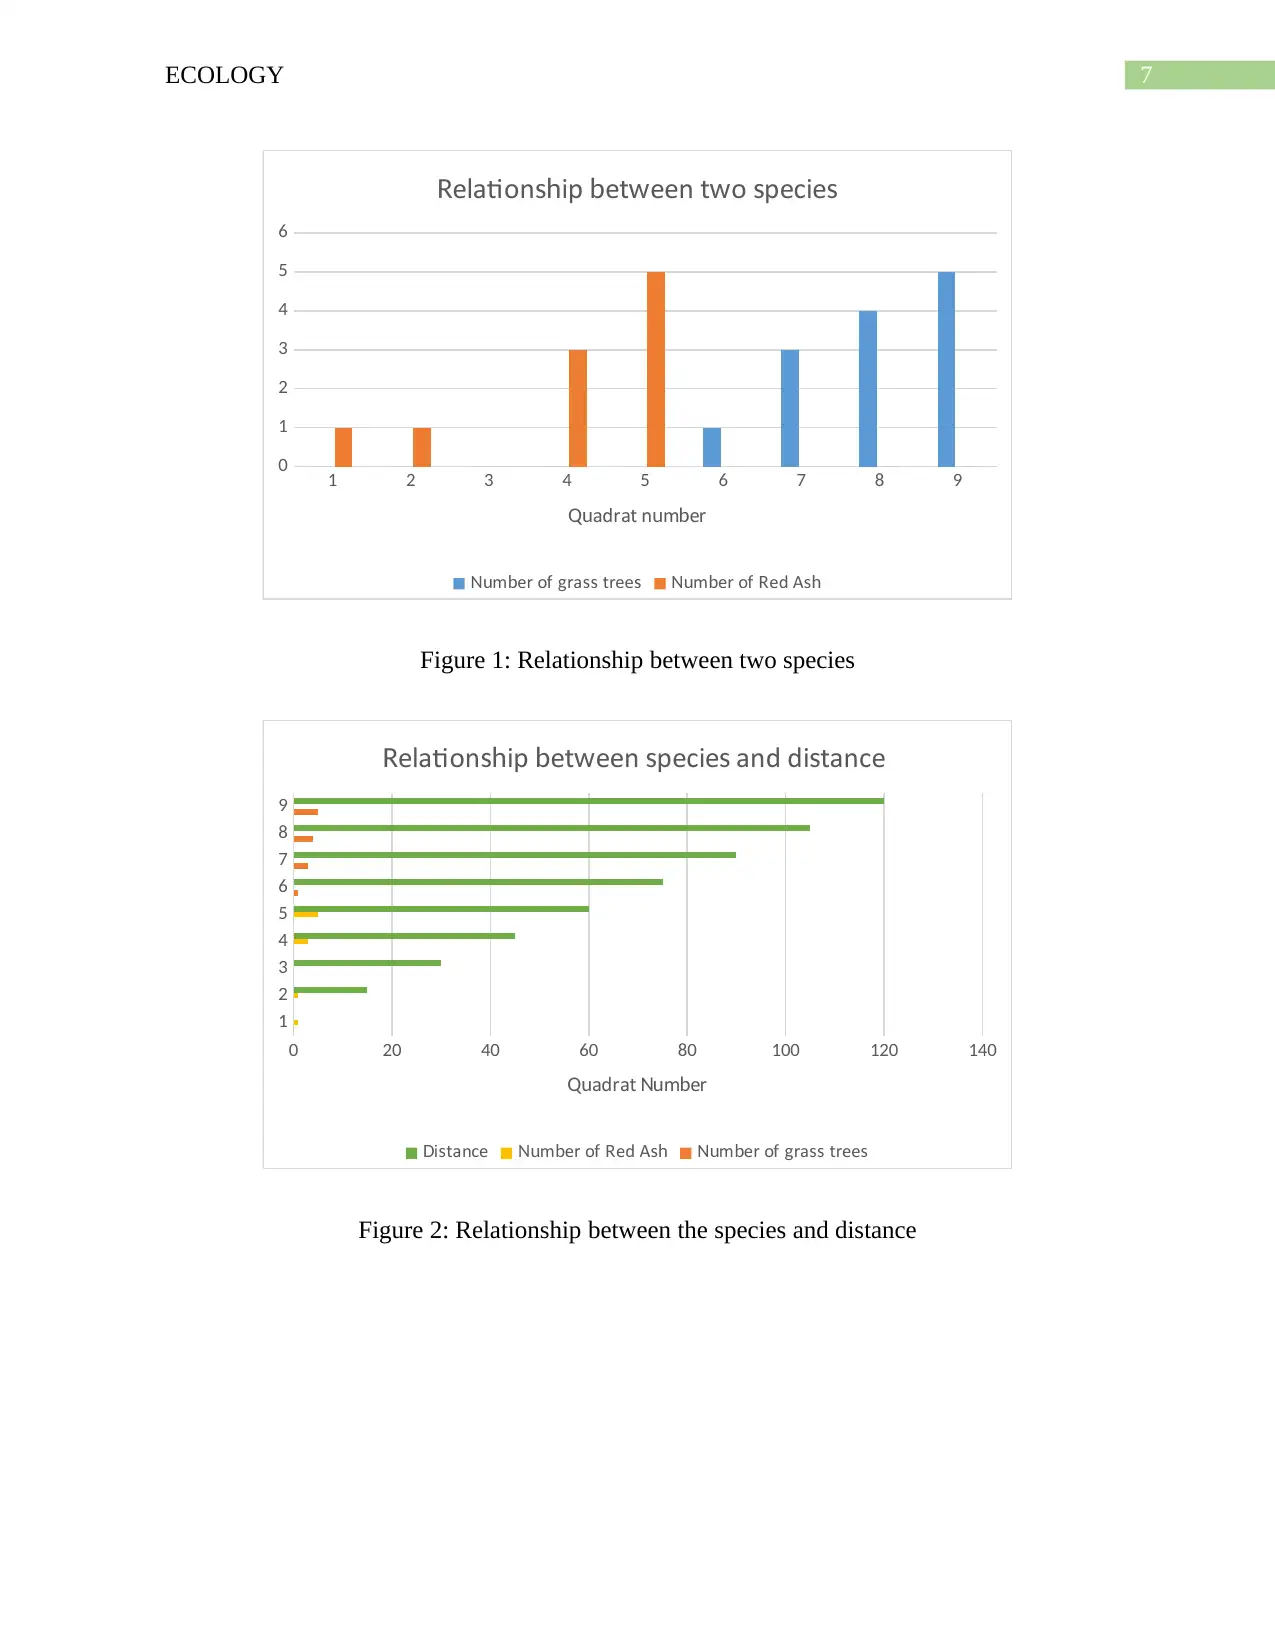
Figure 1: Relationship between two species
1
2
3
4
5
6
7
8
9
0 20 40 60 80 100 120 140
elation ip et een pecie and di tanceR sh b w s s s
i tanceD s m er o ed ANu b f R sh m er o ra treeNu b f g ss s
adrat m erQu Nu b
Figure 2: Relationship between the species and distance
1 2 3 4 5 6 7 8 9
0
1
2
3
4
5
6
elation ip et een t o pecieR sh b w w s s
m er o ra treeNu b f g ss s m er o ed ANu b f R sh
adrat n m erQu u b
Figure 1: Relationship between two species
1
2
3
4
5
6
7
8
9
0 20 40 60 80 100 120 140
elation ip et een pecie and di tanceR sh b w s s s
i tanceD s m er o ed ANu b f R sh m er o ra treeNu b f g ss s
adrat m erQu Nu b
Figure 2: Relationship between the species and distance
8ECOLOGY
0 1 2 3 4 5 6 7 8 9 10
0
1
2
3
4
5
6
7
8
9
10
A ndance o red a and ra treebu f sh g ss s
m er o ra treeNu b f g ss s m er o ed ANu b f R sh adrat oQu N .
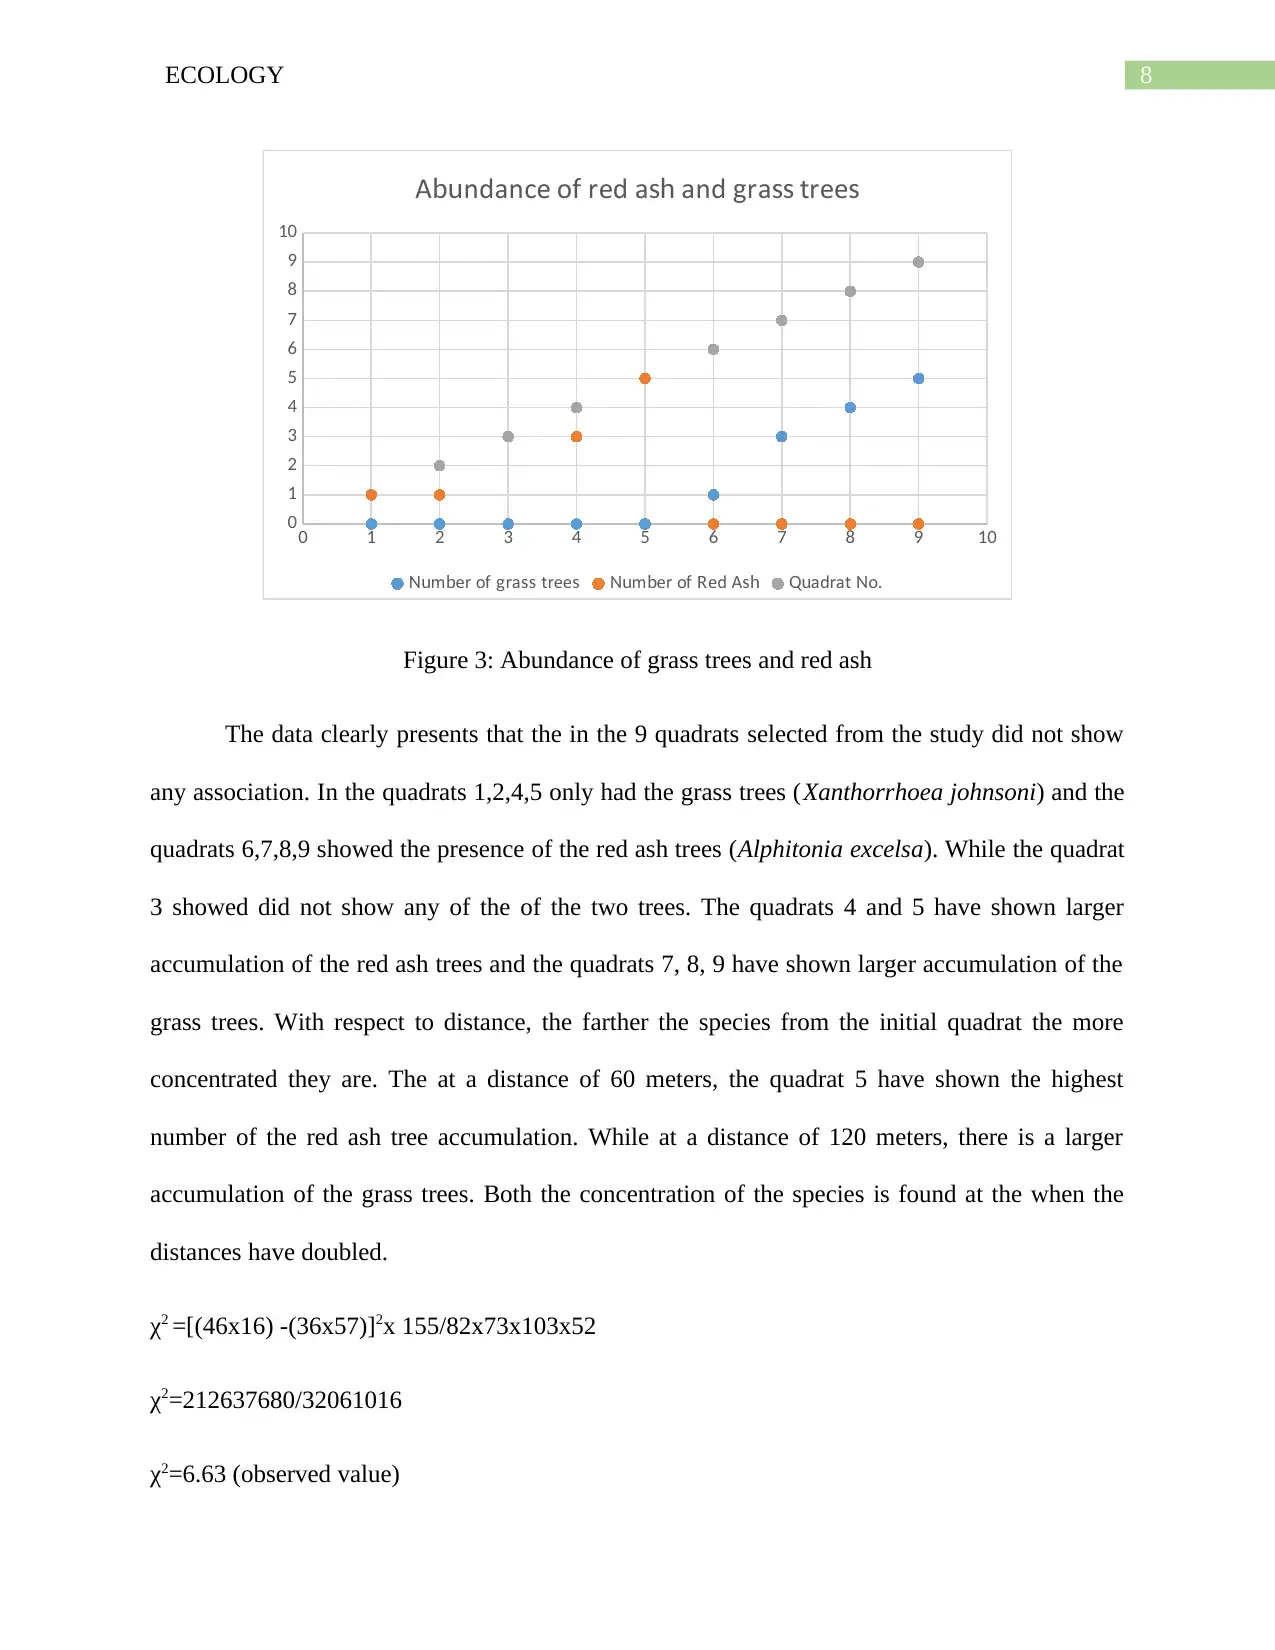
Figure 3: Abundance of grass trees and red ash
The data clearly presents that the in the 9 quadrats selected from the study did not show
any association. In the quadrats 1,2,4,5 only had the grass trees (Xanthorrhoea johnsoni) and the
quadrats 6,7,8,9 showed the presence of the red ash trees (Alphitonia excelsa). While the quadrat
3 showed did not show any of the of the two trees. The quadrats 4 and 5 have shown larger
accumulation of the red ash trees and the quadrats 7, 8, 9 have shown larger accumulation of the
grass trees. With respect to distance, the farther the species from the initial quadrat the more
concentrated they are. The at a distance of 60 meters, the quadrat 5 have shown the highest
number of the red ash tree accumulation. While at a distance of 120 meters, there is a larger
accumulation of the grass trees. Both the concentration of the species is found at the when the
distances have doubled.
χ2 =[(46x16) -(36x57)]2x 155/82x73x103x52
χ2=212637680/32061016
χ2=6.63 (observed value)
0 1 2 3 4 5 6 7 8 9 10
0
1
2
3
4
5
6
7
8
9
10
A ndance o red a and ra treebu f sh g ss s
m er o ra treeNu b f g ss s m er o ed ANu b f R sh adrat oQu N .
Figure 3: Abundance of grass trees and red ash
The data clearly presents that the in the 9 quadrats selected from the study did not show
any association. In the quadrats 1,2,4,5 only had the grass trees (Xanthorrhoea johnsoni) and the
quadrats 6,7,8,9 showed the presence of the red ash trees (Alphitonia excelsa). While the quadrat
3 showed did not show any of the of the two trees. The quadrats 4 and 5 have shown larger
accumulation of the red ash trees and the quadrats 7, 8, 9 have shown larger accumulation of the
grass trees. With respect to distance, the farther the species from the initial quadrat the more
concentrated they are. The at a distance of 60 meters, the quadrat 5 have shown the highest
number of the red ash tree accumulation. While at a distance of 120 meters, there is a larger
accumulation of the grass trees. Both the concentration of the species is found at the when the
distances have doubled.
χ2 =[(46x16) -(36x57)]2x 155/82x73x103x52
χ2=212637680/32061016
χ2=6.63 (observed value)
9ECOLOGY
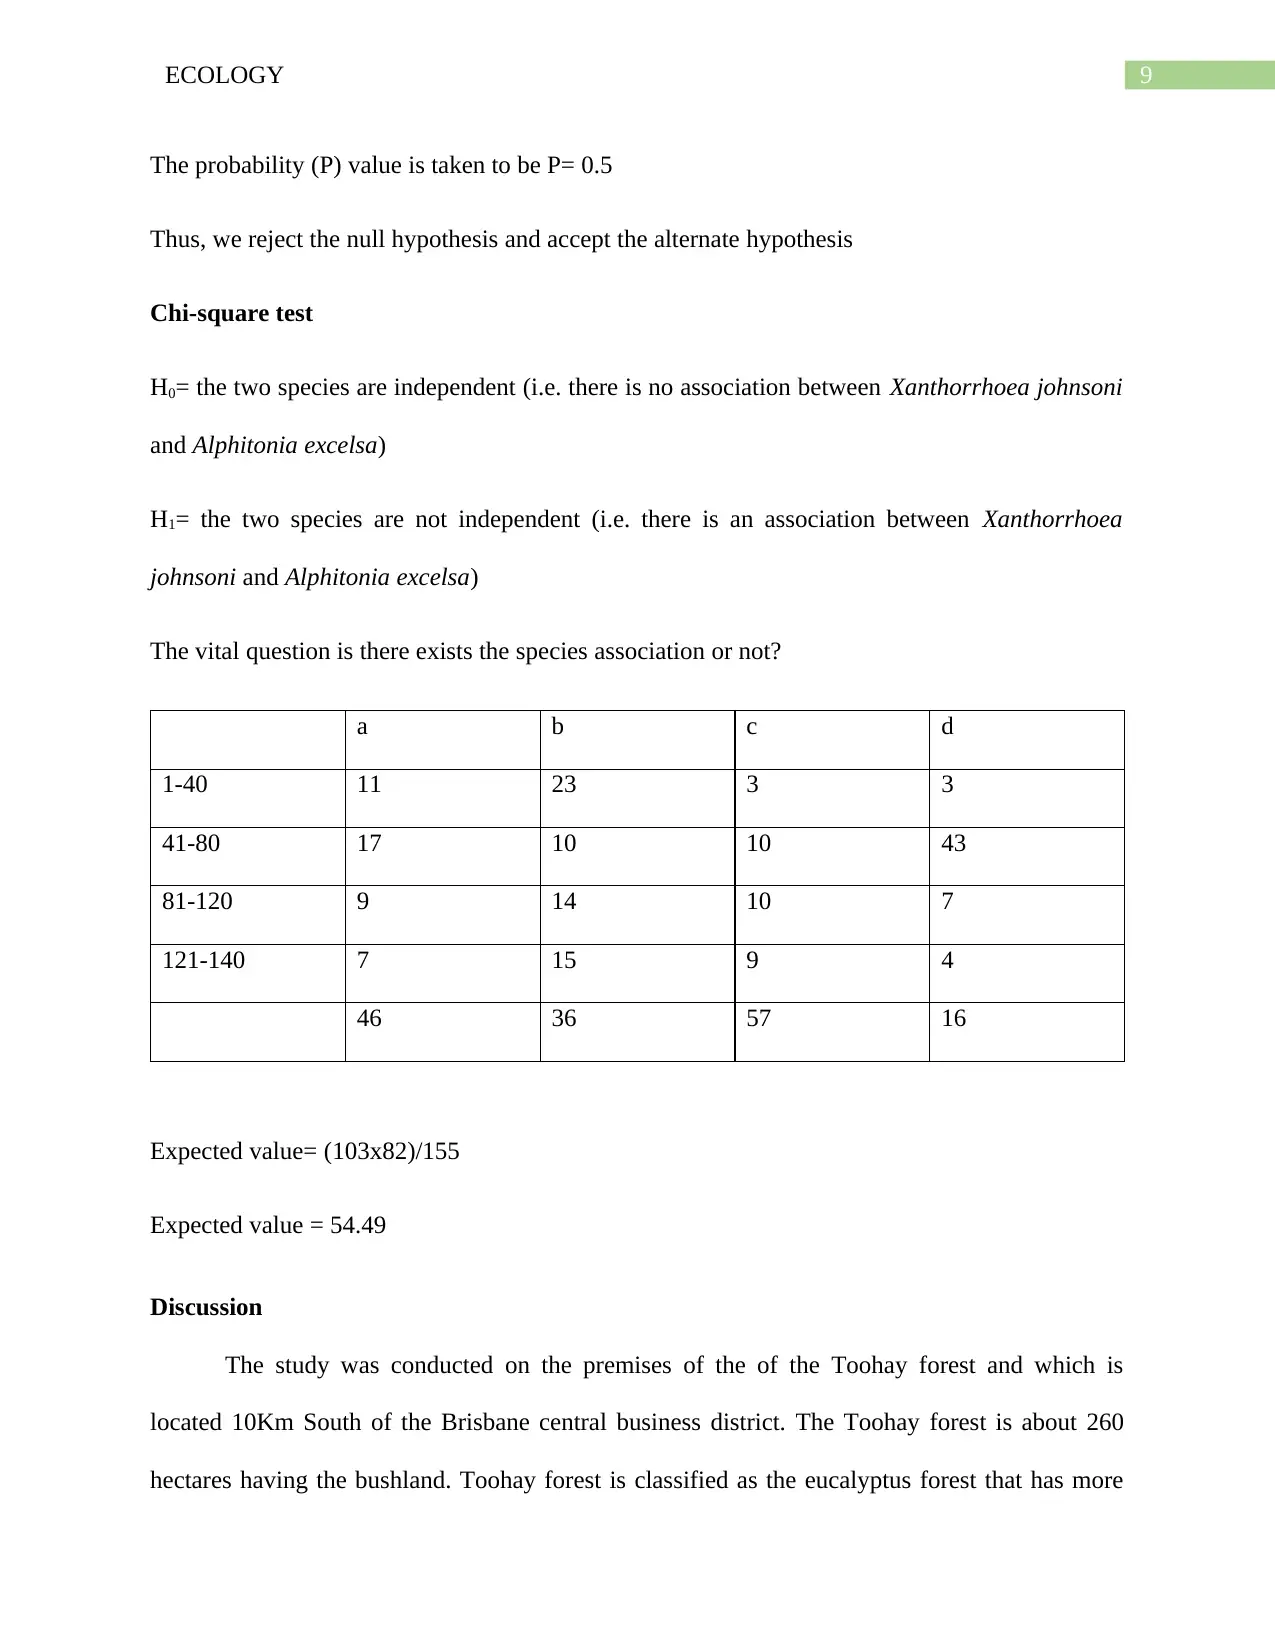
The probability (P) value is taken to be P= 0.5
Thus, we reject the null hypothesis and accept the alternate hypothesis
Chi-square test
H0= the two species are independent (i.e. there is no association between Xanthorrhoea johnsoni
and Alphitonia excelsa)
H1= the two species are not independent (i.e. there is an association between Xanthorrhoea
johnsoni and Alphitonia excelsa)
The vital question is there exists the species association or not?
a b c d
1-40 11 23 3 3
41-80 17 10 10 43
81-120 9 14 10 7
121-140 7 15 9 4
46 36 57 16
Expected value= (103x82)/155
Expected value = 54.49
Discussion
The study was conducted on the premises of the of the Toohay forest and which is
located 10Km South of the Brisbane central business district. The Toohay forest is about 260
hectares having the bushland. Toohay forest is classified as the eucalyptus forest that has more
Secure Best Marks with AI Grader
Need help grading? Try our AI Grader for instant feedback on your assignments.
10ECOLOGY
than 400 different species of fauna and flora. The sampling area is randomly chosen to minimize
the manipulation of the data. The study is conducted to study the association between the red ash
and the grass trees in the Toohay forest.
The study has indicated that the data itself is unable to show the association between the
grass trees and the red ash. Although the data received from the chi square test has revealed that
the chi- square value has no significance to the probability value of 0.5. The figure 1 shows that
there is not even a single quadrat that shows the presence of both the trees within a single
quadrat. The quadrat 3 even doesn't have a single species of the red ash and grass trees. Whereas
one remarkable finding is the at the distance of the quadrats have increased, the number of the
species in each of the quadrats also shows an increasing tendency. Even the number of the grass
trees have increased gradually as the distance has increased between among the quadrats. The
quadrats 6,7,8,9 shows an increasing trend of the grass trees.
The chi square test has clearly rejected the H0= the two species are independent (i.e. there
is no association between Xanthorrhoea johnsoni and Alphitonia excelsa). However, the
comparison made in the studies have proved that the species have no associations. Which means
that both the grass trees and the red ash are independent of each other and are not found together
in the eucalypt forest of Toohey. The 155 quadrats studied have shown that both the plant
species have no such spatial association with each other. Although considering a larger number
of the quadrats could have provided a different and more coherent result.
It has been found that the two different environments that have identical climate and
physiography may be occupied by plant species of different associations. The duration of
association is also found to be limited because the plant communities are constantly undergoing
succession. The existence of the association can be both for the long and the shorter periods. The
11ECOLOGY
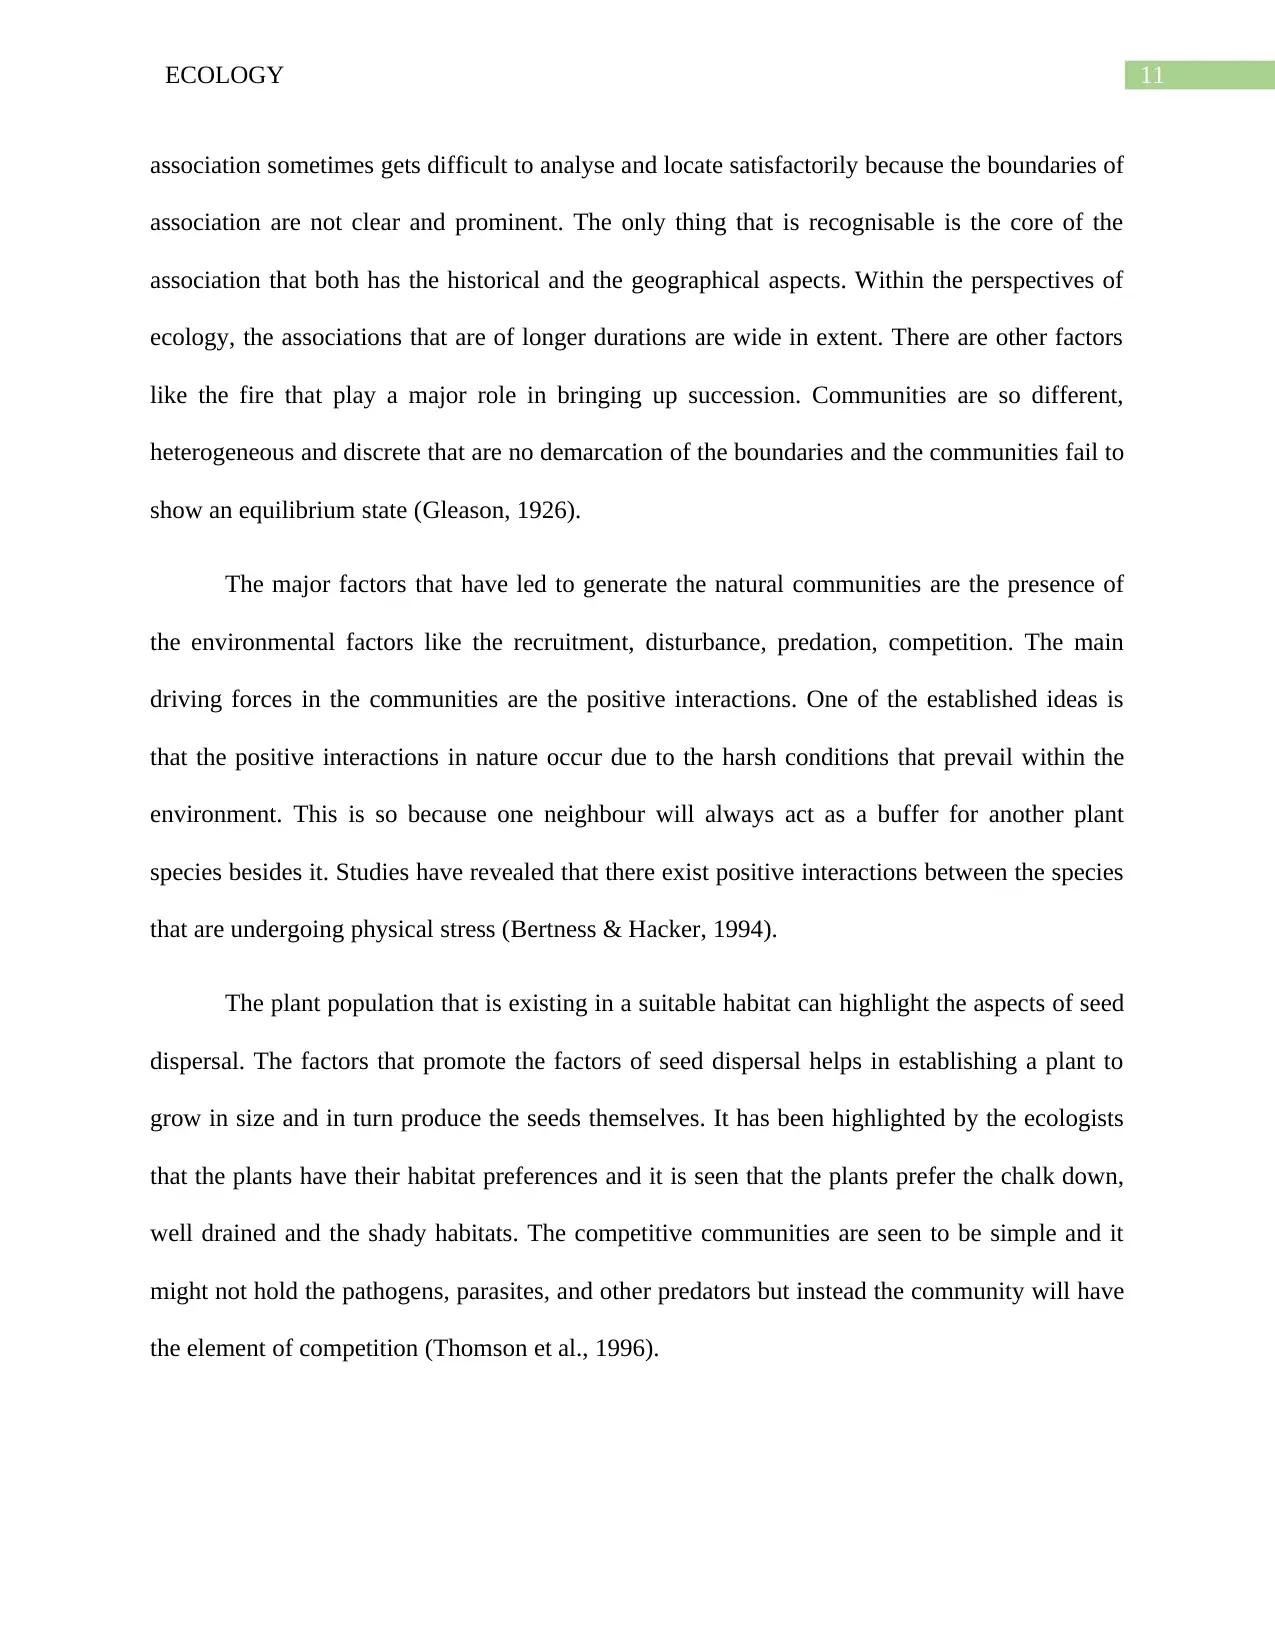
association sometimes gets difficult to analyse and locate satisfactorily because the boundaries of
association are not clear and prominent. The only thing that is recognisable is the core of the
association that both has the historical and the geographical aspects. Within the perspectives of
ecology, the associations that are of longer durations are wide in extent. There are other factors
like the fire that play a major role in bringing up succession. Communities are so different,
heterogeneous and discrete that are no demarcation of the boundaries and the communities fail to
show an equilibrium state (Gleason, 1926).
The major factors that have led to generate the natural communities are the presence of
the environmental factors like the recruitment, disturbance, predation, competition. The main
driving forces in the communities are the positive interactions. One of the established ideas is
that the positive interactions in nature occur due to the harsh conditions that prevail within the
environment. This is so because one neighbour will always act as a buffer for another plant
species besides it. Studies have revealed that there exist positive interactions between the species
that are undergoing physical stress (Bertness & Hacker, 1994).
The plant population that is existing in a suitable habitat can highlight the aspects of seed
dispersal. The factors that promote the factors of seed dispersal helps in establishing a plant to
grow in size and in turn produce the seeds themselves. It has been highlighted by the ecologists
that the plants have their habitat preferences and it is seen that the plants prefer the chalk down,
well drained and the shady habitats. The competitive communities are seen to be simple and it
might not hold the pathogens, parasites, and other predators but instead the community will have
the element of competition (Thomson et al., 1996).
12ECOLOGY
Conclusion
From the above study, it can be concluded that spatial associations between the plant
species are dependent on both the biotic and the abiotic factors. The biotic factors include the
moisture availability and the nutrient availability, fire, anthropogenic factors, flood. While the
biotic factors are the disease, predation and competition. It has been seen that the tree
(Xanthorrhoea johnsoni) and the Red Ash (Alphitonia excels) and their spatial distribution in a
natural community. Alphitonia excels is known to be used in the bush regeneration and the
Xanthorrhoea johnsoni is known to withstand the fire and have a long span of life. The two
hypothesis set for the study are: H0= the two species are independent (i.e. there is no association
between Xanthorrhoea johnsoni and Alphitonia excelsa); H1= the two species are not
independent (i.e. there is an association between Xanthorrhoea johnsoni and Alphitonia excelsa).
The study has indicated that the data itself is unable to show the association between the grass
trees and the red ash. Although the data received from the chi square test has revealed that the
chi- square value has no significance to the probability value of 0.5. The figure 1 shows that
there is no even a single quadrat that shows the presence of both the trees within a single quadrat.
The quadrat 3 even doesn't have a single species of the red ash and grass trees. Whereas one
remarkable finding is the at the distance of the quadrats have increased, the number of the
species in each of the quadrats also shows an increasing tendency. Even the number of the grass
trees have increased gradually as the distance has increased between among the quadrats. The
quadrats 6,7,8,9 shows an increasing trend of the grass trees.
Paraphrase This Document
Need a fresh take? Get an instant paraphrase of this document with our AI Paraphraser
13ECOLOGY
Reference
Bertness, M. D., & Hacker, S. D. (1994). Physical stress and positive associations among marsh
plants. The American Naturalist, 144(3), 363-372.
Bertness, M. D., & Hacker, S. D. (1994). Physical stress and positive associations among marsh
plants. The American Naturalist, 144(3), 363-372.
Castanho, C. T., Oliveira, A. A., & Prado, P. I. (2012). The importance of plant life form on
spatial associations along a subtropical coastal dune gradient. Journal of Vegetation
Science, 23(5), 952-961.
Day, T. A., & Wright, R. G. (1989). Positive plant spatial association with Eriogonum
ovalifolium in primary succession on cinder cones: seed-trapping nurse plants. Vegetatio,
80(1), 37-45.
Gleason, H. A. (1926). The individualistic concept of the plant association. Bulletin of the
Torrey botanical club, 7-26.
Pandey, D. N., & Prakash, N. P. (2014). Tropical Dry Forest Restoration. Science and Practice
of Direct Seeding in a Nutshell. Deep Narayan Pandey. Neha Pandey Prakash. Climate
Change and CDM.
Tálamo, A., Barchuk, A., Cardozo, S., Trucco, C., MarÁs, G., & Trigo, C. (2015). Direct versus
indirect facilitation (herbivore mediated) among woody plants in a semiarid C haco
forest: A spatial association approach. Austral Ecology, 40(5), 573-580.

14ECOLOGY
Thomson, J. D., Weiblen, G., Thomson, B. A., Alfaro, S., & Legendre, P. (1996). Untangling
multiple factors in spatial distributions: lilies, gophers, and rocks. Ecology, 77(6), 1698-
1715.
Thomson, J. D., Weiblen, G., Thomson, B. A., Alfaro, S., & Legendre, P. (1996). Untangling
multiple factors in spatial distributions: lilies, gophers, and rocks. Ecology, 77(6), 1698-
1715.
1 out of 15
Your All-in-One AI-Powered Toolkit for Academic Success.
+13062052269
info@desklib.com
Available 24*7 on WhatsApp / Email
![[object Object]](/_next/static/media/star-bottom.7253800d.svg)
Unlock your academic potential
© 2024 | Zucol Services PVT LTD | All rights reserved.