Coursework: Spatial Analysis of Land Use Conversion in Melbourne
VerifiedAdded on 2023/04/04
|16
|2976
|435
Report
AI Summary
This report delves into the spatial distribution of land use conversion, focusing on the case study of Melbourne, Australia. It explores the impact of urban expansion on agricultural land, the conversion of land for industrial and residential purposes, and the resulting changes in economic activities. The report examines different types of spatial distribution, including uniform, random, and clustered patterns, and analyzes how these patterns relate to land use changes. It presents data on urban density, dwelling counts, and unemployment rates, highlighting the uneven distribution of economic growth and its socio-economic implications. The study emphasizes the importance of protecting peri-urban agricultural areas and considers the challenges and opportunities associated with industrial development. The report also includes discussion on the relationship between economic growth and household income, and the spatial patterns of unemployment in Western Melbourne. The report concludes with a call for careful planning and decision-making to address the challenges of land use conversion and ensure sustainable development.
SPATIAL DISTRIBUTION 1
SPATIAL DISTRIBUTION: SPATIAL ANALYSIS IN LAND USE CONVERSION
By Student’s Name
Course Code and Name
Professor’s Name
University Name
City, State
Date of Submission
SPATIAL DISTRIBUTION: SPATIAL ANALYSIS IN LAND USE CONVERSION
By Student’s Name
Course Code and Name
Professor’s Name
University Name
City, State
Date of Submission
Paraphrase This Document
Need a fresh take? Get an instant paraphrase of this document with our AI Paraphraser
SPATIAL DISTRIBUTION 2
Spatial Distribution in Land Use Conservation
Introduction
Spatial analysis is a method harnessed on the human level and most especially to geographical
statistics. Spatial distribution, on the other hand, is a distribution of a particular trend athwart the
Earth’s surface (Muscato, 2019, pp 12). When this data is represented graphically, then it
becomes essential for geographical statistics that can be seen in many ways. This graphical
distribution may either involve purely raw data of the particular distribution or may require
already processed data for the same dissemination (Muscato, 2019, pp56).
Literature Review
There are different types of spatial distribution. Uniform spatial distribution is a distribution
where there is a notable pattern in a particular region of the same kind of things (Yang and Long,
2016, pp.413-424). Take an example of expensive houses, if all homes in a particular region
were given colors depending on how valuable they were and let’s say the most expensive ones
were given color red. If in one part there was a concentrated number of red dotted houses then
that means in that particular region houses are, and therefore people living there may be high-
class families. It may also mean that there was a conscious decision made years ago to build
those kinds of houses in that region. Random distribution, on the other hand, shows that there
was no prior planning to anything that was done (Yang and Long, 2016, pp.413-424). If in the
case of expensive houses, we find that the red colored houses were randomly distributed in that
region this means that different classes of people live in this area and also that anyone could
build the kind of home they could afford anytime. The clustered spatial distribution shows a
distribution that may not be well evenly distributed but has clumped together (Yang and Long,
SPATIAL DISTRIBUTION 3
2016, pp.413-424). The red colored houses may be in one part and the other kind of houses
grouped in another part together. This may show that the different type of classes in lifestyle
decided to stay together in groups.
Land use conversion is a way of converting a piece of land into another use apart from farming,
animals keeping, cultivation of the soil, harvesting from the property and growing of trees
(Limbo, 2017, pp 78). These other uses could be industrial, commercial, and residential. It could
also be a conversion of a non-agricultural land into agricultural land (Limbo, 2017, pp 60).
Presentation of Economic Activities
In the recent past, land that was used for agriculture has mostly be converted into either
apartments, industries, roads or buildings for businesses. Melbourne, Australia is known to
produce a momentous number of fruits and vegetables that are used in the urban areas (Buxton,
Carey and Phelan, 2016, pp17). However, agricultural production is under threat because of the
growing urban areas around it. Many people have believed that land will always be available for
use, and the improving technology will always increase the production of agricultural products
(Buxton, Carey and Phelan, 2016). This has put pressure for agricultural land to be reduced, and
buildings are built in its place. The need for recreational amenities changes countryside into
residential areas. This, on the other hand, causes land prices to go up, which means many people
would opt not to grow agricultural products. Such a mentality can hurt the food production of
Australia.
Discussions
Melbourne is the second prevalent fabricator of agrarian yields in the Victoria’s Belt. It has a
Gross Production value of amid $1.5 and $A1.2 billion from only about 4000 farms (Buxton,
⊘ This is a preview!⊘
Do you want full access?
Subscribe today to unlock all pages.
Trusted by 1+ million students worldwide
SPATIAL DISTRIBUTION 4
Carey and Phelan, 2016, pp 12). This number is thought to be more if precise data was to be
taken. It produces 50% of the nation's vegetables and nearly 17% of its fruits. Particular fruits
and vegetables grow at a high percentage in Melbourne. These are like strawberries,
cauliflowers, and asparagus; Melbourne on its own, produces 90% of these (Buxton, Carey and
Phelan, 2016, pp24). This clearly shows the importance of these agricultural lands. A lot of
planning and accurate decision-making should be done whenever there is a thought of changing
the use of property in Melbourne lest there be a shortage of food in the country.
Paraphrase This Document
Need a fresh take? Get an instant paraphrase of this document with our AI Paraphraser
SPATIAL DISTRIBUTION 5
SPATIAL DISTRIBUTION 6
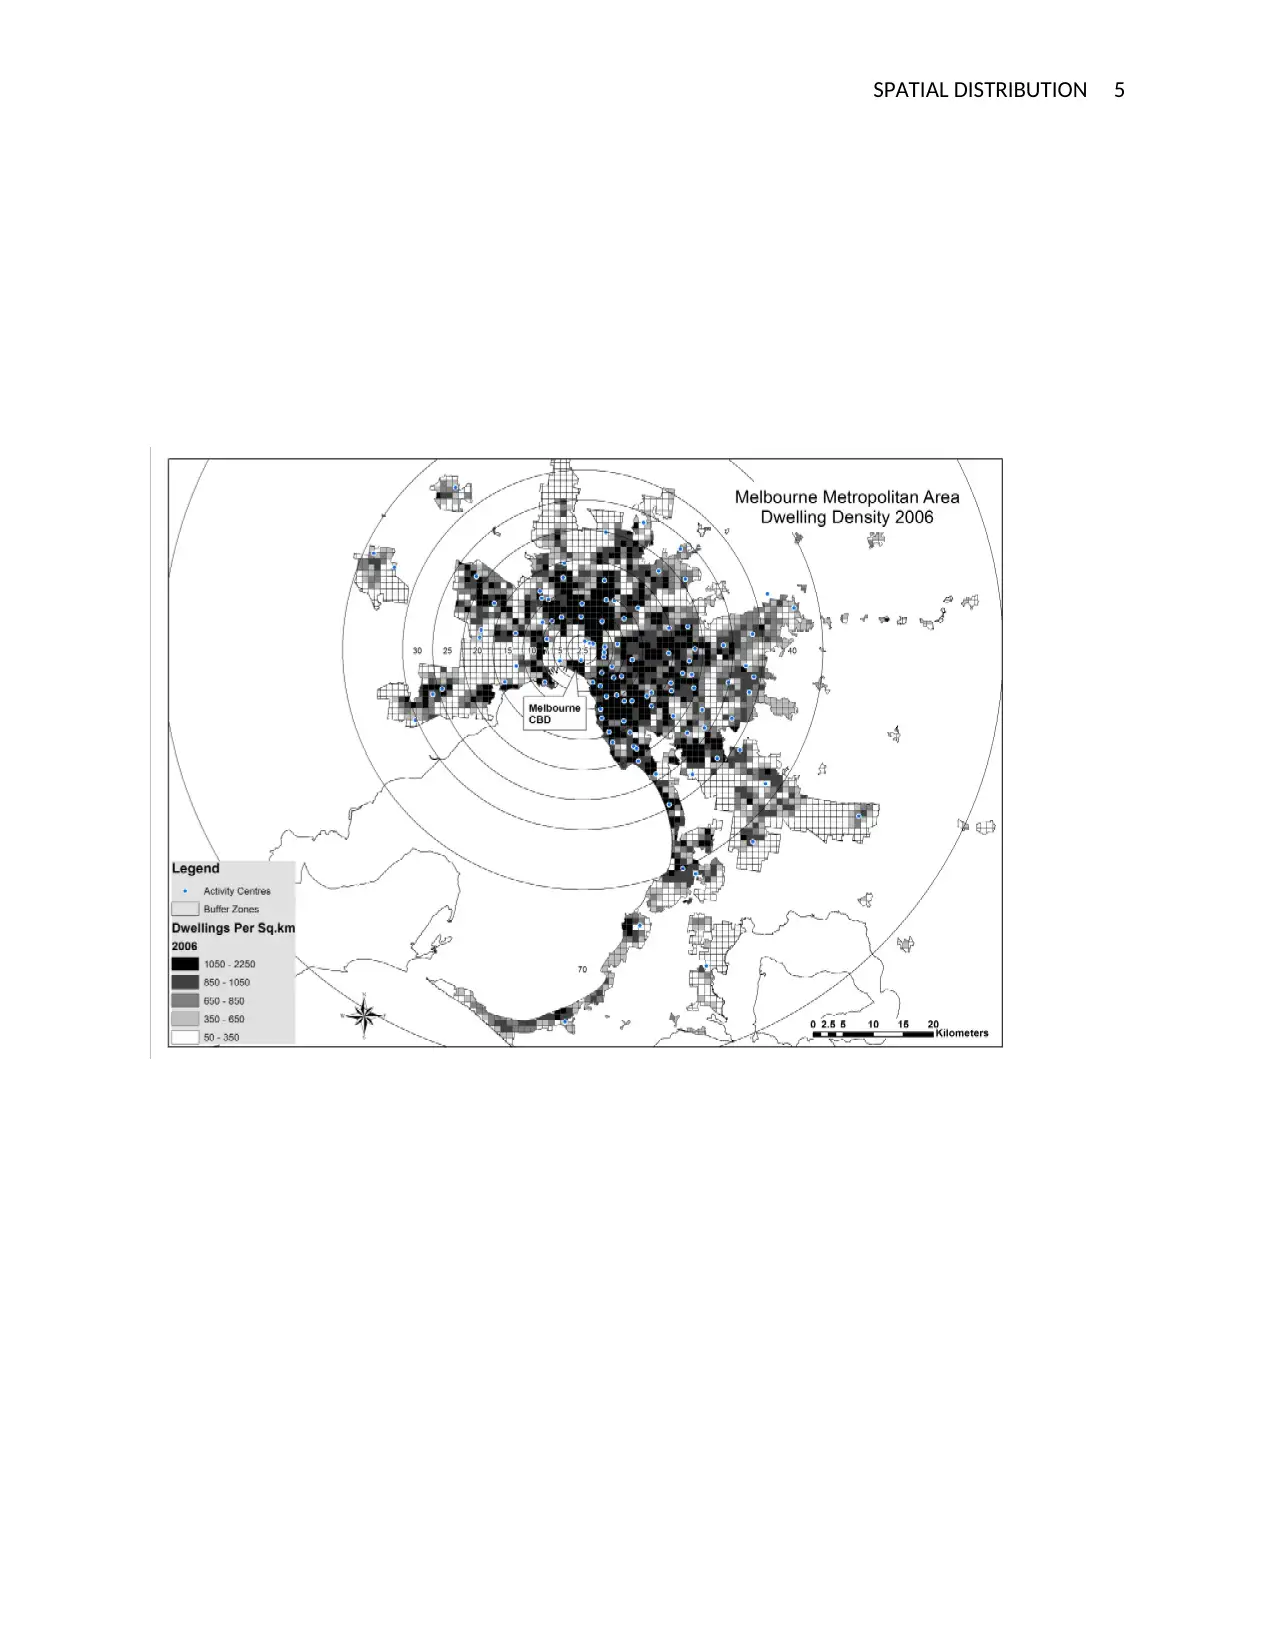
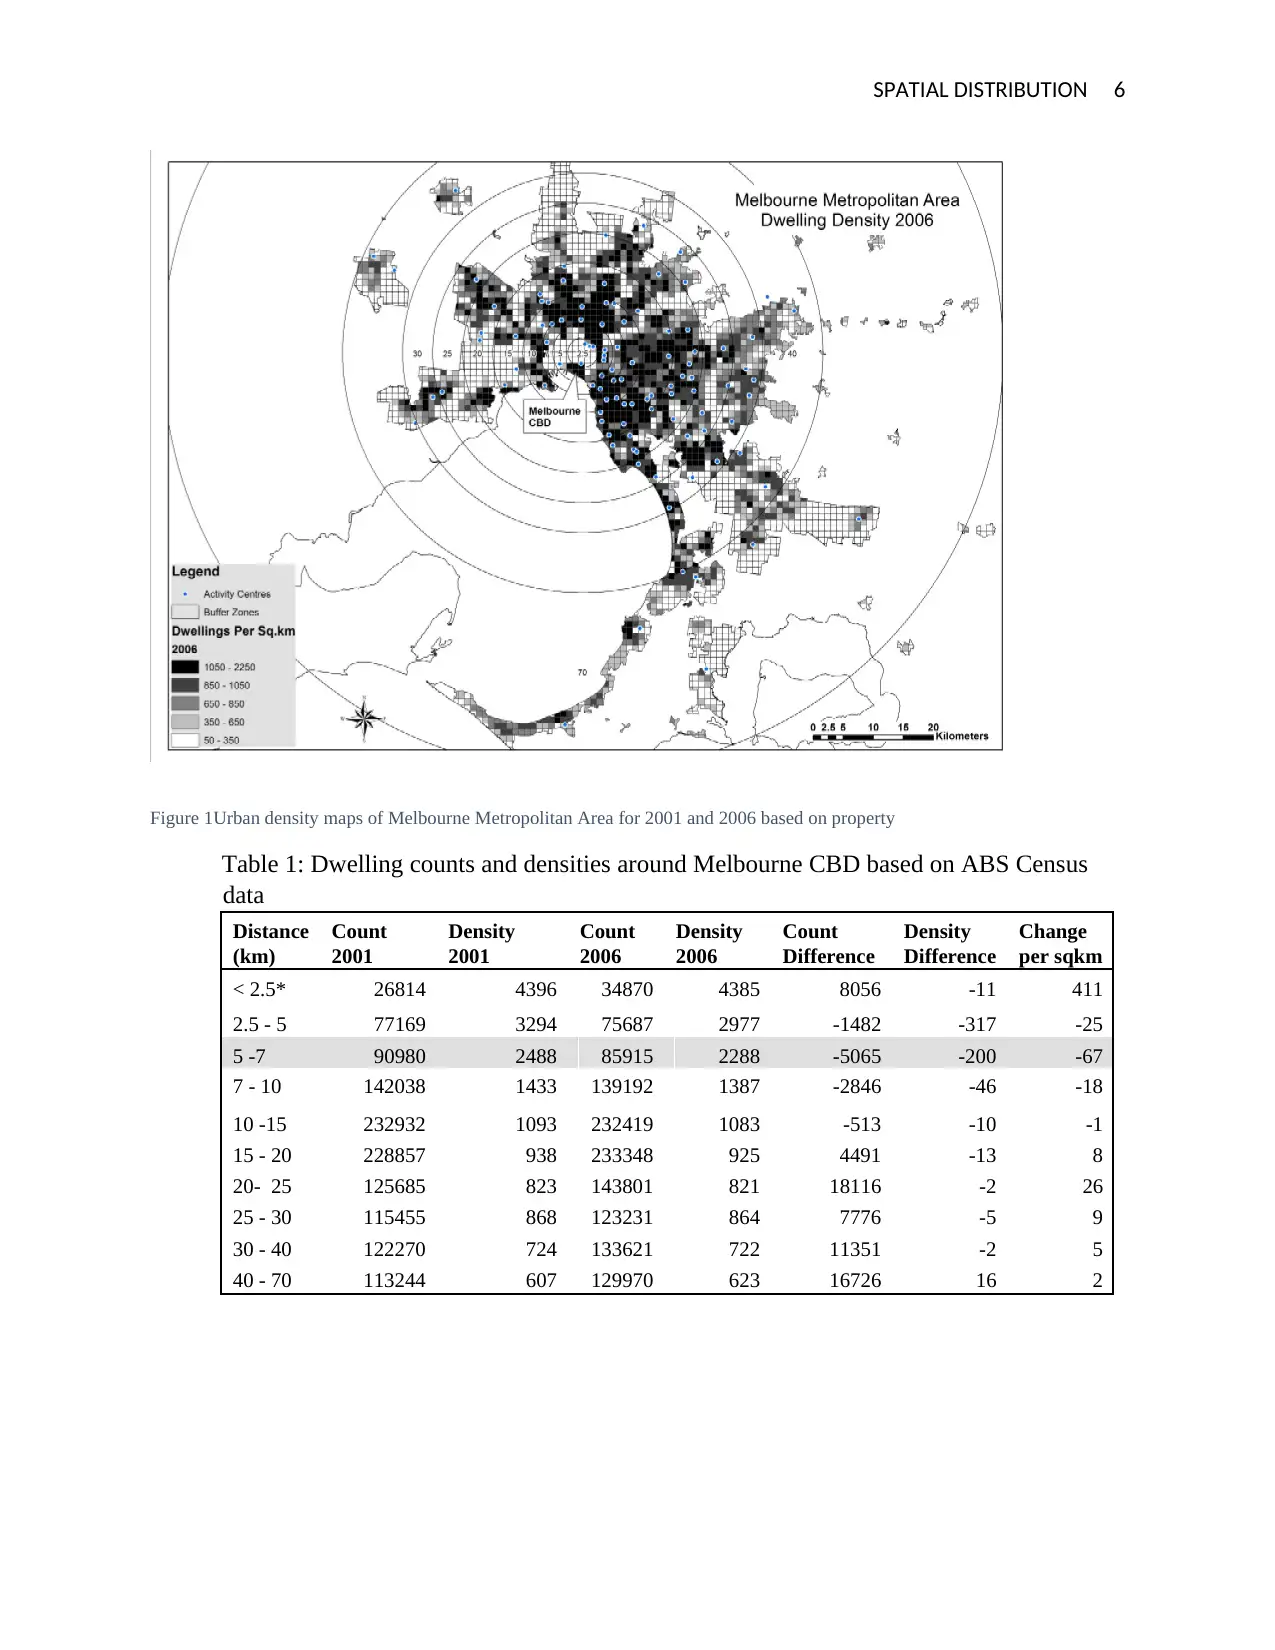
Figure 1Urban density maps of Melbourne Metropolitan Area for 2001 and 2006 based on property
Table 1: Dwelling counts and densities around Melbourne CBD based on ABS Census
data
Distance
(km)
Count
2001
Density
2001
Count
2006
Density
2006
Count
Difference
Density
Difference
Change
per sqkm
< 2.5* 26814 4396 34870 4385 8056 -11 411
2.5 - 5 77169 3294 75687 2977 -1482 -317 -25
5 -7 90980 2488 85915 2288 -5065 -200 -67
7 - 10 142038 1433 139192 1387 -2846 -46 -18
10 -15 232932 1093 232419 1083 -513 -10 -1
15 - 20 228857 938 233348 925 4491 -13 8
20- 25 125685 823 143801 821 18116 -2 26
25 - 30 115455 868 123231 864 7776 -5 9
30 - 40 122270 724 133621 722 11351 -2 5
40 - 70 113244 607 129970 623 16726 16 2
⊘ This is a preview!⊘
Do you want full access?
Subscribe today to unlock all pages.
Trusted by 1+ million students worldwide
SPATIAL DISTRIBUTION 7
Melbourne is known for its beautiful landscapes, agricultural production, biological diversity,
and tourism. A study done by Buxton, Carey, and Phelan (2016, pp19) gave an estimate of
current land and how it would cater to the demand for supply in the future when the population
would have grown (Salvacion, A.R. and Magcale-Macandog, D.B., 2015, pp27). They gave
methods of how rural developments can be limited so that agricultural land in Melbourne can be
protected for agricultural production. Furthermore, they suggested methods of developing the
urban areas so that the rural areas may not be under pressure for developed residential houses.
Melbourne is spatially distributed in terms of agricultural production and urban areas where there
is a lot of developments. The peri-urban areas in Melbourne city consist of the largest producer
of farm products. Therefore, they should be protected from events of residential, commercial,
and industrial buildings. In the years to come, these peri-urban areas are what are going to be the
success stories. They will be able to supply enough food to the ever-increasing population
(Buxton, Carey, and Phelan, 2016, pp 40). The government should restrict the selling and buying
of land in the peri-urban areas to developers to protect agricultural production.
Western Melbourne, on the other hand, is a series of industries. There has been a massive
increase in industries in the area since the 1990s. This side of Melbourne is referred to as an
industrial region (Sigler, Searle, and Martinus, 2018 pp.365-381.). It is an area that is
significantly linked in the transport system nationally and internationally through airports, rail
links, and ports, which has contributed to its entrepreneurship growth (Watkins, 2014, pp.1041-
1065.). But questions still arise of whether these industrializations have brought any benefits to
the less privileged. The possibility is that indeed these people benefit a lot, but in case they did
Paraphrase This Document
Need a fresh take? Get an instant paraphrase of this document with our AI Paraphraser
SPATIAL DISTRIBUTION 8
not, then the government has to rethink of its citizens and how the investments can help them.
The western Melbourne is now a hub of industries because it has undergone land-use conversion.
With every time agricultural land was done away with, more industries were built, and
eventually, the region was known to be purely an industrial zone. This is the area where low-
income citizens were living. In the mid-1980s, there was an increase of low-class houses that
were built in western Melbourne to cater for the large number of those working in the industries.
The number of middle-class homes decreased, which showed that the area was lacking the socio-
economic amenities (City of Melbourne 2015, pp56). Western Melbourne became a place where
most citizens would not prefer to live in except when having no option like being in the low-
class division and looking for employment. It offered cheap land for industries and therefore,
more and more industries were built while the agricultural areas, social amenities, and good
residential houses reduced (Watkins, 2014, pp.1041-1065.). The spatial economy of western
Melbourne benefited a lot in the late 1990s due to lots of vacant lands and the prices, which were
low. This is what led to more establishments of industries. The building of the new industries
also defined economic growth. Depending on where these industries were located, a spatial
analysis would be done concerning business in that particular area.
Many new buildings of investments in one area did not determine its economic achievement
unless the city was a good location for that particular business. If it was a good location, then
business in that area thrived as expected, and that is what Western Melbourne experienced. It
was located close to the CBD, which made investing in it industrially more beneficial (Watkins,
2014, pp.1041-1065.). It has been perceived that whenever there is a high employment rate in a
particular area, then the economy of that region has improved for the better. Figure one below
shows the employment rates in western Melbourne and the whole of the metropolitan area at a
SPATIAL DISTRIBUTION 9
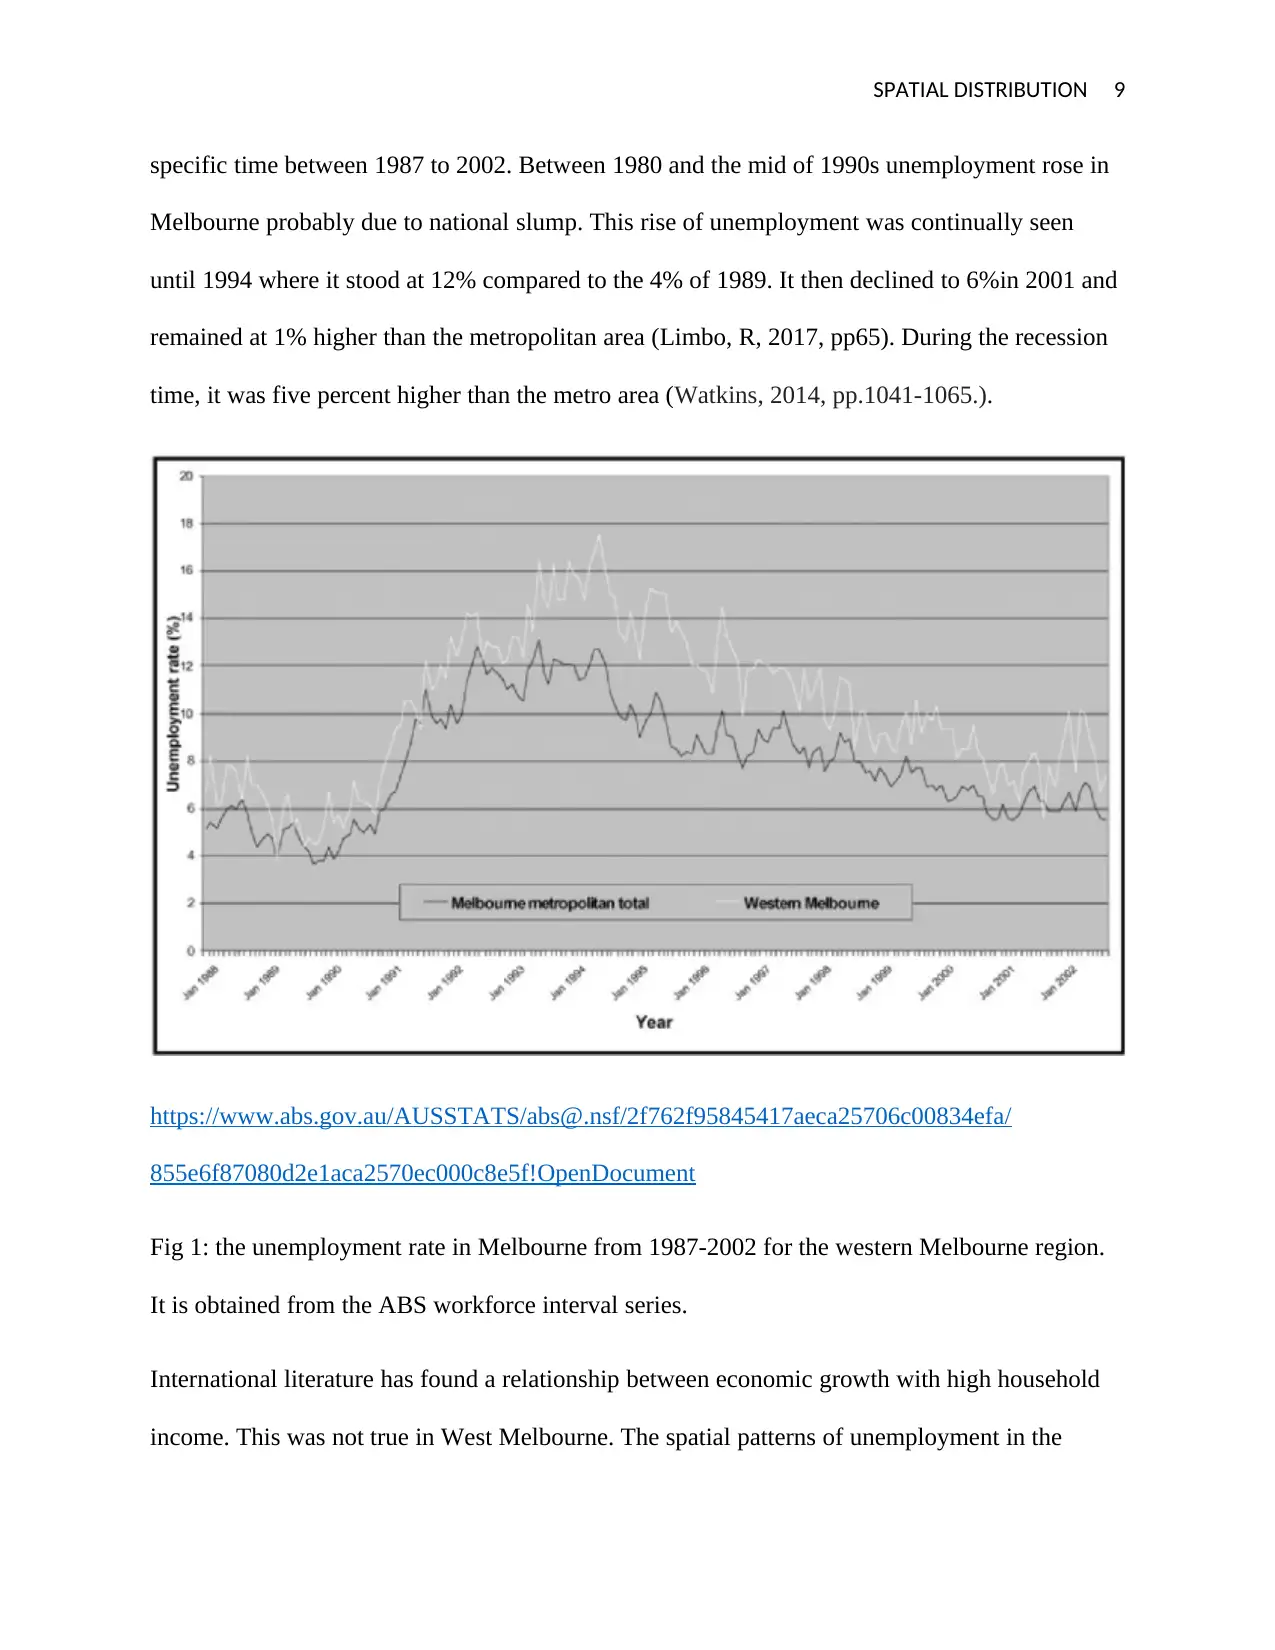
specific time between 1987 to 2002. Between 1980 and the mid of 1990s unemployment rose in
Melbourne probably due to national slump. This rise of unemployment was continually seen
until 1994 where it stood at 12% compared to the 4% of 1989. It then declined to 6%in 2001 and
remained at 1% higher than the metropolitan area (Limbo, R, 2017, pp65). During the recession
time, it was five percent higher than the metro area (Watkins, 2014, pp.1041-1065.).
https://www.abs.gov.au/AUSSTATS/abs@.nsf/2f762f95845417aeca25706c00834efa/
855e6f87080d2e1aca2570ec000c8e5f!OpenDocument
Fig 1: the unemployment rate in Melbourne from 1987-2002 for the western Melbourne region.
It is obtained from the ABS workforce interval series.
International literature has found a relationship between economic growth with high household
income. This was not true in West Melbourne. The spatial patterns of unemployment in the
⊘ This is a preview!⊘
Do you want full access?
Subscribe today to unlock all pages.
Trusted by 1+ million students worldwide
SPATIAL DISTRIBUTION 10
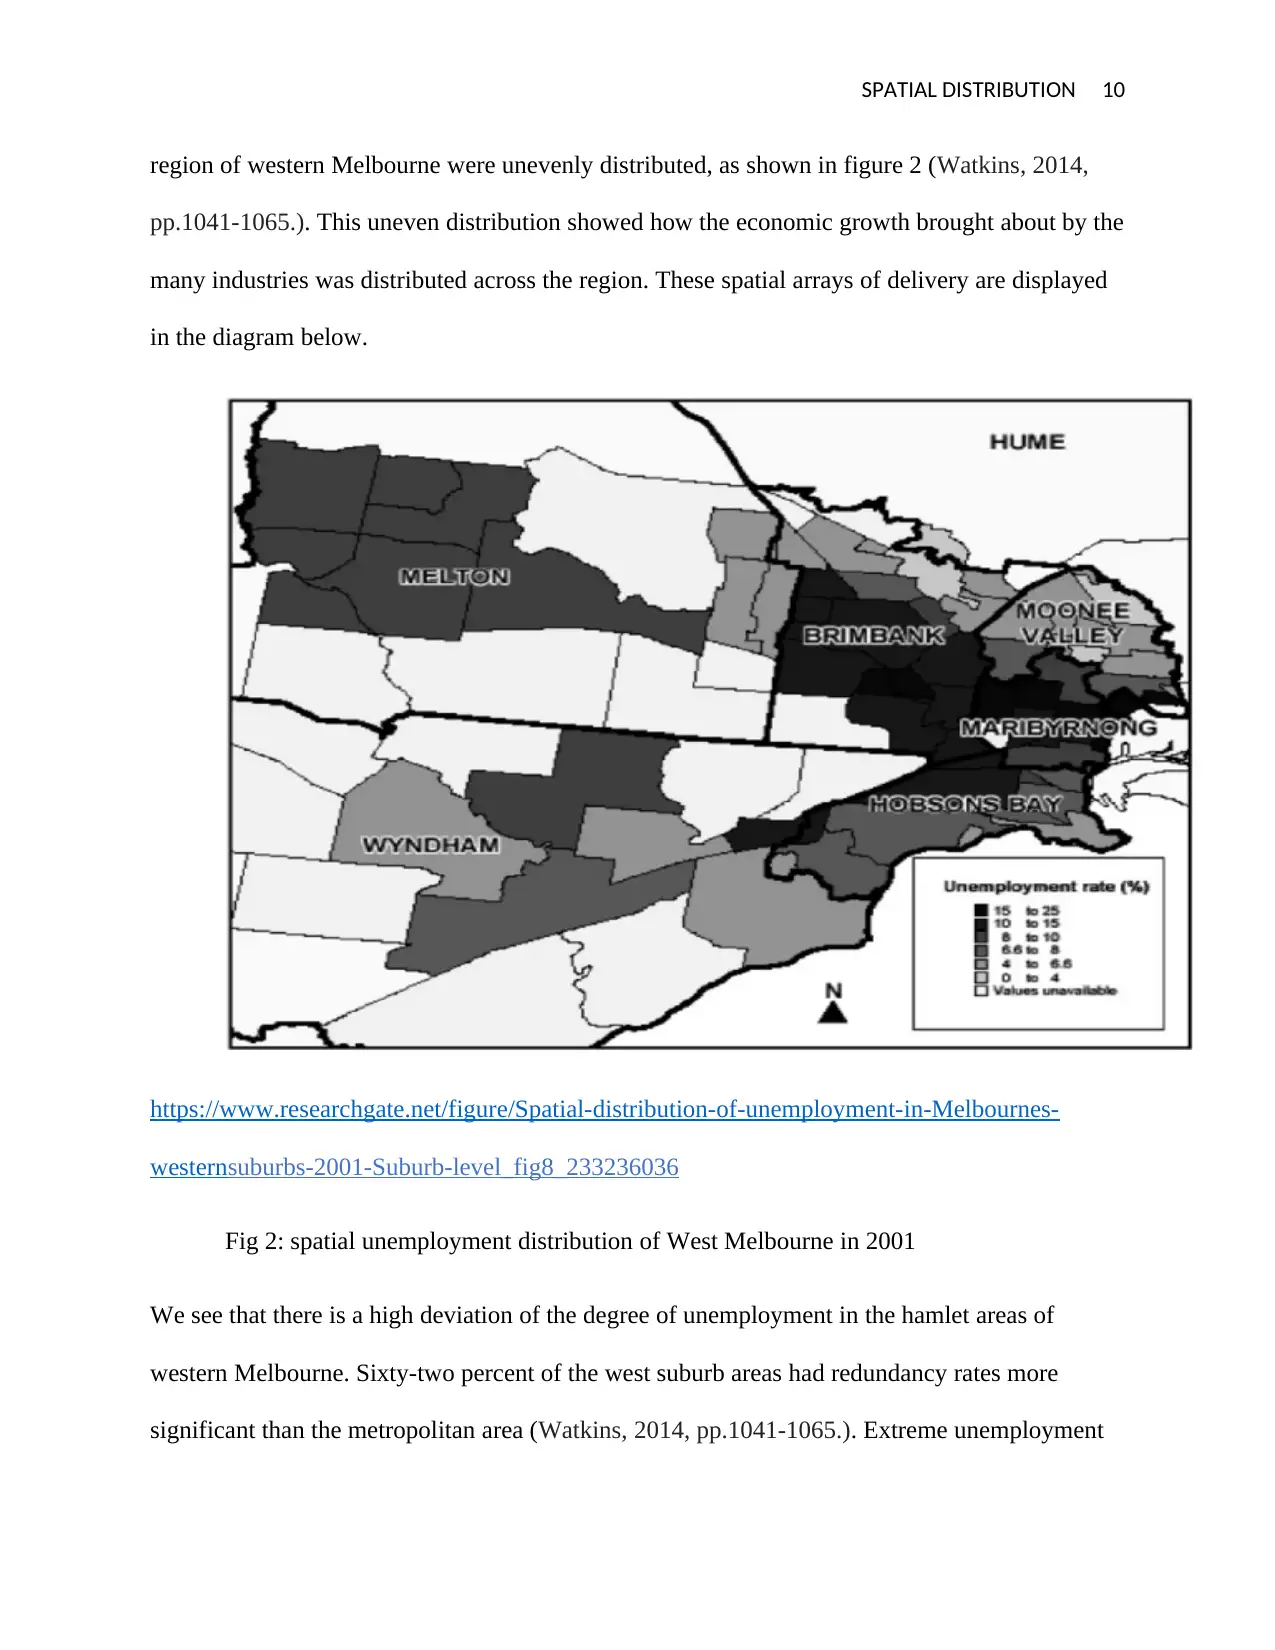
region of western Melbourne were unevenly distributed, as shown in figure 2 (Watkins, 2014,
pp.1041-1065.). This uneven distribution showed how the economic growth brought about by the
many industries was distributed across the region. These spatial arrays of delivery are displayed
in the diagram below.
https://www.researchgate.net/figure/Spatial-distribution-of-unemployment-in-Melbournes-
westernsuburbs-2001-Suburb-level_fig8_233236036
Fig 2: spatial unemployment distribution of West Melbourne in 2001
We see that there is a high deviation of the degree of unemployment in the hamlet areas of
western Melbourne. Sixty-two percent of the west suburb areas had redundancy rates more
significant than the metropolitan area (Watkins, 2014, pp.1041-1065.). Extreme unemployment
Paraphrase This Document
Need a fresh take? Get an instant paraphrase of this document with our AI Paraphraser
SPATIAL DISTRIBUTION 11
is spatially intense n the industrial zones of northern Hobsons, southern Brimbank and western
Maribyrnong. It is seen to stretch mostly in the regions of the north too. This is surprising
considering that it is in these areas that a lot of industrial investments took place. The investment
areas were concerted in Wyndham, Brimbank, Hobsons Bay, and Maribyrnong (Rasmussen, Van
Hulten, Maharaj, Sheehan, Welsh, and Weller, 2010, pp 14). This shows that socio-economic
problems were not less around the same time; there were lots of investments in these areas. This
is probably due to the recession the country was going through brought about by constriction of
financial strategy. Another aspect that was spatially distributed is the household income forms.
This distribution will also show how unevenly distributed economic growth across the region
was. Some areas got more advantage than the rest. The places that had lots of industrial
investments also had little increase in the household income just as we found the unemployment
rates. It goes by logic after all that where there are high unemployment rates, the household
income would also not increase as much (Watkins, 2014, pp.1041-1065.). Figure two shows a
distribution of the household increase in revenue who earn more than $1000 per week. Less than
35% of households made more than $1000(Watkins, 2014, pp.1041-1065.). These regions
included the zones of Hobsons. Southern Brimbank, portions of Melton, Moonee Valley, and
Windham. The household income increases, as seen above, is a foreshadow of how unevenly the
economic growth was distributed. The growth was distributed along spatial lines; there was no
even distribution of the financial advantage and more saddening is that most regions where these
industries had been built were the areas which faced high unemployment rates and low
household income. The socio-economic conditions were spatially patterned. It was cited that
connection to the transport systems, cheap industrial lands, and the accomplishment of the WRR
was what brought economic change in Melbourne.
SPATIAL DISTRIBUTION 12
Nevertheless, the spatial outlines of unemployment and even distribution of income only
promoted the areas far away from the regions of the industries. This is because firms that built up
the industries invested more capital and therefore more technology. Therefore, less labor was
required to bring in good production (Watkins, 2014, pp.1041-1065.). This thus meant that
unemployment rates in these areas increased. Due to unemployment, a lot of households received
less income. The economic growth was enjoyed by the stakeholders of the industries who lived
away from the industries point of location. That is why their areas were more developed. They
had high household income and fewer rates of unemployment. The economic benefits did not go
to the less privileged but to the already fortunate.
Census of land use done in 2015 revealed that 450,300 jobs were available and had employed a
lot of people. Leading employment business included finance and insurance at 62,700, public
administration and safety at 40,900 and scientific and technical services which lead at 78, 000
jobs. Since 2013 there has been an increase in employment in the municipality where business
services led at 11% (city of Melbourne, 2015, pp 20). The city has continued to expand and
more buildings established. Residential and commercial buildings, car parks, and office space
and residential accommodation has dramatically increased over the past few years. The
manufacturing companies, on the other hand, dropped in Melbourne due to its set up in the
surrounding areas and not the CBD. This has proved as a threat to the agricultural lands that
support , and therefore, the government might need to find ways to protect these farmlands.
The Victorian government has been focused on protecting the farm lands of Melbourne. One of
the ways this has been done is by identifying the most fertile grounds and zoning them off.
Policies should be put in place dictating the no-sale to the infrastructure of such lands except for
agricultural purposes. The government also needs to realize that without protecting these lands,
⊘ This is a preview!⊘
Do you want full access?
Subscribe today to unlock all pages.
Trusted by 1+ million students worldwide
1 out of 16
Your All-in-One AI-Powered Toolkit for Academic Success.
+13062052269
info@desklib.com
Available 24*7 on WhatsApp / Email
![[object Object]](/_next/static/media/star-bottom.7253800d.svg)
Unlock your academic potential
Copyright © 2020–2026 A2Z Services. All Rights Reserved. Developed and managed by ZUCOL.