PACC6000 Financial Analysis of Specialty Fashion Group Ltd 2018
VerifiedAdded on 2023/06/12
|17
|3821
|130
Report
AI Summary
This report presents a financial analysis of Specialty Fashion Group Limited from 2015 to 2017, utilizing horizontal, vertical, and ratio analyses. The company, an Australian specialty retailer of women's fashion, operates brands like Miller's Retail and Katies. The analysis reveals financial challenges, with consistent unprofitability indicated by profitability ratios. Gearing ratios suggest financial weakness and potential bankruptcy risk. The report highlights inefficiencies in asset utilization, inventory turnover, and accounts receivable collection. The conclusion emphasizes the need for management to implement measures to improve financial performance.
Running head: FINANCIAL ANALYSIS OF SPECIALTY FASHION GROUP LTD 1
Financial Analysis of Specialty Fashion Group Ltd
Author
Institution
Date
Financial Analysis of Specialty Fashion Group Ltd
Author
Institution
Date
Paraphrase This Document
Need a fresh take? Get an instant paraphrase of this document with our AI Paraphraser
FINANCIAL ANALYSIS OF SPECIALTY FASHION GROUP LTD 2
Executive Summary
Paper presents financial analysis of Specialty Fashion Group Limited over the last
three financial years; that is, 2015, 2016 and 2017. This would be based on horizontal,
vertical and ratio analysis. Specialty Fashion Group Limited is an Australian listed company
that operates as specialty retailer of the women’s fashion products. It operates several
women’s clothing brands comprise of Miller’s Retail, Katies, Rivers, Crossroads, City Chic
and Autography. Based on the financial analysis above; that is, horizontal, vertical and
financial ratio analysis, it can be concluded that Specialty Fashion Group Limited has been
experiencing some financial challenges over the past three financial years. In essence, based
on the profitability ratios, it is evident that the company has not been profitable over the past
three years. In addition, based on the gearing ratios it is evident that Specialty Fashion Group
Limited has been financially weak and therefore risk going bankrupt or being liquidated.
Therefore, there is a need for the management to undertake the necessary measures in
improving its financial performance.
FINANCIAL ANALYSIS OF SPECIALTY FASHION GROUP LTD 3
Introduction
Specialty Fashion Group Limited is an Australian listed company that operates as
specialty retailer of the women’s fashion products. It operates several women’s clothing
brands comprise of Miller’s Retail, Katies, Rivers, Crossroads, City Chic and Autography. Its
miller brands is said to operate around 350 store while its Katies delivers clothing for all form
of occasions, from the work wear and fashion pieces to denim and loungewear. On the other
hand, its autography entails design, styling and filling plus-size women (Specialty Fashion
Group Limited, 2017). The company has over 3 million members who are reached via email.
It operates around 1,080 sites across Australia, United States, South Africa and New Zealand.
With these considerations, the paper aims to present financial analysis of Specialty Fashion
Group Limited over the last three financial years; that is, 2015, 2016 and 2017. This would be
based on horizontal, vertical and ratio analysis.
Financial Analysis
Horizontal analysis
Based on the horizontal analysis in Appendix 2, it is evident that the company
experienced slight decrease in its assets, especially in 2017. Further, based on Appendix 4, it
is evident that the company experienced slight decrease in its revenue in 2017 in comparison
to 2016. Its gross profit also decreased over the same period with 3.03%. This decrease could
have been attributed by relatively high cost of sales. In addition, the company net loss is said
to have decreased over the period with a significant margin. Additionally, based on Appendix
6 below, it is evident that the company cash flows from the operating activities decreased in
2017. This trend was also observed in its cash from the investing activities. Nonetheless, the
cash flow used from the financial activities increased with a significant margin in 2017.
Vertical analysis
⊘ This is a preview!⊘
Do you want full access?
Subscribe today to unlock all pages.
Trusted by 1+ million students worldwide
FINANCIAL ANALYSIS OF SPECIALTY FASHION GROUP LTD 4
From the vertical analysis in Appendix 3 and Appendix 5, it is clear that the company
has been struggling over the years. This is evident by negative percentage of the net income
over sales in the last three years.
Financial Ratio Analysis
Ratio analysis is considered as mathematical comparison of the financial statement
categories or items. This assist in understanding how well an organization is performing. In
other words, ratio analysis is one of the most widespread and common financial tool utilized
in examining an entity’s financial standing (Daniel, 2015). It gives room to compare
organizations across sectors, small and big, in identifying their weaknesses and strengths. In
this case, financial ratios which would be analysed are categorized into profitability, gearing,
profitability and efficiency ratios.
Profitability
Rate of return on net sales
The ratio helps in measuring proportion of the net profit or loss earned for every
amount of dollar of sales. It is used in measuring profitability of an organization over a
specified period. It is usually computed as;
Rate of return on net sales = Net income/total sales
As such return on net sales over the last three years was;
2015 =-0.56%
2016 = -0.27%
2017 = -1.04%
Rate of return on total assets
This ratio examines the relationship that exists between net income of the
organization and its total assets (Daniel, 2015). It assists in measuring how efficiently the
company utilized its assets in generating income. The ratio is computed as;
Paraphrase This Document
Need a fresh take? Get an instant paraphrase of this document with our AI Paraphraser
FINANCIAL ANALYSIS OF SPECIALTY FASHION GROUP LTD 5
Rate of return on the total assets = Net income/total assets
As such the company ROA over the last three years was;
2015 = -2.06%
2016 = -1.00%
2017 = -4.14%
Asset turnover
This ratio helps in assessing how efficient an organization is in using its assets. In
other words, the ratio helps in assessing whether company management is efficient or
effective enough in spending its assets in generating sales or revenue.
Asset turnover r= Sales/total assets
As such the company asset turnover over the last three years was;
2015 = 3.66
2016 = 3.78
2017 = 3.99
Rate of return on ordinary shareholders’ equity
The ratio examines relationship in between organization’s equity and net income. It is
the measure of how efficiently an organization used its shareholders’ equity in generating
income (Daniel, 2015). The ratio is computed as;
Rate of return on equity = Net income/total shareholders’ equity
As such the company ROE over the last three years was;
2015 = -6.82%
2016 = -4.13%
2017 = -19.03%
Earnings per share
FINANCIAL ANALYSIS OF SPECIALTY FASHION GROUP LTD 6
This is the proportion of the organization’s income allocated to every outstanding
share. It serves as the sign of an organization’s profitability (Daniel, 2015). It is computed as;
EPS = (Net income-dividends) average outstanding shares.
As such the company EPS over the last three years was;
2015 =-0.02
2016 =-0.01
2017 =-0.04
Liquidity
Working capital
This is the form of financial ratio used in measuring cash flow within an organization.
In other words, it represent amount of cash capitalized in the resources which are mainly
subject to speedy turnover (Daniel, 2015). The ratio is computed as;
Total current assets – total current liabilities
As such the company working capital over the last three years was;
2015 = 14,988
2016 = 2,608
2017 = 2,568
Current ratio
This ratio is considered as the reflection of the financial strength. In other words, it is
viewed as number of times an organization’s current assets is said to exceed the current
liabilities. It is computed as follows;
current assets/current liabilities
As such the company current ratio over the last three years was;
2015 = 1.15
2016 = 1.02
⊘ This is a preview!⊘
Do you want full access?
Subscribe today to unlock all pages.
Trusted by 1+ million students worldwide
FINANCIAL ANALYSIS OF SPECIALTY FASHION GROUP LTD 7
2017 = 1.02
Acid-test ratio
The ratio is used in evaluating or testing whether an organization could be in a
position to meet its key obligations even in adverse situations. It is the measure of whether an
organization is capable of settling its debts using its most liquid assets.
This ratio is usually computed following this formula
(current assets- total inventories)/total current liabilities
As such the company acid-test over the last three years was;
2015 = 0.26
2016 = 0.25
2017 = 0.23
Inventory turnover
The ratio is used in measuring number of times an entity turns its inventories into
revenue (Faruk & Habib, 2010). It is computed as;
Cost of sales/inventories
As such the company inventory turnover over the last three years was;
2015 =3.68
2016 = 4.14
2017 = 3.92
Days in inventory
The ratio helps in assessing number of days inventories are sold or used within a year
(Daniel, 2015). It is computed as;
Days inventory = 365/Inventory turnover
As such the company days in inventory over the last three years were;
2015 = 99.13 days
Paraphrase This Document
Need a fresh take? Get an instant paraphrase of this document with our AI Paraphraser
FINANCIAL ANALYSIS OF SPECIALTY FASHION GROUP LTD 8
2016 = 88.20 days
2017 = 93.12 days
Gross profit percentage
This is the measure of the proportion of the gross income over total sales. It is also a
measure of an organization’s profitability over time (Faruk & Habib, 2010). The ratio is
computed as;
Gross profit/revenue *100%
As such the company gross profit margin over the last three years was;
2015 =58.57%
2016 =55.56%
2017 =55.98%
Accounts receivable turnover
The ratio assist in measuring or assessing number of times an organization turns over
its account receivable (Faruk & Habib, 2010). Higher ratio shows shorter period between
making sales and collecting money from debtors.
Accounts receivable turnover = sales/receivables
As such the company account receivable turnover over the last three years was;
2015 = 93.80
2016 = 87.26
2017 = 89.34
Days’ sales in receivables
The ratio helps in assessing number of days an organization’s account receivable
remain outstanding (Alrafadi & Md-Yusuf, 2011). Low ratio is considered better since it
means that the company is able to collect cash owed by debtors on time and fasters. It is
calculated as follows;
FINANCIAL ANALYSIS OF SPECIALTY FASHION GROUP LTD 9
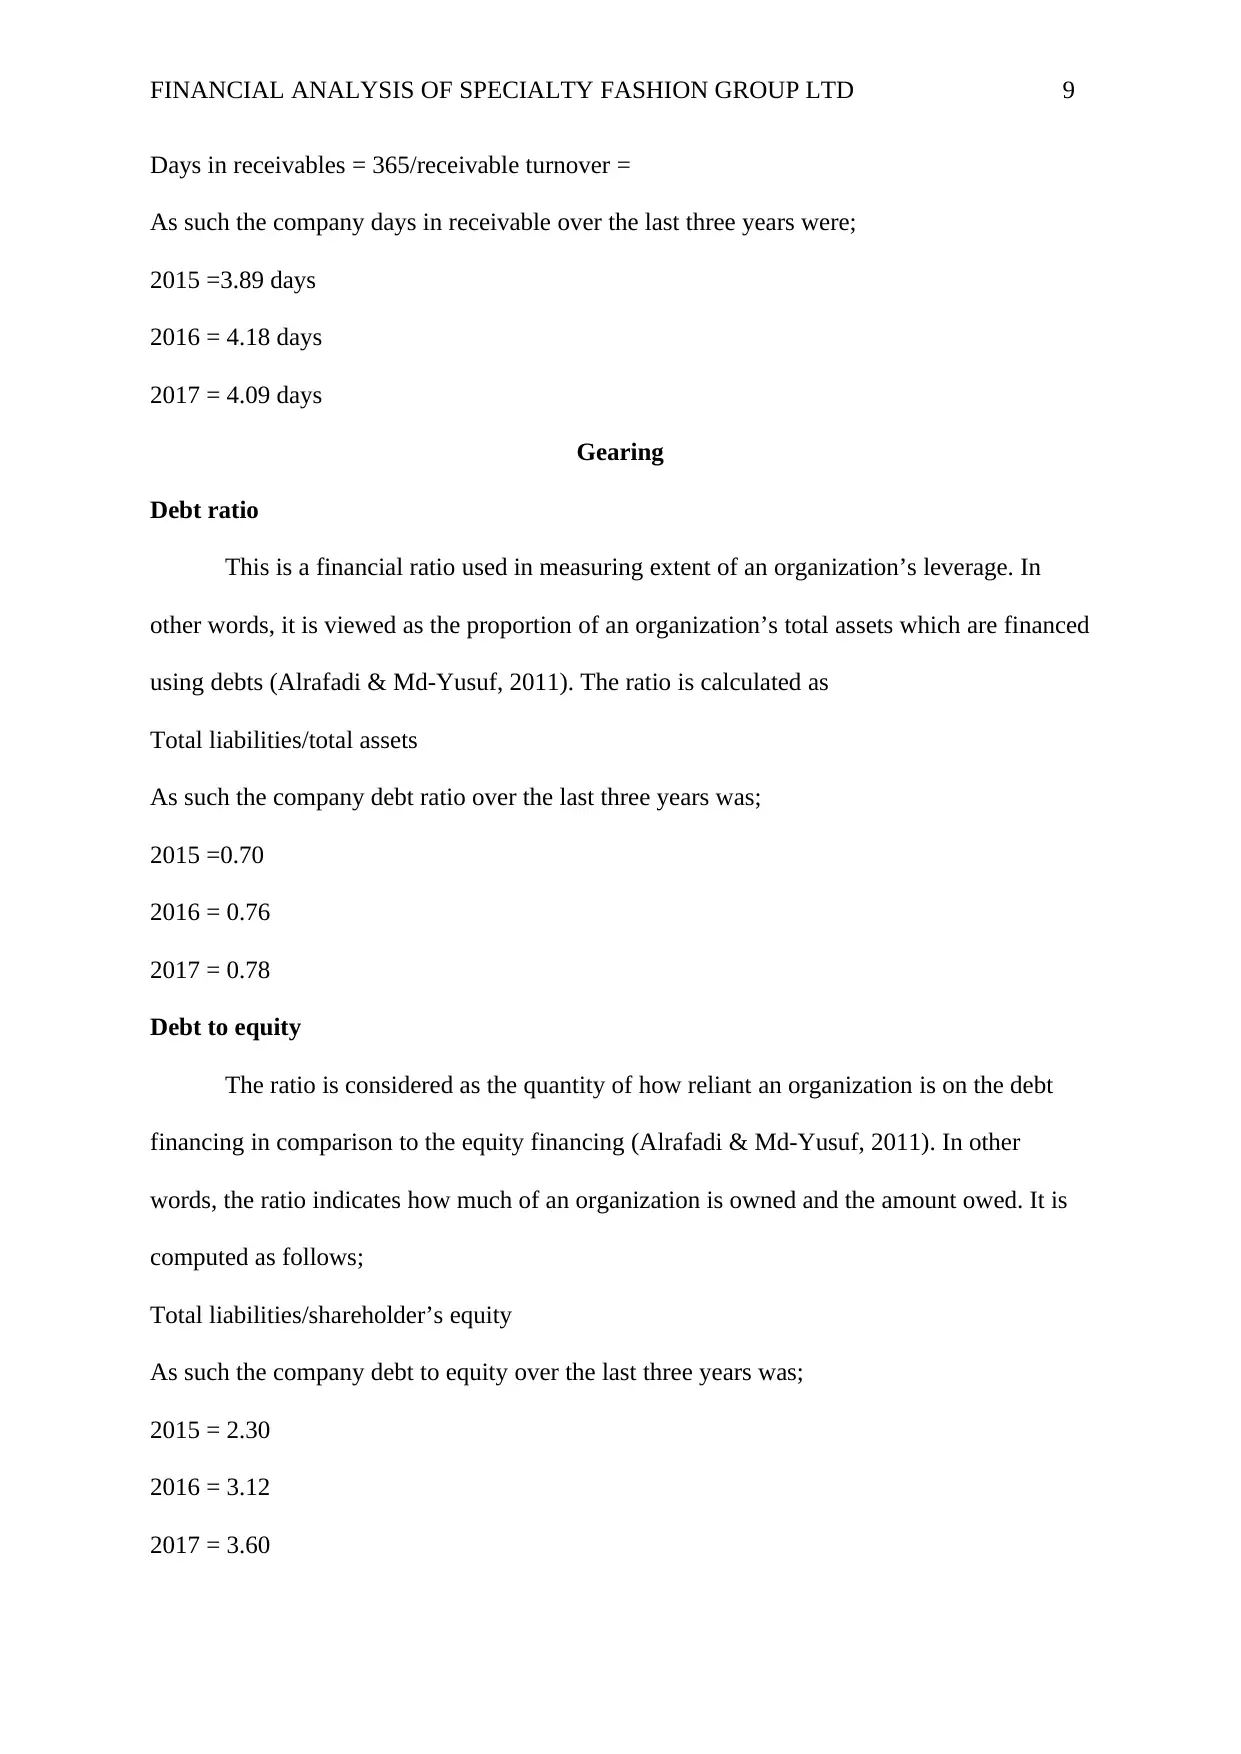
Days in receivables = 365/receivable turnover =
As such the company days in receivable over the last three years were;
2015 =3.89 days
2016 = 4.18 days
2017 = 4.09 days
Gearing
Debt ratio
This is a financial ratio used in measuring extent of an organization’s leverage. In
other words, it is viewed as the proportion of an organization’s total assets which are financed
using debts (Alrafadi & Md-Yusuf, 2011). The ratio is calculated as
Total liabilities/total assets
As such the company debt ratio over the last three years was;
2015 =0.70
2016 = 0.76
2017 = 0.78
Debt to equity
The ratio is considered as the quantity of how reliant an organization is on the debt
financing in comparison to the equity financing (Alrafadi & Md-Yusuf, 2011). In other
words, the ratio indicates how much of an organization is owned and the amount owed. It is
computed as follows;
Total liabilities/shareholder’s equity
As such the company debt to equity over the last three years was;
2015 = 2.30
2016 = 3.12
2017 = 3.60
⊘ This is a preview!⊘
Do you want full access?
Subscribe today to unlock all pages.
Trusted by 1+ million students worldwide
FINANCIAL ANALYSIS OF SPECIALTY FASHION GROUP LTD 10
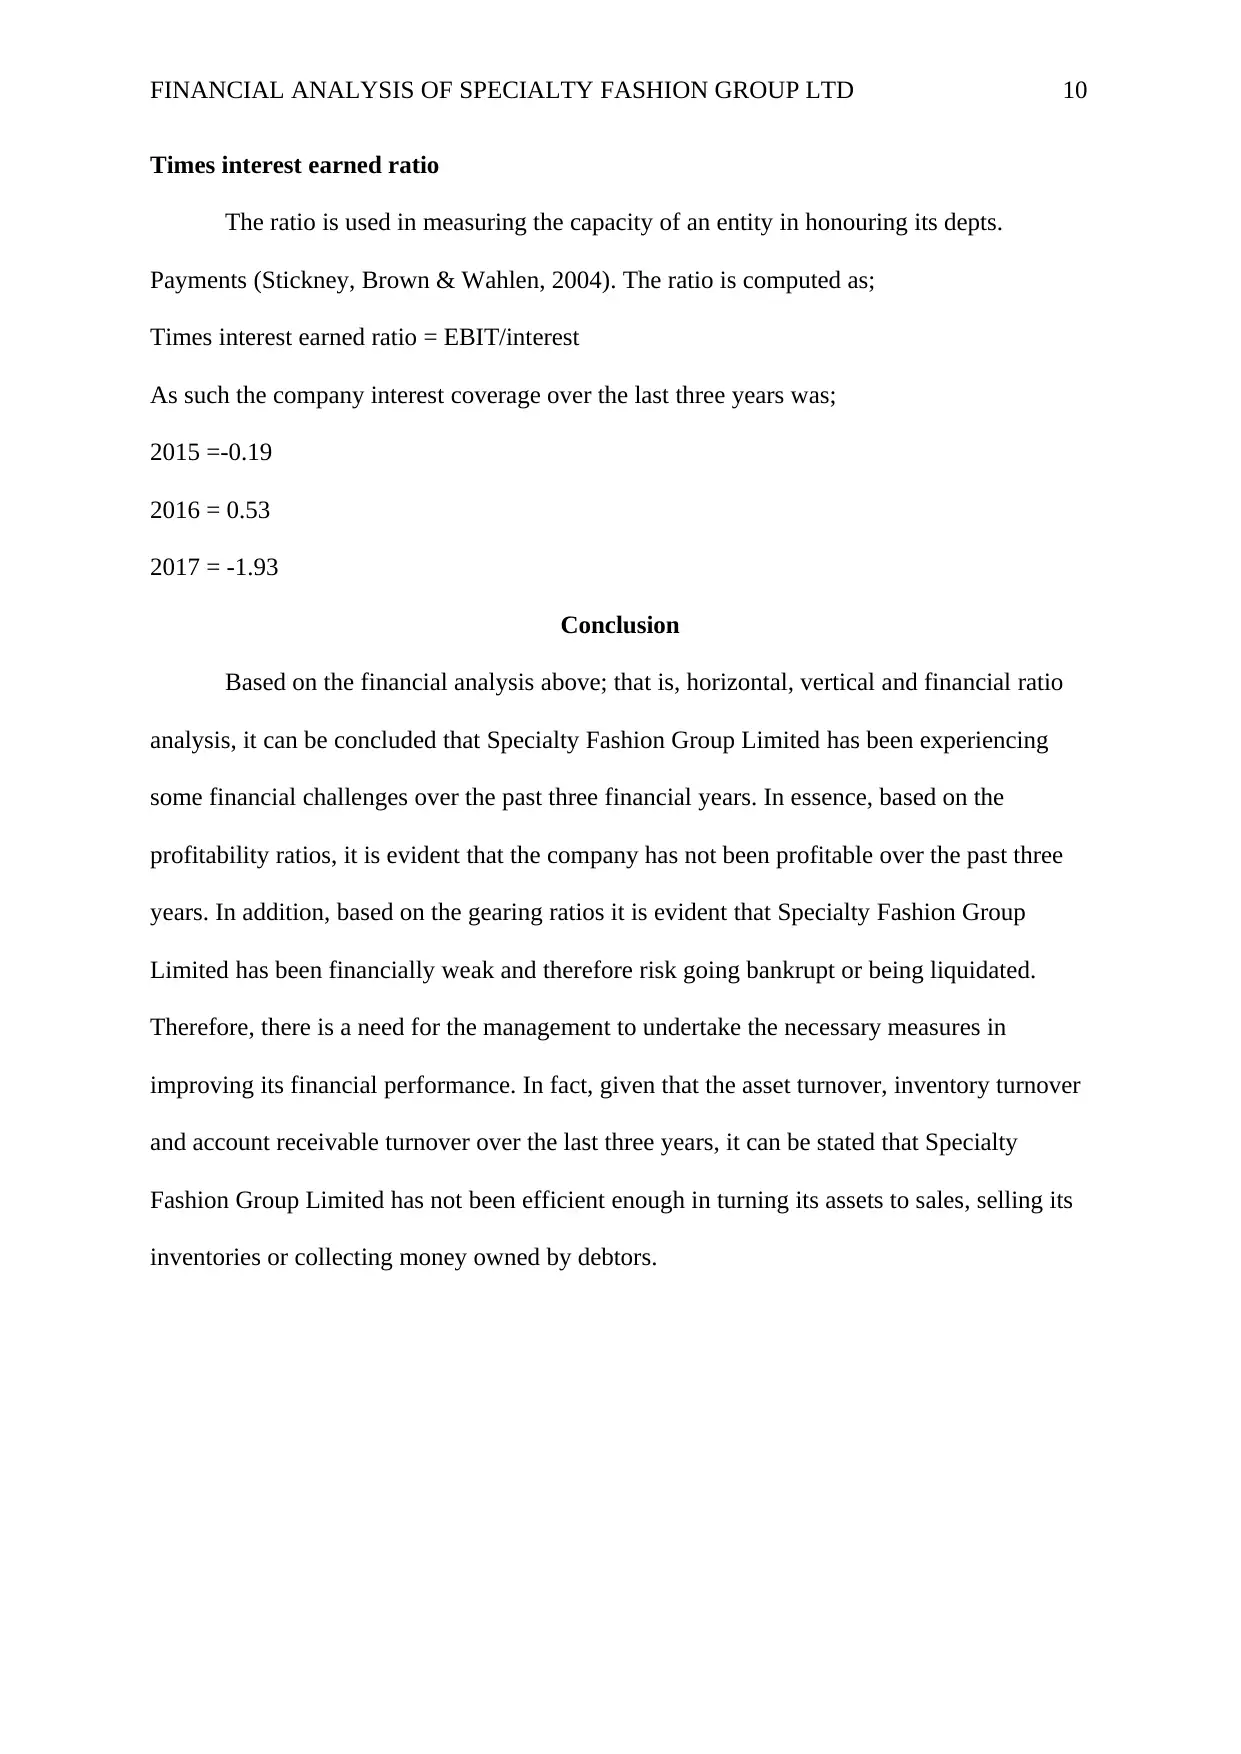
Times interest earned ratio
The ratio is used in measuring the capacity of an entity in honouring its depts.
Payments (Stickney, Brown & Wahlen, 2004). The ratio is computed as;
Times interest earned ratio = EBIT/interest
As such the company interest coverage over the last three years was;
2015 =-0.19
2016 = 0.53
2017 = -1.93
Conclusion
Based on the financial analysis above; that is, horizontal, vertical and financial ratio
analysis, it can be concluded that Specialty Fashion Group Limited has been experiencing
some financial challenges over the past three financial years. In essence, based on the
profitability ratios, it is evident that the company has not been profitable over the past three
years. In addition, based on the gearing ratios it is evident that Specialty Fashion Group
Limited has been financially weak and therefore risk going bankrupt or being liquidated.
Therefore, there is a need for the management to undertake the necessary measures in
improving its financial performance. In fact, given that the asset turnover, inventory turnover
and account receivable turnover over the last three years, it can be stated that Specialty
Fashion Group Limited has not been efficient enough in turning its assets to sales, selling its
inventories or collecting money owned by debtors.
Paraphrase This Document
Need a fresh take? Get an instant paraphrase of this document with our AI Paraphraser
FINANCIAL ANALYSIS OF SPECIALTY FASHION GROUP LTD 11
Appendices
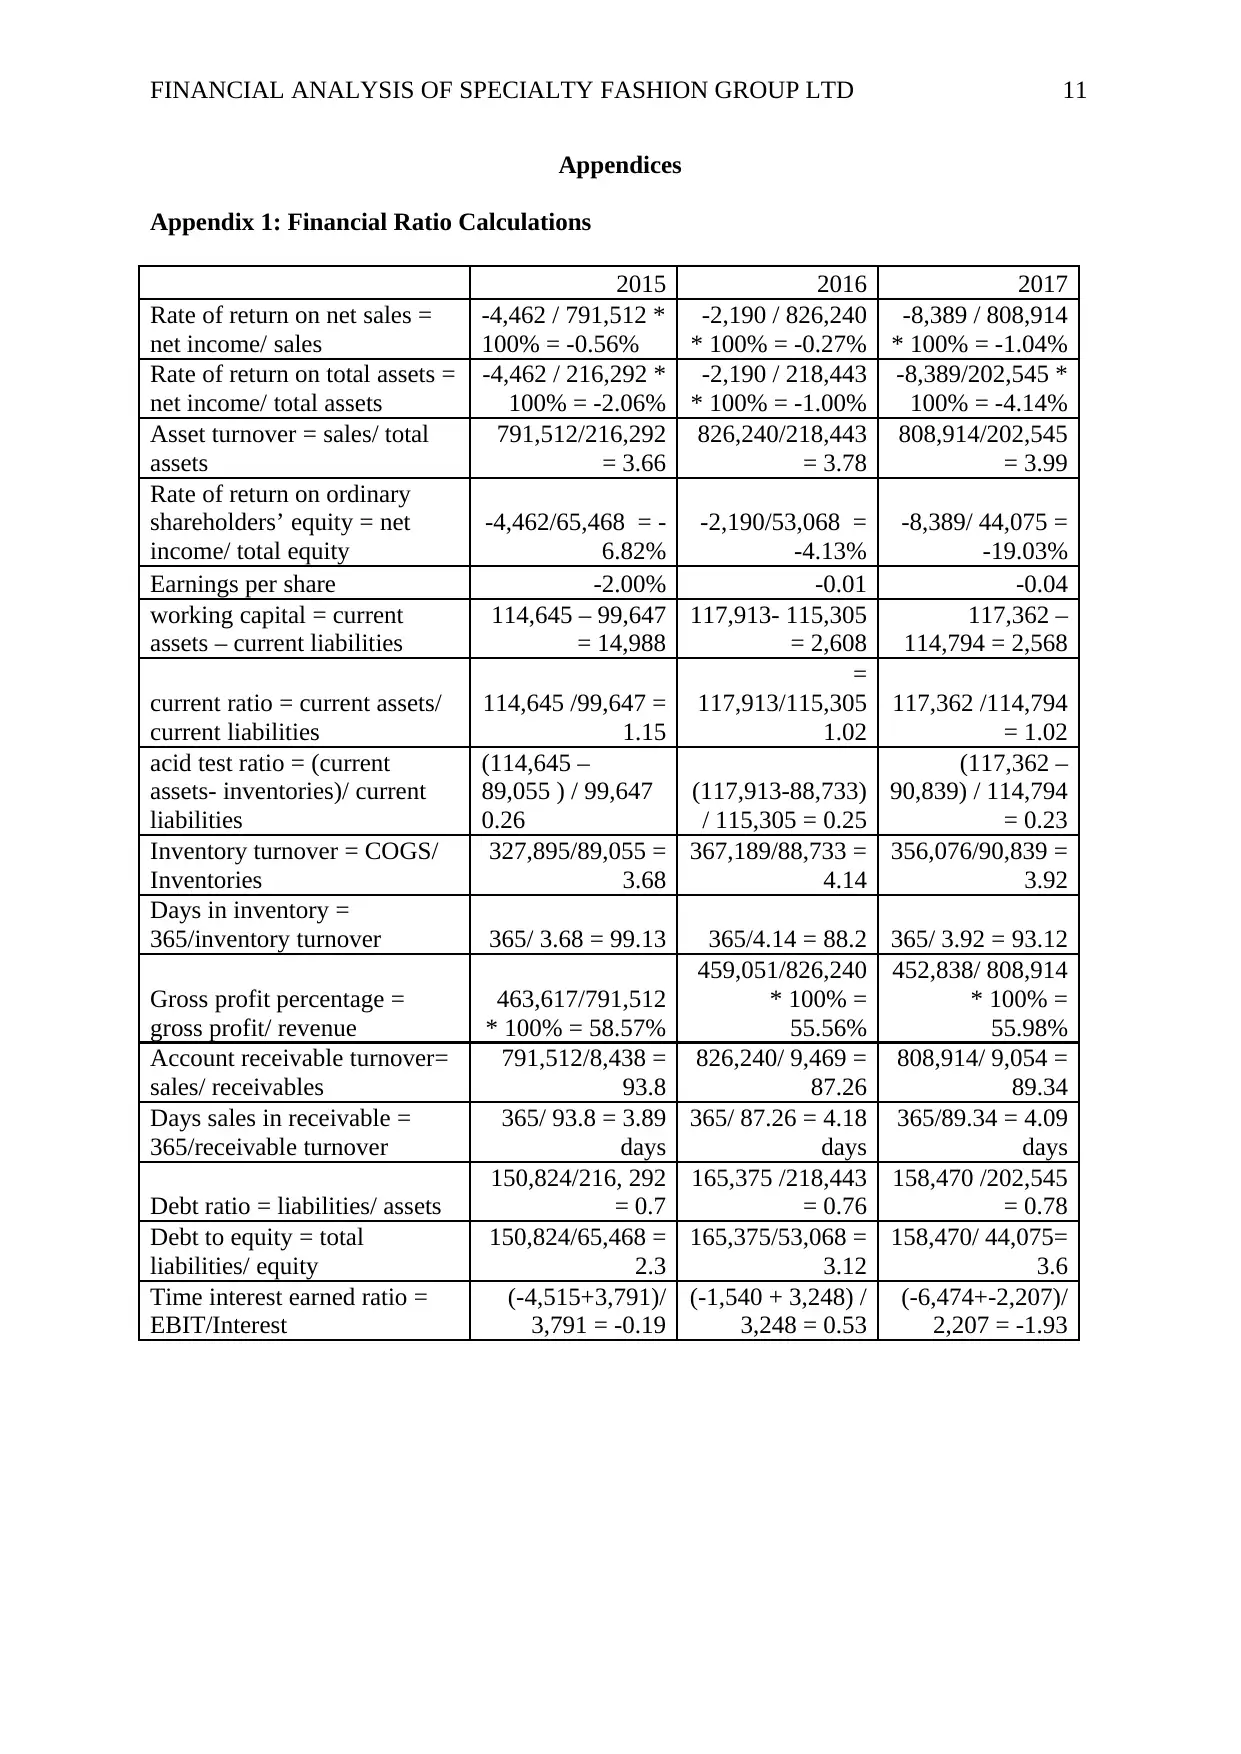
Appendix 1: Financial Ratio Calculations
2015 2016 2017
Rate of return on net sales =
net income/ sales
-4,462 / 791,512 *
100% = -0.56%
-2,190 / 826,240
* 100% = -0.27%
-8,389 / 808,914
* 100% = -1.04%
Rate of return on total assets =
net income/ total assets
-4,462 / 216,292 *
100% = -2.06%
-2,190 / 218,443
* 100% = -1.00%
-8,389/202,545 *
100% = -4.14%
Asset turnover = sales/ total
assets
791,512/216,292
= 3.66
826,240/218,443
= 3.78
808,914/202,545
= 3.99
Rate of return on ordinary
shareholders’ equity = net
income/ total equity
-4,462/65,468 = -
6.82%
-2,190/53,068 =
-4.13%
-8,389/ 44,075 =
-19.03%
Earnings per share -2.00% -0.01 -0.04
working capital = current
assets – current liabilities
114,645 – 99,647
= 14,988
117,913- 115,305
= 2,608
117,362 –
114,794 = 2,568
current ratio = current assets/
current liabilities
114,645 /99,647 =
1.15
=
117,913/115,305
1.02
117,362 /114,794
= 1.02
acid test ratio = (current
assets- inventories)/ current
liabilities
(114,645 –
89,055 ) / 99,647
0.26
(117,913-88,733)
/ 115,305 = 0.25
(117,362 –
90,839) / 114,794
= 0.23
Inventory turnover = COGS/
Inventories
327,895/89,055 =
3.68
367,189/88,733 =
4.14
356,076/90,839 =
3.92
Days in inventory =
365/inventory turnover 365/ 3.68 = 99.13 365/4.14 = 88.2 365/ 3.92 = 93.12
Gross profit percentage =
gross profit/ revenue
463,617/791,512
* 100% = 58.57%
459,051/826,240
* 100% =
55.56%
452,838/ 808,914
* 100% =
55.98%
Account receivable turnover=
sales/ receivables
791,512/8,438 =
93.8
826,240/ 9,469 =
87.26
808,914/ 9,054 =
89.34
Days sales in receivable =
365/receivable turnover
365/ 93.8 = 3.89
days
365/ 87.26 = 4.18
days
365/89.34 = 4.09
days
Debt ratio = liabilities/ assets
150,824/216, 292
= 0.7
165,375 /218,443
= 0.76
158,470 /202,545
= 0.78
Debt to equity = total
liabilities/ equity
150,824/65,468 =
2.3
165,375/53,068 =
3.12
158,470/ 44,075=
3.6
Time interest earned ratio =
EBIT/Interest
(-4,515+3,791)/
3,791 = -0.19
(-1,540 + 3,248) /
3,248 = 0.53
(-6,474+-2,207)/
2,207 = -1.93
Appendices
Appendix 1: Financial Ratio Calculations
2015 2016 2017
Rate of return on net sales =
net income/ sales
-4,462 / 791,512 *
100% = -0.56%
-2,190 / 826,240
* 100% = -0.27%
-8,389 / 808,914
* 100% = -1.04%
Rate of return on total assets =
net income/ total assets
-4,462 / 216,292 *
100% = -2.06%
-2,190 / 218,443
* 100% = -1.00%
-8,389/202,545 *
100% = -4.14%
Asset turnover = sales/ total
assets
791,512/216,292
= 3.66
826,240/218,443
= 3.78
808,914/202,545
= 3.99
Rate of return on ordinary
shareholders’ equity = net
income/ total equity
-4,462/65,468 = -
6.82%
-2,190/53,068 =
-4.13%
-8,389/ 44,075 =
-19.03%
Earnings per share -2.00% -0.01 -0.04
working capital = current
assets – current liabilities
114,645 – 99,647
= 14,988
117,913- 115,305
= 2,608
117,362 –
114,794 = 2,568
current ratio = current assets/
current liabilities
114,645 /99,647 =
1.15
=
117,913/115,305
1.02
117,362 /114,794
= 1.02
acid test ratio = (current
assets- inventories)/ current
liabilities
(114,645 –
89,055 ) / 99,647
0.26
(117,913-88,733)
/ 115,305 = 0.25
(117,362 –
90,839) / 114,794
= 0.23
Inventory turnover = COGS/
Inventories
327,895/89,055 =
3.68
367,189/88,733 =
4.14
356,076/90,839 =
3.92
Days in inventory =
365/inventory turnover 365/ 3.68 = 99.13 365/4.14 = 88.2 365/ 3.92 = 93.12
Gross profit percentage =
gross profit/ revenue
463,617/791,512
* 100% = 58.57%
459,051/826,240
* 100% =
55.56%
452,838/ 808,914
* 100% =
55.98%
Account receivable turnover=
sales/ receivables
791,512/8,438 =
93.8
826,240/ 9,469 =
87.26
808,914/ 9,054 =
89.34
Days sales in receivable =
365/receivable turnover
365/ 93.8 = 3.89
days
365/ 87.26 = 4.18
days
365/89.34 = 4.09
days
Debt ratio = liabilities/ assets
150,824/216, 292
= 0.7
165,375 /218,443
= 0.76
158,470 /202,545
= 0.78
Debt to equity = total
liabilities/ equity
150,824/65,468 =
2.3
165,375/53,068 =
3.12
158,470/ 44,075=
3.6
Time interest earned ratio =
EBIT/Interest
(-4,515+3,791)/
3,791 = -0.19
(-1,540 + 3,248) /
3,248 = 0.53
(-6,474+-2,207)/
2,207 = -1.93
FINANCIAL ANALYSIS OF SPECIALTY FASHION GROUP LTD 12
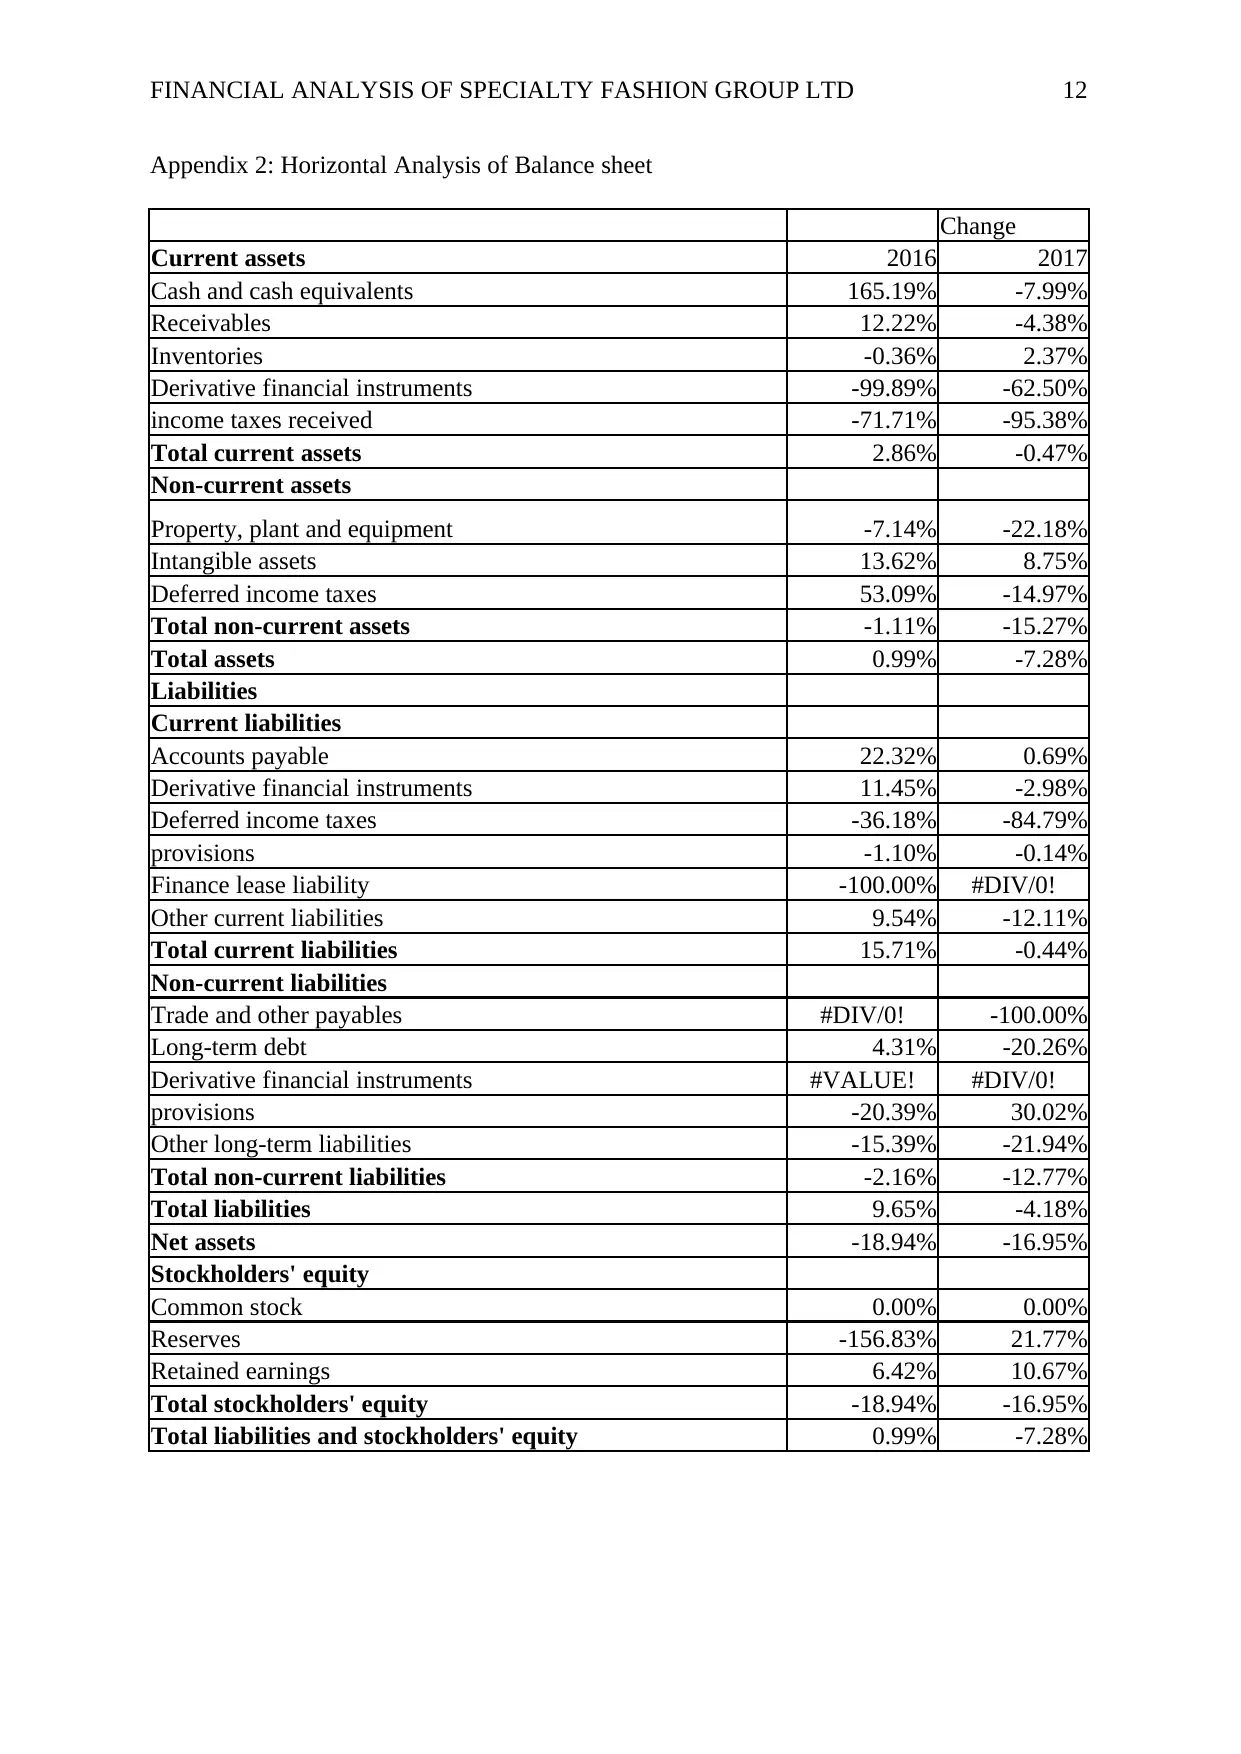
Appendix 2: Horizontal Analysis of Balance sheet
Change
Current assets 2016 2017
Cash and cash equivalents 165.19% -7.99%
Receivables 12.22% -4.38%
Inventories -0.36% 2.37%
Derivative financial instruments -99.89% -62.50%
income taxes received -71.71% -95.38%
Total current assets 2.86% -0.47%
Non-current assets
Property, plant and equipment -7.14% -22.18%
Intangible assets 13.62% 8.75%
Deferred income taxes 53.09% -14.97%
Total non-current assets -1.11% -15.27%
Total assets 0.99% -7.28%
Liabilities
Current liabilities
Accounts payable 22.32% 0.69%
Derivative financial instruments 11.45% -2.98%
Deferred income taxes -36.18% -84.79%
provisions -1.10% -0.14%
Finance lease liability -100.00% #DIV/0!
Other current liabilities 9.54% -12.11%
Total current liabilities 15.71% -0.44%
Non-current liabilities
Trade and other payables #DIV/0! -100.00%
Long-term debt 4.31% -20.26%
Derivative financial instruments #VALUE! #DIV/0!
provisions -20.39% 30.02%
Other long-term liabilities -15.39% -21.94%
Total non-current liabilities -2.16% -12.77%
Total liabilities 9.65% -4.18%
Net assets -18.94% -16.95%
Stockholders' equity
Common stock 0.00% 0.00%
Reserves -156.83% 21.77%
Retained earnings 6.42% 10.67%
Total stockholders' equity -18.94% -16.95%
Total liabilities and stockholders' equity 0.99% -7.28%
⊘ This is a preview!⊘
Do you want full access?
Subscribe today to unlock all pages.
Trusted by 1+ million students worldwide
1 out of 17
Related Documents


Your All-in-One AI-Powered Toolkit for Academic Success.
+13062052269
info@desklib.com
Available 24*7 on WhatsApp / Email
![[object Object]](/_next/static/media/star-bottom.7253800d.svg)
Unlock your academic potential
Copyright © 2020–2026 A2Z Services. All Rights Reserved. Developed and managed by ZUCOL.