Economics 371: Sports League Competitive Balance Analysis Report
VerifiedAdded on 2023/04/12
|11
|2357
|225
Report
AI Summary
This report analyzes the economics of sports, specifically focusing on the Premier League. It examines competitive balance using standard deviation and the Herfindahl-Hischman index, comparing trends to those observed in class. The report delves into the efforts taken by the Premier League to ensure competitiveness, including spatial awareness and tactical knowledge. It presents a detailed analysis of financial data, including revenue, wage expenditure, and debt, using tables and figures to illustrate key points. The study also explores the impact of UEFA's Financial Fair Play (FFP) regulations on the Premier League, examining indicators such as net debt, wage-to-revenue ratios, and the impact on club finances. The analysis includes data from 2003 to 2013, looking at revenue, payments, and fixed versus variable payments. It concludes with a discussion on the relationship between spending on players, debt regulation, and team performance, supported by statistical modeling and references to relevant research.

Running head: SPORTS ECONOMICS 1
Sports Economics
Name
Institution
Sports Economics
Name
Institution
Paraphrase This Document
Need a fresh take? Get an instant paraphrase of this document with our AI Paraphraser

SPORTS ECONOMICS 2
Sports Economics
I). The standard deviation of the six team seems to be decrease and then increase at the
same time compared to the trend in class. The ideal standard deviation trend for the six teams
also decreases and then increases at the same time as compare d to the one in class.
II). The Herfindahl-Hischman index for the six teams during the pro-league increases in
the beginning and then decrease to zero which is the minimum value. Afterwards, the Herfindahl
–Hischman start increasing from 0.04 to 0.09 and 0.26 in the end.
IV). Efforts taken by premier league to ensure competiveness of the teams.
Spatial awareness
This denotes the capacity to visualize space vividly across the whole football ground.
The footballers have been made conscious of the instant space around them. Moreover, the
logical footballers are conscious. There are two major reasons why footballer’s require to
have an understanding where the members of the team are to anticipate the position of the
teammates and tell them where they should be .
Tactical Knowledge
The structure for the team affects the methods how the team will utilize to succeed the
division. Throughout the years soccer formations have adjusted radically
Regulation of debt
Expenses on salaries are believed to hike the quality of the team, and increased
spending, than competitor will rise a team’s probability of winning a game (Allan, 2004). The
football teams are supposed to hike the spending not completely, but in relation to the teams
that are competing (Paul et al, 2010). This scrutiny, integrated with the debates that the
football teams objective role is an impartial function that is linear of winning and profit. This
insinuates that football teams will pursue to maximize spending above their means.
Table 1.0 Revenue, wage expenditure, profit and funds, Premier League (2010 - 2011)
Revenue Wage
Expenditure
Profit before
tax
Net Debt
Arsenal 226,825,000 124,401,000 14,776,000 -97,827,000

SPORTS ECONOMICS 3
Aston Villa 92,028,000 94,795,000 -54,013,000 -
153,169,000
Chelsea 228,574,000 191,214,000 -78,262,000 -
816,038,000
Everton 82,021,000 58,026,000 -5,413,000 -44,914,000
Fulham 77,109,000 57,672,000 4,792,000 -
192,947,000
Liverpool 183,690,000 134,768,000 -49,317,000 -61,274,000
Man City 153,186,000 173,977,000 -197,491,000 -42,900,000
Man Utd 331,441,000 152,915,000 12,004,000 -
308,258,000
Newcastle 88,464,000 53,585,000 32,619,000 -
130,485,000
Norwich 23,391,000 18,445,000 -7,065,000 -16,778,000
QPR 16,229,000 29,739,000 -25,383,000 -53,963,000
Reading 23,138,000 20,511,000 -5,371,000 -34,842,000
Southampton 13,370,000
66,809,000
79,447,000
13,460,000
47,093,000
60,882,000
-11,740,000
-5,558,000
-7,838,000
-26,450,000
-339,000 -
76,841,000
Stoke
Sunderland
Swansea 11,669,000 17,392,000 -11,173,000 -754,000
Tottenham 163,486,000 91,255,000 402,000 -56,080,000
West Brom 65,086,000 43,903,000 18,934,000 -1,948,000
West Ham 80,939,000 55,704,000 -18,565,000 -41,614,000
Wigan 50,507,000 39,948,000 -7,155,000 -72,696,000
Sum 2,057,409,000 1,479,685,000 -400,817,000 -
2,230,117,000
Average 102,870,450 73,984,250 -20,040,850 -
111,505,850
The division is selected for evaluation as UEFA declared tactics to control spending in
the course of this period. Nearly one and a half billion bounds were utilized on paying the
workers of the division in the course of this period (Barnett & Hilditch, 2013). A mean of 79.9
million euros per football team was spent in each year (Rascher, 2019. The division accumulated
revenue, which is two billion euros offsets the division accumulate amount utilized on salaries
(Pawlowski et al, 2010). Nevertheless, the Premier League salary spending went up at a high rate
than proceeds, therefore causing a rise in the accumulated loss of pre-tax (Peel & Thomas, 2015).
⊘ This is a preview!⊘
Do you want full access?
Subscribe today to unlock all pages.
Trusted by 1+ million students worldwide

SPORTS ECONOMICS 4
Within this time, premier league teams have minimized the gross debt. This is greatly witnessed
in richer football teams such as Manchester United who reimburse an income in every division
(Peel & Thomas, 2012).
As definite spending has a minimum effect on the positions of the league, guidelines
embraced to counter spending are observed regularly. These tactics mostly take the structure
of an increased salary spending allowed. There were no such tactics in the division of Premier
League that were intended to supervise salary spending until the opening of the UEFA
Regulations on Fair Play (Reep & Benjamin, B. 2018).
UEFA FFP indicators for Premier League teams (2010 - 2011)
Table 1.1 UEFA FFP indicators for Premier League clubs (2010 - 2011)
NED CBE <-£4m CBE <-
£36m
Debt/rev Wage/rev Red
Flags
Arsenal 70,744,000 70,744,000 -0.43 55% 0
Aston Villa Yes -91,584,000 * -91,584,000 * -1.66 * 103% * 5
Chelsea Yes -
138,258,000
* -
138,258,000
* -3.57 * 84% * 5
Everton Yes -6,016,000 * -6,016,000 -0.55 71% * 3
Fulham -8,886,000 * -8,886,000 -2.50 * 75% * 3
Liverpool -13,477,000 * -13,477,000 -0.33 73% * 2
Man City -
308,471,000
* -
308,471,000
* -0.28 114% * 3
Man Utd -16,819,000 * -16,819,000 -0.93 46% 1
Newcastle 102,828,000 102,828,000 -1.48 * 61% 2
Norwich -9,602,000 * -9,602,000 -0.72 79% * 2
QPR Yes -37,671,000 * -37,671,000 * -3.33 * 183% * 5
Reading 1,123,000 1,123,000 -1.51 * 89% * 2
Southampton Yes -19,050,000
-9,355,000
-33,407,000
*
*
*
-19,050,000
-9,355,000
-33,407,000
-1.98
-0.01
-0.97
* 101%
70%
77%
*
*
*
4
2
2
Stoke
Sunderland
Swansea Yes -9,835,000 * -9,835,000 -0.06 149% * 3
Tottenham 1,913,000 1,913,000 -0.34 56% 0
West
Bromwich 13,674,000 13,674,000 -0.03 67% 1
Paraphrase This Document
Need a fresh take? Get an instant paraphrase of this document with our AI Paraphraser

SPORTS ECONOMICS 5
West Ham Yes -32,832,000 * -32,832,000 -0.51 69% 3
Wigan Yes -10,810,000 * -10,810,000 -1.44 * 79% * 4
Sum -
555,791,000
-
555,791,000
Average -27,789,550 -27,789,550 -1.13 85% 3
In the year 2010, the organization commended a number of regulations on Financial Fai Play
with the aim of initiating more specialty within the team’s resources and advocating for more
investment, which is responsible (Welki, & Zlatoper, 2014). Notwithstanding a reduction of rising
commercial and public interest in the football cub of European at this period, many teams all though
Europe are experiencing a financial health that is poor. Equivalent to several the division of Premier
League teams, other teams are observed to be wriggling to cope with obligations on finances and have
recorded constant losses on finances. Table 3.5 Premier League revenue and payments (2003 - 2013)
Total
Revenue
(TR)
Premier
League
Payment
(LP)
% of
TR
Fixed
Payments
% of
LP
%of
TR
Variable
Payments
% of
LP
%
of
TR
2003
2004 1,327,770,000 436,995,370 33% 205,644,980 47% 15% 231,350,390 53% 17%
2004
2005 1,333,575,000 467,682,048 35% 262,953,160 56% 20% 204,728,888 44% 15%
2006
2007 1,530,430,000 463,640,898 30% 259,284,480 56% 17% 204,356,418 44% 13%
2007
2008 1,927,358,000 766,793,964 40% 462,268,340 60% 24% 304,525,624 40% 16%
2009
2010 2,030,000,000 830,958,732 41% 494,780,860 60% 24% 336,177,872 40% 17%
2010
2011 2,271,000,000 952,749,977 42% 634,912,513 67% 28% 317,837,464 33% 14%
2011
2012 2,360,000,000 968,180,900 41% 651,054,740 67% 28% 317,126,160 33% 13%
2012 39% 67% 26% 33% 13%
SPORTS ECONOMICS 6
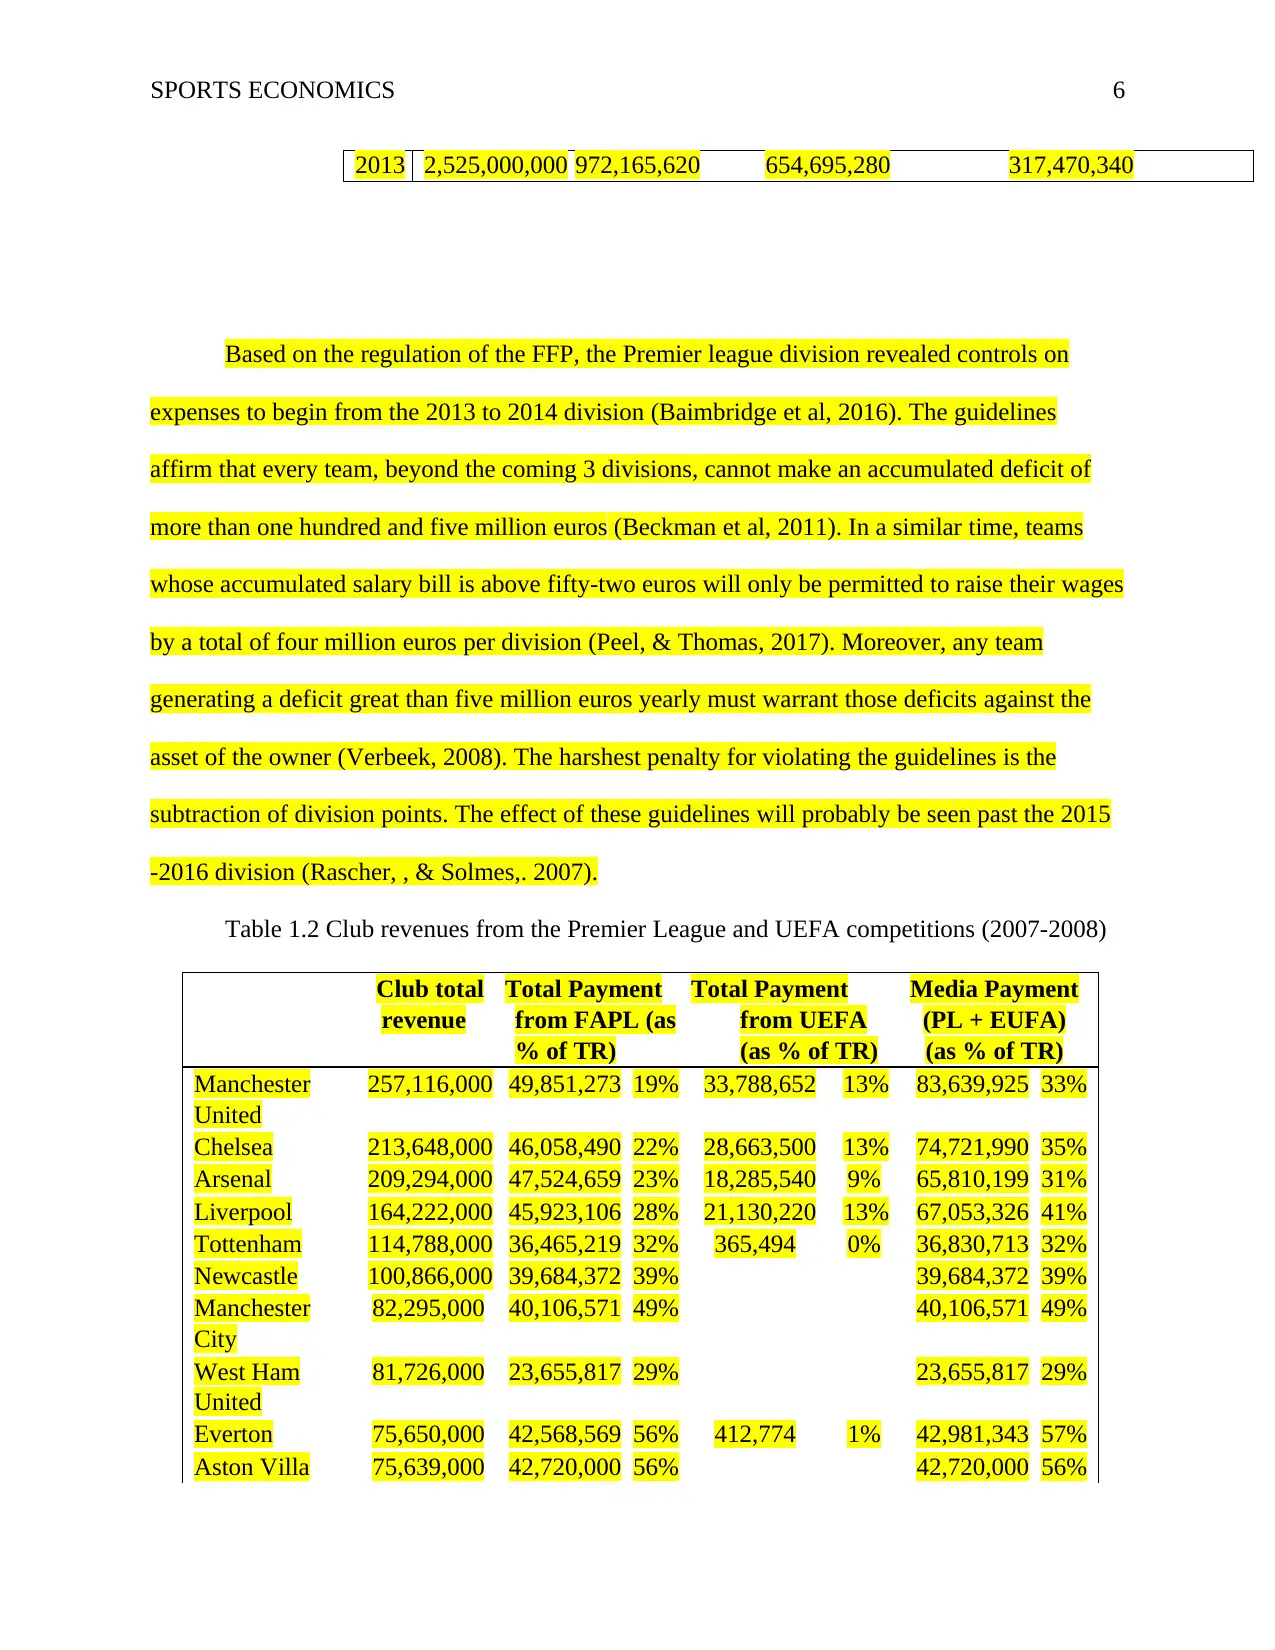
2013 2,525,000,000 972,165,620 654,695,280 317,470,340
Based on the regulation of the FFP, the Premier league division revealed controls on
expenses to begin from the 2013 to 2014 division (Baimbridge et al, 2016). The guidelines
affirm that every team, beyond the coming 3 divisions, cannot make an accumulated deficit of
more than one hundred and five million euros (Beckman et al, 2011). In a similar time, teams
whose accumulated salary bill is above fifty-two euros will only be permitted to raise their wages
by a total of four million euros per division (Peel, & Thomas, 2017). Moreover, any team
generating a deficit great than five million euros yearly must warrant those deficits against the
asset of the owner (Verbeek, 2008). The harshest penalty for violating the guidelines is the
subtraction of division points. The effect of these guidelines will probably be seen past the 2015
-2016 division (Rascher, , & Solmes,. 2007).
Table 1.2 Club revenues from the Premier League and UEFA competitions (2007-2008)
Club total
revenue
Total Payment
from FAPL (as
% of TR)
Total Payment
from UEFA
(as % of TR)
Media Payment
(PL + EUFA)
(as % of TR)
Manchester
United
257,116,000 49,851,273 19% 33,788,652 13% 83,639,925 33%
Chelsea 213,648,000 46,058,490 22% 28,663,500 13% 74,721,990 35%
Arsenal 209,294,000 47,524,659 23% 18,285,540 9% 65,810,199 31%
Liverpool 164,222,000 45,923,106 28% 21,130,220 13% 67,053,326 41%
Tottenham 114,788,000 36,465,219 32% 365,494 0% 36,830,713 32%
Newcastle 100,866,000 39,684,372 39% 39,684,372 39%
Manchester
City
82,295,000 40,106,571 49% 40,106,571 49%
West Ham
United
81,726,000 23,655,817 29% 23,655,817 29%
Everton 75,650,000 42,568,569 56% 412,774 1% 42,981,343 57%
Aston Villa 75,639,000 42,720,000 56% 42,720,000 56%
⊘ This is a preview!⊘
Do you want full access?
Subscribe today to unlock all pages.
Trusted by 1+ million students worldwide

SPORTS ECONOMICS 7
Portsmouth 71,556,000 40,831,632 57% 40,831,632 57%
Sunderland 63,597,000 34,003,221 53% 34,003,221 53%
Bolton 59,072,000 32,401,668 55% 365,494 1% 32,767,162 55%
Reading 58,023,000 30,951,546 53% 30,951,546 53%
Blackburn 56,395,000 40,680,201 72% 78,800 0% 40,759,001 72%
Fulham 53,670,000 31,676,607 59% 31,676,607 59%
Birmingham 49,836,000 30,226,485 61% 30,226,485 61%
Derby 48,558,000 29,501,424 61% 29,501,424 61%
Middlesbrough 47,952,000 34,576,851 72% 34,576,851 72%
Wigan 43,455,000 33,851,790 78% 33,851,790 78%
Spending on Players
The team’s quality is affected by the price of the specific players. The wage expenditure
is likely to be a strong predictor of the strength of the team, given a competitive market for
players. Chelsea sent the largest amount on salaries, which is one hundred and fifty four million
euros every year, on average over the data period, while Manchester United have the finest
results of match win with a salary bill of one hundred and eighteen million per year
Wooldridge, . 2010). There is a great association between the number of matches won
(correlation index 0.77) and the spending on wages, indicating that a rise in expenditure on
salaries hikes the quality of results for the team (Vrooman, 2011). This great association is
significant indication backing up the allegation that the market of labor for players of soccer is
competitive. Figure 1.1 depicts the association for the year 2011 to 2012 division (Vrooman,
2015). The football teams that sit north have more expenditure on salaries to obtain similar
points such as those ones below the line. For instance, NewCastle and Chelsea managed to reach
65 and 64 points progressively but the salary bill was 64 and 174 million, progressively
Conclusion
Paraphrase This Document
Need a fresh take? Get an instant paraphrase of this document with our AI Paraphraser

SPORTS ECONOMICS 8
There is sense that regulation of debt and spending on players have a an effect on the
results released by the team.
Table 1.3 Results from modelling match results by ordered Probit
All Clubs Top 5 Bottom 5 All Clubs with
fixed effects
Coeff. SE Coeff. SE Coeff. SE Coeff. SE
Spending on
wages
Home Wages
0.47 0.08 ** 0.43 0.12 ** 0.70 0.26 ** 0.58 0.18 **
Away Wages -0.48 0.06 ** -0.64 0.14 ** -0.46 0.11 ** -0.45 0.06 **
Additional
Competitions
Home FA Cup
0.01 0.08 -0.24 0.18 0.29 0.16 * -0.03 0.11
Away FA Cup -0.09 0.08 0.06 0.17 -0.28 0.16 * -0.08 0.10
Home
Champions
League
0.12 0.15 -0.02 0.19 6.39 6.22 0.10 0.15
Away Champions
League
-0.26 0.15 * -0.14 0.31 -0.25 0.26 -0.25 0.15 *
Home Europa
League
0.02 0.15 -0.51 0.36 0.03 0.24 -0.18 0.16
Away Europa
League
-0.02 0.14 0.14 0.35 0.01 0.23 -0.06 0.15
Legacy
performance
Home Form
0.03 0.03 0.05 0.08 -0.01 0.05 -0.06 0.03 *
Away Form -0.05 0.03 * 0.04 0.06 -0.05 0.05 -0.07 0.03 **
Attendance 6.7E-
06
3.1E-
06
** 1.5E-
05
4.8E-
06
** -8.8E-
06
7.3E-
06
-1.6E-
05
1.3E-
05
Distance 3.1E-
04
3.4E-
04
-
1.8E-
04
7.1E-
04
1.2E-
03
6.1E-
04
* 4.3E-
04
3.7E-
04

SPORTS ECONOMICS 9
Fixed effects
significance:
Team
- - - Yes
Day - - - No
Month - - - No
Season Yes No Yes Yes
Cut 1 -0.43 ** -0.26 -0.41 -1.87
Cut 2 0.36 ** 0.62 0.33 -1.06
Log likelihood -1766 -344 -612 -1726
Observations 1824 434 598 1824
Table 1.4 Premier League Competitive Balance between(2003 - 2013)
(1) HHI (2) Champions (3) SD
2003 2004 0.054 Manchester Unitedd 0.197
2004 2005 0.055 Manchester United 0.215
2005 2006 0.055 Manchester City 0.192
2006 2007 0.054 Manchester City0.193 0.285
2007 2008 0.056 0.213 0.265
2008 2009 0.055 0.204 0.260
2009 2010 0.055 Manchester United 0.207
2010 2011 0.052 Manchester City 0.186
2011 2012 0.055 Chelsea 0.202
2012 2013 0.055 Chelsea 0.216
Average 0.055 0.203
(2) HHIC 0.360
(4) CBR 0.262
⊘ This is a preview!⊘
Do you want full access?
Subscribe today to unlock all pages.
Trusted by 1+ million students worldwide

SPORTS ECONOMICS 10
References
Allan, S. (2018). Satellite television and football attendance: the not so super effect. Applied
Economics Letters, 11(2), 123-125. doi: 10.1080/1350485042000200231
Baimbridge, M., Cameron, S., & Dawson, P. (2016). Satellite television and the demand for
football: a whole new ball game? Scottish Journal of Political Economy, 43(3), 317.
Barnett, V., & Hilditch, S. (2013). The effect of an artificial pitch surface on home team
performance in football (soccer). Journal of the Royal Statistical Society.
Beckman, E. M., Cai, W., Esrock, R. M., & Lemke, R. J. (2011). Explaining Game-to-Game
Ticket Sales for Major League Baseball Games Over Time. Journal of Sports
Economics, 13(5), 536-553. doi: 10.1177/1527002511410980
Paul, R. J., Wachsman, Y., & Weinbach, A. P. (2010). The Role of Uncertainty of Outcome
and Scoring in the Determination of Fan Satisfaction in the NFL. Journal of Sports
Economics, 12(2), 213-221. doi: 10.1177/1527002510376789
Pawlowski, T., Breuer, C., & Hovemann, A. (2010). Top clubs’ performance and the
competitive situation in European domestic football competitions. Journal of Sports
Economics, 11(2), 186-202.
Peel, D., & Thomas, D. (2012). The demand for football: some evidence on outcome
uncertainty. Empirical Economics, 17(2), 323-331.
Peel, D., & Thomas, D. (2015). Outcome uncertainty and the demand for football: an
analysis of match attendances in the English football league. Scottish Journal of
Political Economy, 35(3), 242-249.
Peel, D., & Thomas, D. (2017). Handicaps, outcome uncertainty and attendance demand.
Applied Economics Letters, 4(9), 567-570. doi: 10.1080/135048597355041
Paraphrase This Document
Need a fresh take? Get an instant paraphrase of this document with our AI Paraphraser

SPORTS ECONOMICS 11
Premier League Judgement
Rascher, D. A., & Solmes, J. (2007). Do fans want close contests? A test of the uncertainty of
outcome hypothesis in the National Basketball Association. A Test of the
Uncertainty of Outcome Hypothesis in the National Basketball Association (June 15,
2007).
Rascher, D. A. (2019). A test of the optimal positive production network externality in
Major League Football. Sports, Economics: Current Research.
Reep, C., & Benjamin, B. (2018). Skill and chance in association football. Journal of the Royal
Statistical Society. Series A (General), 581-585.
Vrooman, J. (2011). Two to Tango: Optimum Competitive Balance in Professional Sports
Leagues.
.Vrooman, J. (2015). A general theory of professional sports leagues. Southern Economic
Journal, 971-990.
Welki, A. M., & Zlatoper, T. J. (2014). US professional football: The demand for game-day
attendance in 1991. Managerial and Decision Economics, 15(5), 489-495.
Wooldridge, J. M. (2010). Econometric analysis of cross section and panel data: MIT press.
1 out of 11
Your All-in-One AI-Powered Toolkit for Academic Success.
+13062052269
info@desklib.com
Available 24*7 on WhatsApp / Email
![[object Object]](/_next/static/media/star-bottom.7253800d.svg)
Unlock your academic potential
Copyright © 2020–2026 A2Z Services. All Rights Reserved. Developed and managed by ZUCOL.