Cognitive Inhibition and Anxiety: A Comparative SPSS Analysis
VerifiedAdded on 2020/07/22
|35
|5829
|59
Report
AI Summary
This report presents a comprehensive SPSS analysis investigating the relationship between anxiety and cognitive inhibition control in young and elderly adults. The study employs Simon, Go/NoGo, and Stroop tasks to assess cognitive performance under varying anxiety levels. Descriptive statistics, ANOVA, and correlation analyses are used to compare the performance of different age and gender groups. The findings indicate significant differences in cognitive inhibition between young and old adults across several tasks, with older adults showing slower cognitive inhibition rates. The analysis explores the impact of anxiety on cognitive function, revealing correlations between anxiety levels and performance on cognitive tasks. The report includes detailed statistical interpretations, including mean values, standard deviations, and significance levels, providing valuable insights into the cognitive effects of anxiety and aging. Results suggest anxiety and depression are strongly related, and state and trait anxiety are also related to each other. The study concludes with a discussion of the implications of these findings and areas for further research.
SPSS ANALYSIS
Paraphrase This Document
Need a fresh take? Get an instant paraphrase of this document with our AI Paraphraser
TABLE OF CONTENTS
Relationship between anxiety and cognitive inhibition control in case of yound and elderly
adults1
Anxiety level and Simon task......................................................................................................1
Anxiety level and Go, no go........................................................................................................2
Anxiety level and Stroop.............................................................................................................3
High anxiety will cause poorer cognitive inhibition........................................................................5
Coorelation interpretation................................................................................................................5
APPENDIX......................................................................................................................................7
...................................................................................................................................................10
Relationship between anxiety and cognitive inhibition control in case of yound
and elderly adults
Simon task
Anxiety level and Simon task
Simon task is the test that is conducted to identify rate at which response given by an
individual in respect to stimulus factors in accurate manner. By considering anxiety factor rate of
response is measured in respect to stimulus in terms of accuracy. Means that impact on anxiety
on response time and accuracy level is measured by using this test.
Descriptive statistics
Mean value in case of Simon group is (M=35.22) and standard devation is followed by
compatible and incompatible category where mean and standard deviation is (M=552.19,
SD=113.710) and (M=587.19, SD=113.710). Values deviate at same rate across compatible and
incompatible category.
ANNOVA
Difference among old and young people in respect to go test
Compatible group
H0: There is no significent mean difference between old and young age group in terms of
compatible category.
H1: There is significent mean difference between old and young age group in terms of
compatible category.
1 | P a g e
⊘ This is a preview!⊘
Do you want full access?
Subscribe today to unlock all pages.
Trusted by 1+ million students worldwide
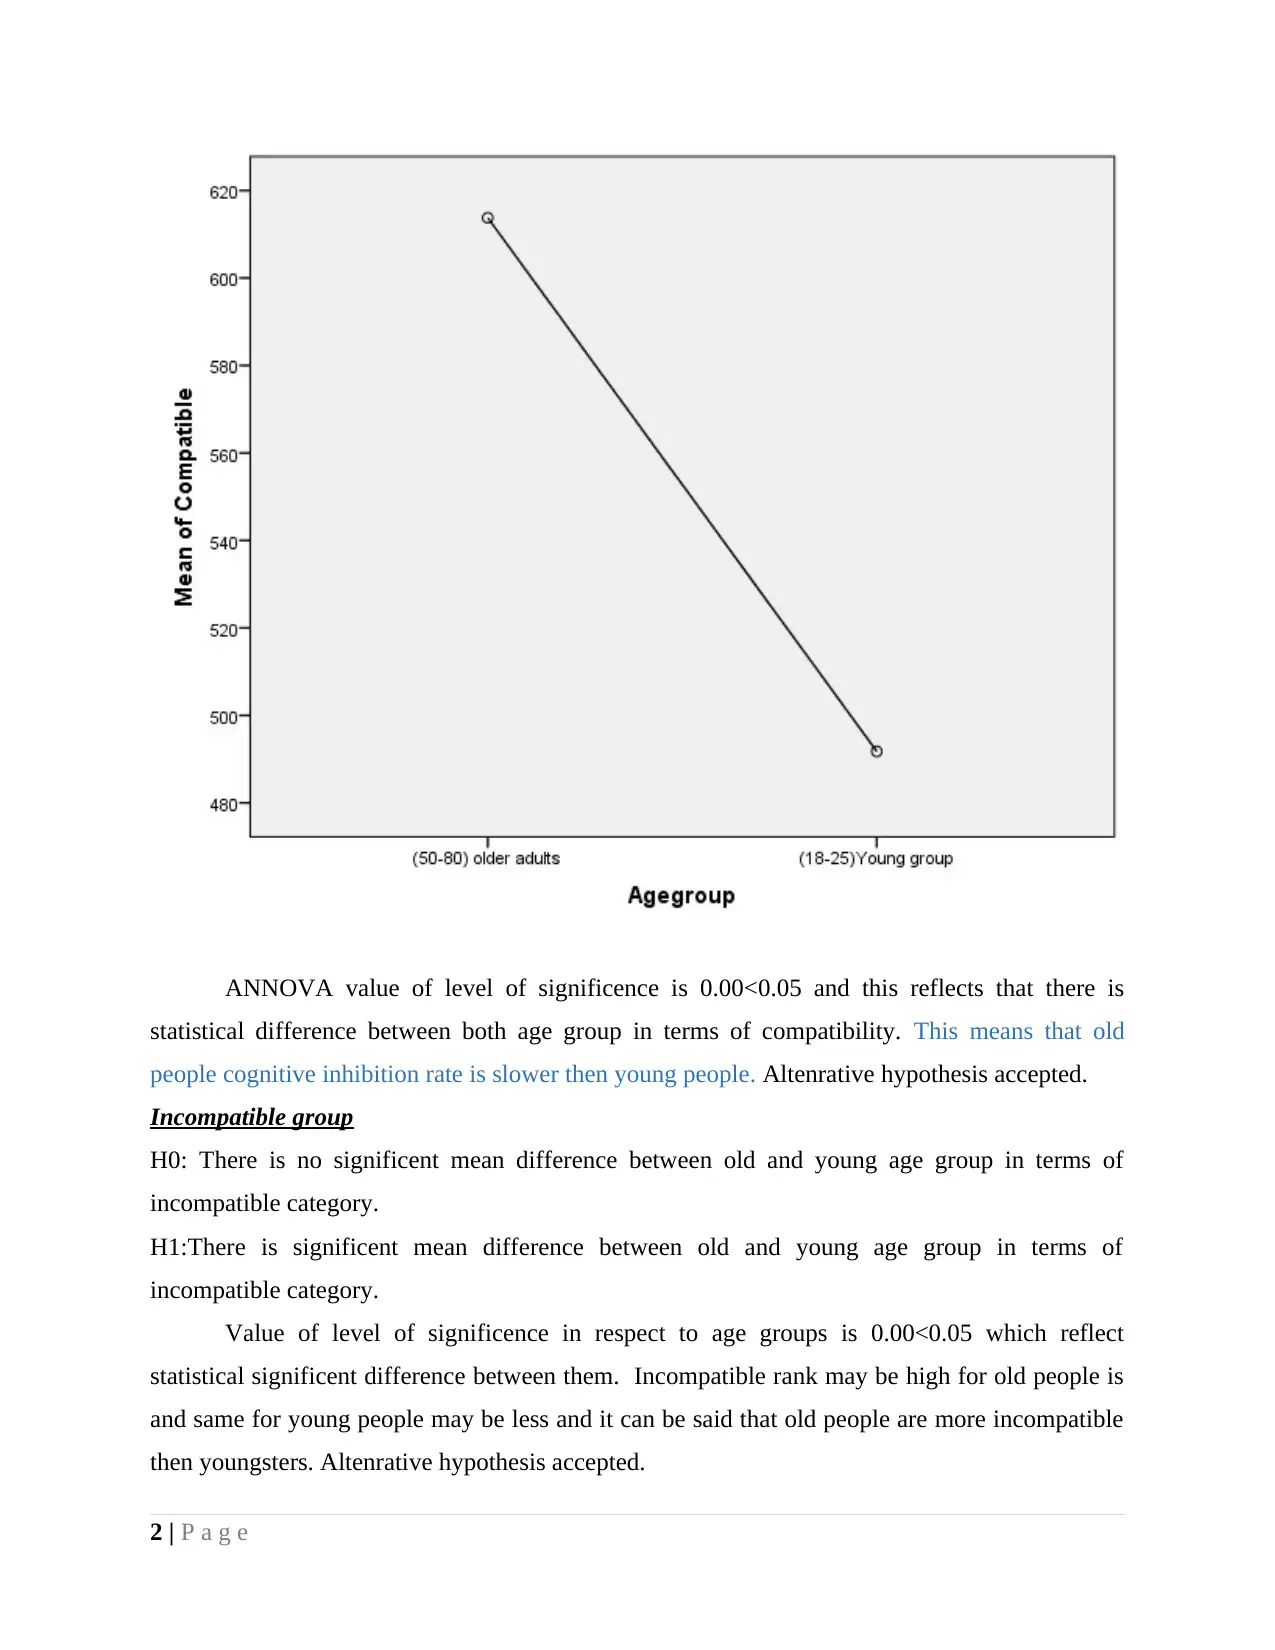
ANNOVA value of level of significence is 0.00<0.05 and this reflects that there is
statistical difference between both age group in terms of compatibility. This means that old
people cognitive inhibition rate is slower then young people. Altenrative hypothesis accepted.
Incompatible group
H0: There is no significent mean difference between old and young age group in terms of
incompatible category.
H1:There is significent mean difference between old and young age group in terms of
incompatible category.
Value of level of significence in respect to age groups is 0.00<0.05 which reflect
statistical significent difference between them. Incompatible rank may be high for old people is
and same for young people may be less and it can be said that old people are more incompatible
then youngsters. Altenrative hypothesis accepted.
2 | P a g e
Paraphrase This Document
Need a fresh take? Get an instant paraphrase of this document with our AI Paraphraser
Simon column is considered for performing calcualtion and it is reflecting accuracy level
of individuals when they respond to stimulus factor. Data points that are in column of Simon are
reflecting how accurately respondents respond to stimuli.
Komogorov Smirnov test
Value of test is greater then 0.05 which indicate that variables are normally distributed
and justified application of parametric test.
Old male, female comparison in terms of compatible, incompatible and simon
H0: Old male and females are not significently different in terms of factors compatible,
incompatible and simon.
H1: Old male and females are significently different in terms of factors compatible, incompatible
and simon.
Value of level of significence is 0.560>0.05 for compatible, 0.475>0.05 for incompatible
and 0.933>0.05 for simon. All these facts reflects that there is no significent mean difference
between old male and female in terms of these factors.
Kolmogorov test is reflecting that data is normally distributed as its value is more then
0.05 across all categories.
Young male and female comparison in terms of compatible, incompatible and simon
H0: Young male and females are not significently different in terms of factors compatible,
incompatible and simon.
H1: Young male and females are significently different in terms of factors compatible,
incompatible and simon.
Value of level of significence is greater then 0.05 in case of simon tast and same is less
then 0.05 in case of compatible and incompatible category. It can be said that there is no
significent mean difference between young male and female in case of simon tast but difference
terms of compatible, incompatible. Means that in respect to simon test any big difference is not
observed in accuracy level of young male and female. But in case of compatible and
incompatible category it is identified that accuracy level of both groups was different.
Go/NoGo task
3 | P a g e
Anxiety level and Go, no go
Go and no go task is the test under which stimuli is presented before respondent and it
have to binary decision on each stimulus. In experiment partcipant make motor response (go)
and withhold a response (no go). Rate at which individual respond to stimuli is measured in this
task and same is analyzed by considering anxiety factor across different groups.
Descriptive statistics
Mean and standard deviation is (M=455.07,SD=73.74) in case of go test and same is
2000 and 0.00 in case of no go category. It can be said that value of go test is less but deviate
more in comparison to no go.
Kolmorov test
Value of level of significence is 0.200>0.05 which means data is normally distributed for
gender and agr groups. Parametric test will be applied on dataset.
Difference among old and young people in respect to go test
H0: There is no significent mean difference between old and youngsters in respect to go test
values.
H1: There is significent mean difference between old and youngsters in respect to go test values.
Value of level of significence is 0.00<0.05 and mean standard deviation in case of
youngsters is (M=419,SD=51) and same for old adults is (M=491,SD=75). Hence, alternative
hypothesis accepted.
Difference among young male and female in respect to go test
H0: There is no significent mean difference between young male and female in respect to go test
values.
H1: There is significent mean difference between young male and female in respect to go test
values.
Value of level of significence is 0.644 which reflect that there is no significent mean
difference between both groups in terms of go test values. Thus, null hypothesis accepted.
Difference among old male and old female in respect to go test
4 | P a g e
⊘ This is a preview!⊘
Do you want full access?
Subscribe today to unlock all pages.
Trusted by 1+ million students worldwide
H0: There is no significent mean difference between old male and old female in respect to go test
values.
H1: There is significent mean difference between old male and old in respect to go test values.
Value of level of significence is 963>0.05 and this reflect that there is no mean difference
between both groups in respect to go test. Hence, null hypothesis accepted.
Stroop Task
Anxiety level and Stroop
Under stroop test reaction time is measured like other tests. In this test different colour
are given and same are labelled by varied colour. By doing so accuracy level and reaction time is
meausred. In present research anxiety factor and stroop results are considered for analysis
purpose.
Descriptive statistics
Mean and standard deviation for stroop w is (M=566,SD=111) and same for stroop c is
(M=780,SD127). It can be said that score in case of latter one is higher and deviate more then
former one.
Kolmorov test
Value of level of significence is greater then 0.05 and data is normally distributed.
Difference among old and young people in respect to stroop test
H0: There is no significent mean difference between old and youngsters in respect to stroop w
and c test values.
H1: There is significent mean difference between old and youngsters in respect to stroop w and c
test values.
Value of level of significence is 0.04<0.05 in case of stroop w and 0.00<0.05 in case of
stroop c which means that stroop w and c results are different in case of both groups. Hence, null
hypothesis is accepted. It can be said that cognitive inhibitory control is older adult group is
slower then young group.
Difference among young male and female in respect to stroop w and c test
H0: There is no significent mean difference between young male and female in respect to stroop
w and c test values.
5 | P a g e
Paraphrase This Document
Need a fresh take? Get an instant paraphrase of this document with our AI Paraphraser
H1: There is significent mean difference between young male and female in respect to stroop w
and c test values.
Value of level of significence is 0.164>0.05 for stroop w and 0.34>0.05 for stroop c this
again reflect that young make and female does not have different score in stoop w test. Null
hypothesis accepted.
Difference among old male and old female in respect to stroop w and c test
H0: There is no significent mean difference between old male and old female in respect to stoop
w and c test values.
H1: There is significent mean difference between old male and old in respect to stroop w and c
test values.
Value of level of significence is more then 0.05 in case of stroop w and c which means
there is no significent difference between old male and female. Thus, null hypothesis is accepted.
6 | P a g e
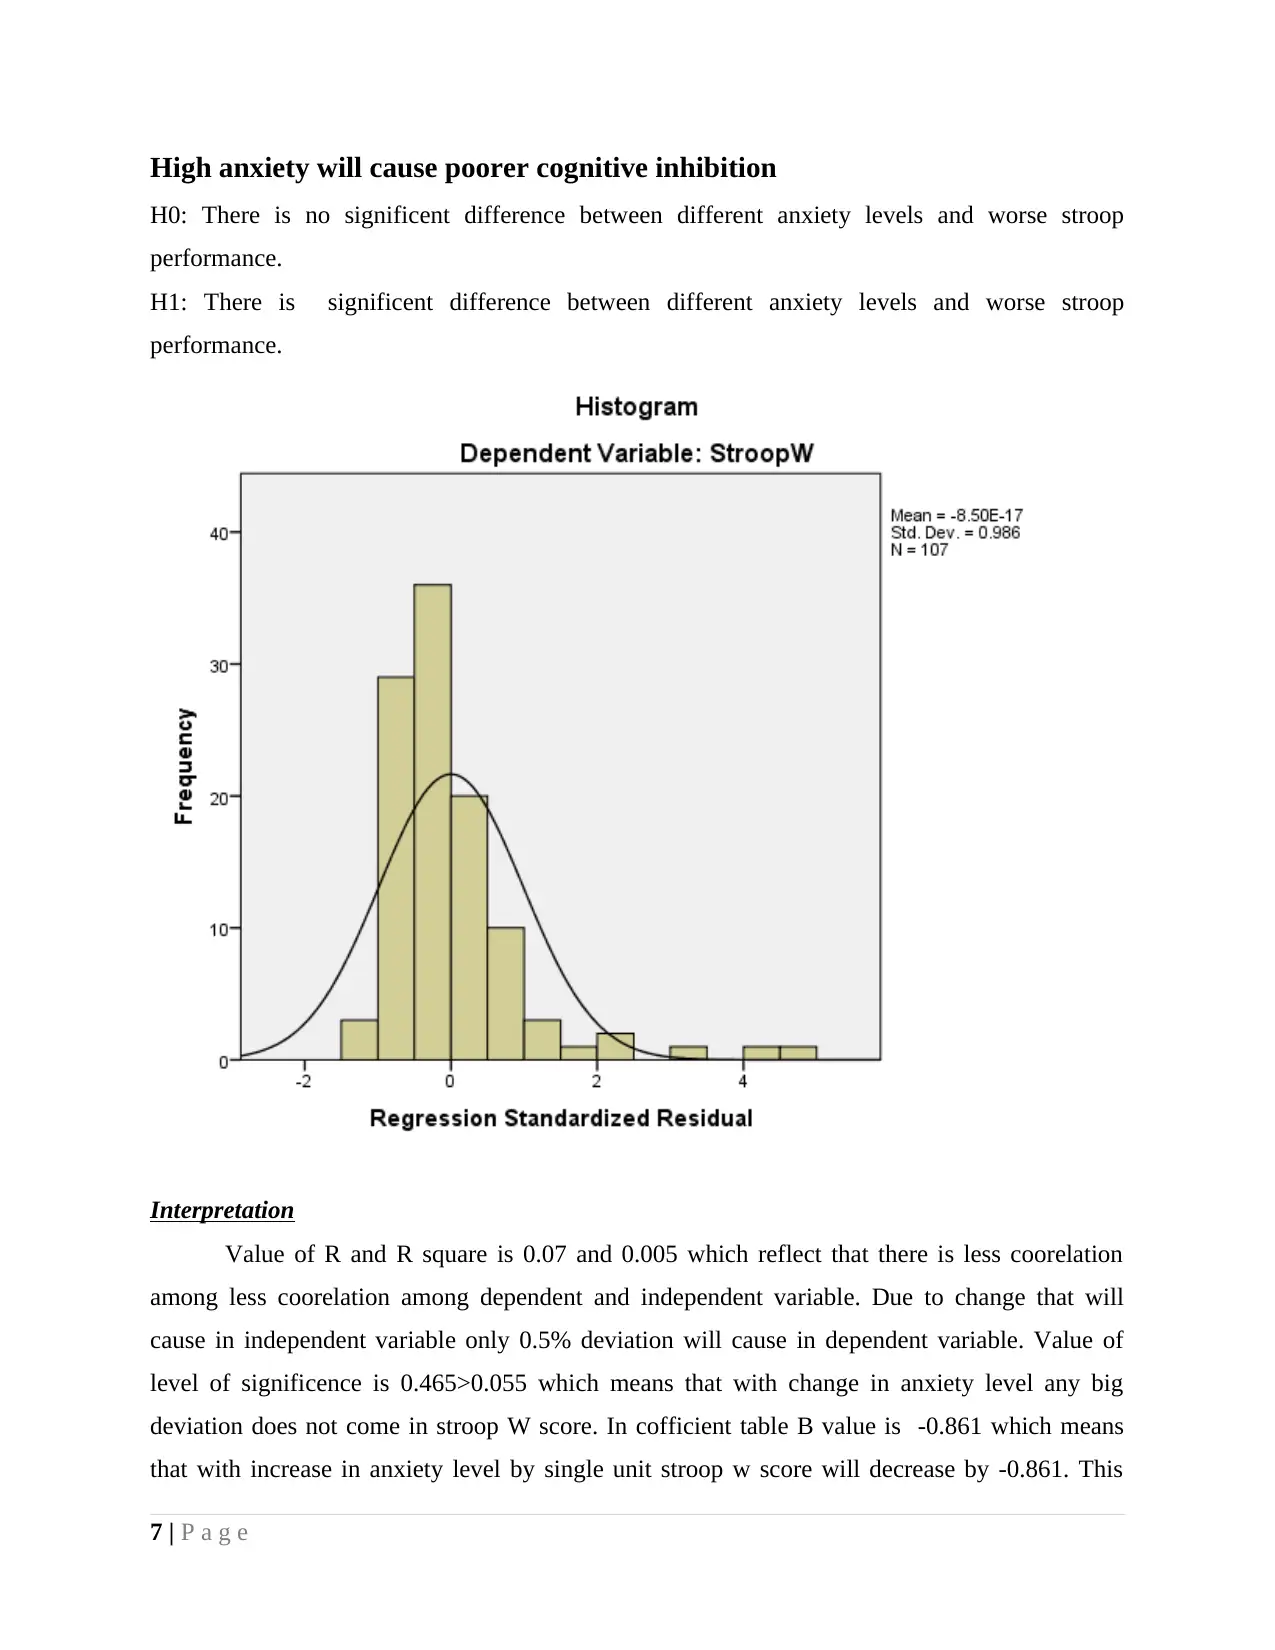
High anxiety will cause poorer cognitive inhibition
H0: There is no significent difference between different anxiety levels and worse stroop
performance.
H1: There is significent difference between different anxiety levels and worse stroop
performance.
Interpretation
Value of R and R square is 0.07 and 0.005 which reflect that there is less coorelation
among less coorelation among dependent and independent variable. Due to change that will
cause in independent variable only 0.5% deviation will cause in dependent variable. Value of
level of significence is 0.465>0.055 which means that with change in anxiety level any big
deviation does not come in stroop W score. In cofficient table B value is -0.861 which means
that with increase in anxiety level by single unit stroop w score will decrease by -0.861. This
7 | P a g e
⊘ This is a preview!⊘
Do you want full access?
Subscribe today to unlock all pages.
Trusted by 1+ million students worldwide
reflects that anxiety score does not have big impact on cognitive inhibition but latter one reduce
with increase in former value.
Worse stroop performance across young and older adults
H0: Worse stroop performance is different across young and old age people.
H1: There is no significent difference between young and old age people in terms of worse
stroop performance.
Interpretation
It can be seen from the table that is in appendix (Anxity level and stroop category) that
mean and standard deviation is 577.98(141.55) and same for young age group people is
534.66(65.74). Facts are clearly reflecting that there is difference in stroop w score and rate of
failure is low in case of youngsters then old people. Moreover, standard deviation is higher in
case of old people then youngsters. Hence, it can be said that stroop performance is poor in case
of old then young people. Value of level of significence is 0.04<0.05 and this reflect that there is
significent mean difference between both age group people in terms of stroop performance.
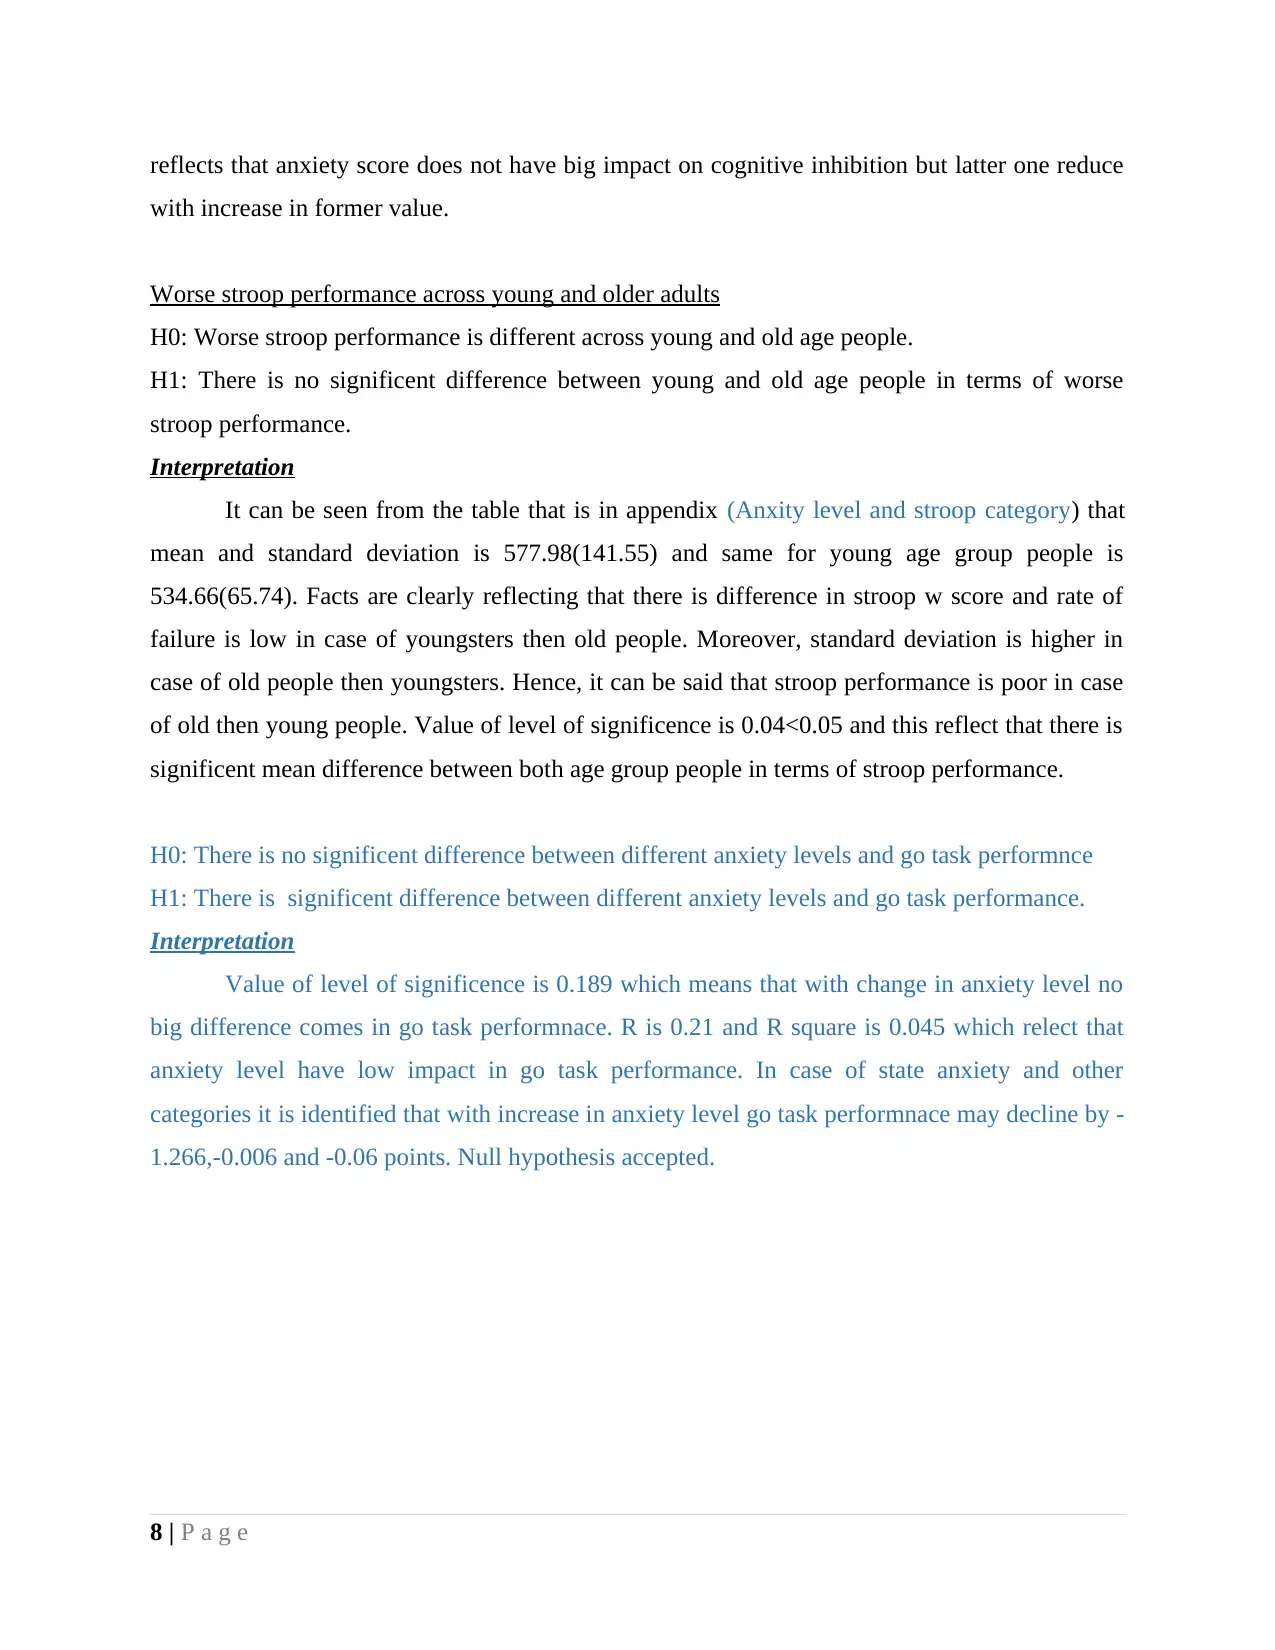
H0: There is no significent difference between different anxiety levels and go task performnce
H1: There is significent difference between different anxiety levels and go task performance.
Interpretation
Value of level of significence is 0.189 which means that with change in anxiety level no
big difference comes in go task performnace. R is 0.21 and R square is 0.045 which relect that
anxiety level have low impact in go task performance. In case of state anxiety and other
categories it is identified that with increase in anxiety level go task performnace may decline by -
1.266,-0.006 and -0.06 points. Null hypothesis accepted.
8 | P a g e
with increase in former value.
Worse stroop performance across young and older adults
H0: Worse stroop performance is different across young and old age people.
H1: There is no significent difference between young and old age people in terms of worse
stroop performance.
Interpretation
It can be seen from the table that is in appendix (Anxity level and stroop category) that
mean and standard deviation is 577.98(141.55) and same for young age group people is
534.66(65.74). Facts are clearly reflecting that there is difference in stroop w score and rate of
failure is low in case of youngsters then old people. Moreover, standard deviation is higher in
case of old people then youngsters. Hence, it can be said that stroop performance is poor in case
of old then young people. Value of level of significence is 0.04<0.05 and this reflect that there is
significent mean difference between both age group people in terms of stroop performance.
H0: There is no significent difference between different anxiety levels and go task performnce
H1: There is significent difference between different anxiety levels and go task performance.
Interpretation
Value of level of significence is 0.189 which means that with change in anxiety level no
big difference comes in go task performnace. R is 0.21 and R square is 0.045 which relect that
anxiety level have low impact in go task performance. In case of state anxiety and other
categories it is identified that with increase in anxiety level go task performnace may decline by -
1.266,-0.006 and -0.06 points. Null hypothesis accepted.
8 | P a g e
Paraphrase This Document
Need a fresh take? Get an instant paraphrase of this document with our AI Paraphraser
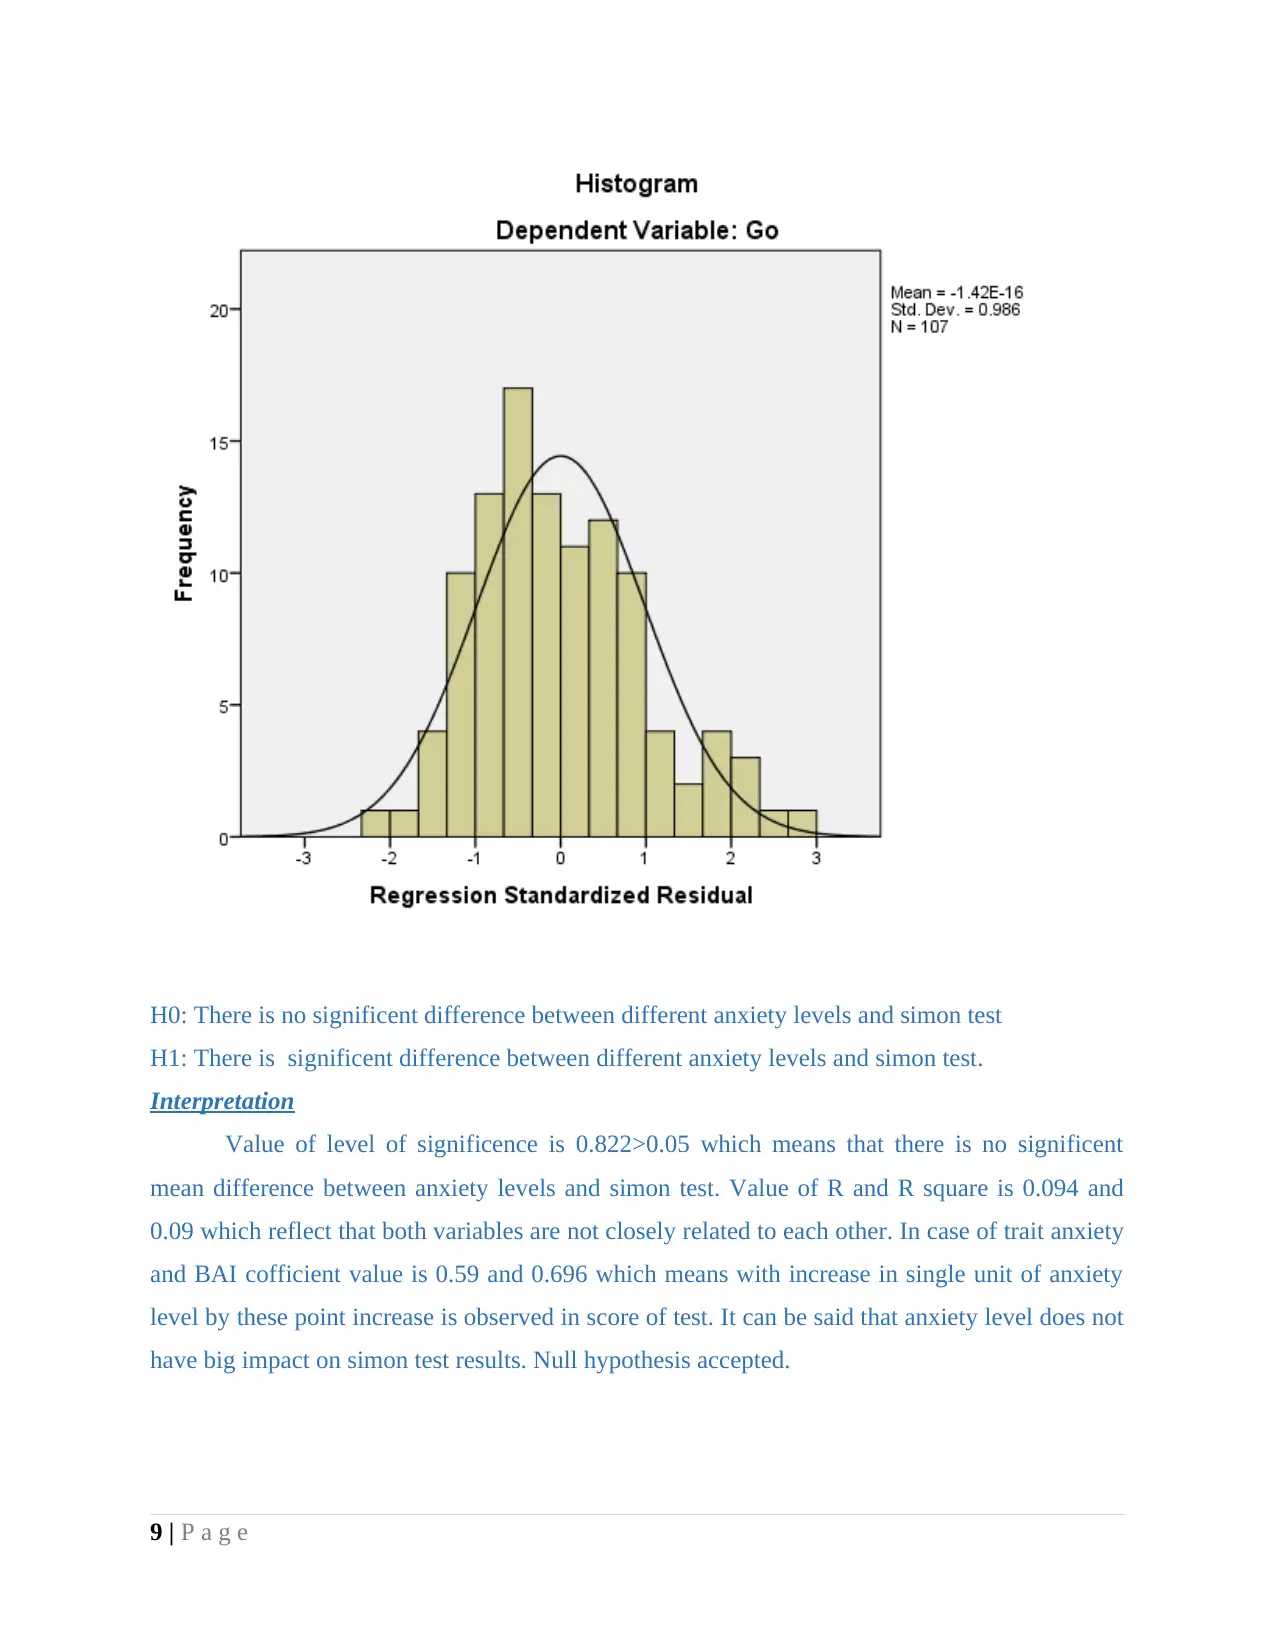
H0: There is no significent difference between different anxiety levels and simon test
H1: There is significent difference between different anxiety levels and simon test.
Interpretation
Value of level of significence is 0.822>0.05 which means that there is no significent
mean difference between anxiety levels and simon test. Value of R and R square is 0.094 and
0.09 which reflect that both variables are not closely related to each other. In case of trait anxiety
and BAI cofficient value is 0.59 and 0.696 which means with increase in single unit of anxiety
level by these point increase is observed in score of test. It can be said that anxiety level does not
have big impact on simon test results. Null hypothesis accepted.
9 | P a g e
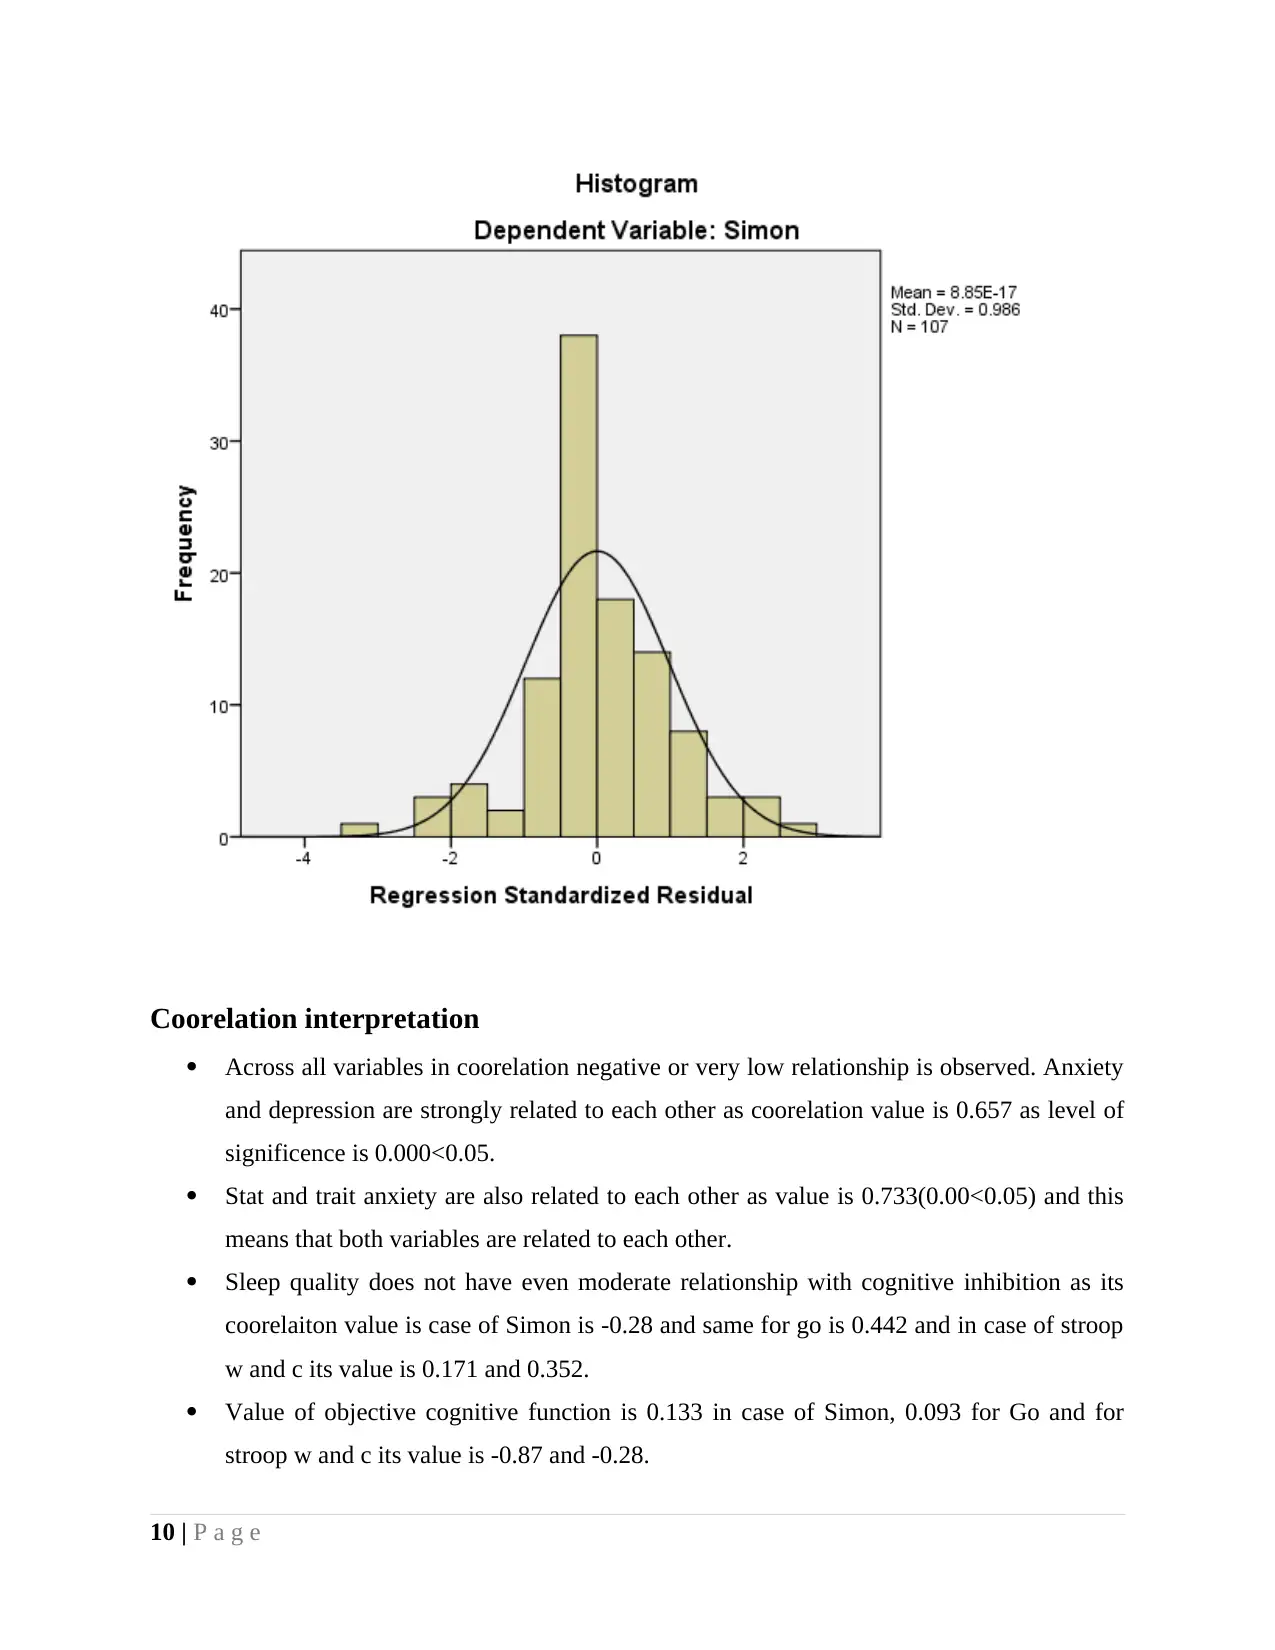
Coorelation interpretation
Across all variables in coorelation negative or very low relationship is observed. Anxiety
and depression are strongly related to each other as coorelation value is 0.657 as level of
significence is 0.000<0.05.
Stat and trait anxiety are also related to each other as value is 0.733(0.00<0.05) and this
means that both variables are related to each other.
Sleep quality does not have even moderate relationship with cognitive inhibition as its
coorelaiton value is case of Simon is -0.28 and same for go is 0.442 and in case of stroop
w and c its value is 0.171 and 0.352.
Value of objective cognitive function is 0.133 in case of Simon, 0.093 for Go and for
stroop w and c its value is -0.87 and -0.28.
10 | P a g e
⊘ This is a preview!⊘
Do you want full access?
Subscribe today to unlock all pages.
Trusted by 1+ million students worldwide
1 out of 35
Related Documents


Your All-in-One AI-Powered Toolkit for Academic Success.
+13062052269
info@desklib.com
Available 24*7 on WhatsApp / Email
![[object Object]](/_next/static/media/star-bottom.7253800d.svg)
Unlock your academic potential
Copyright © 2020–2025 A2Z Services. All Rights Reserved. Developed and managed by ZUCOL.