SPSS Analysis - Tobacco Use in Uganda
Added on 2023-02-02
14 Pages2342 Words92 Views
SPSS ANALYSIS- TOBACCO
USE IN UGANDA
USE IN UGANDA

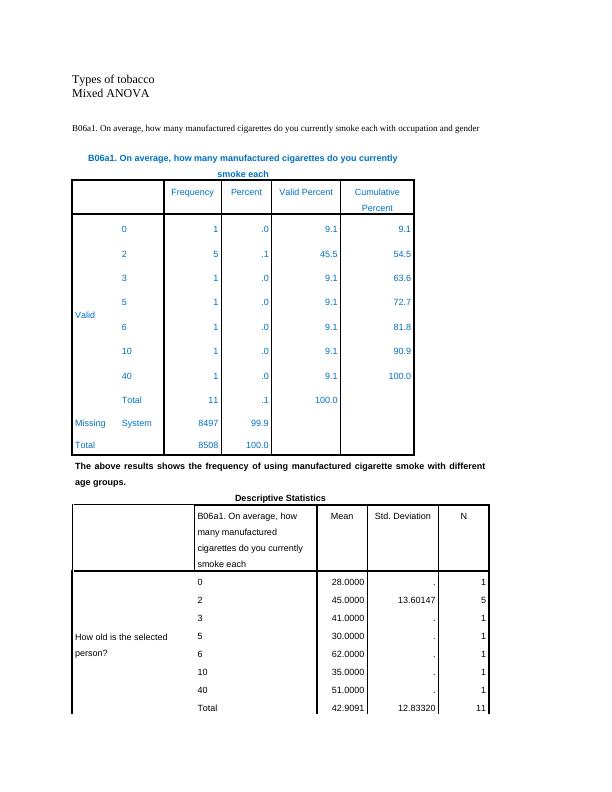
Types of tobacco
Mixed ANOVA
B06a1. On average, how many manufactured cigarettes do you currently smoke each with occupation and gender
B06a1. On average, how many manufactured cigarettes do you currently
smoke each
Frequency Percent Valid Percent Cumulative
Percent
Valid
0 1 .0 9.1 9.1
2 5 .1 45.5 54.5
3 1 .0 9.1 63.6
5 1 .0 9.1 72.7
6 1 .0 9.1 81.8
10 1 .0 9.1 90.9
40 1 .0 9.1 100.0
Total 11 .1 100.0
Missing System 8497 99.9
Total 8508 100.0
The above results shows the frequency of using manufactured cigarette smoke with different
age groups.
Descriptive Statistics
B06a1. On average, how
many manufactured
cigarettes do you currently
smoke each
Mean Std. Deviation N
How old is the selected
person?
0 28.0000 . 1
2 45.0000 13.60147 5
3 41.0000 . 1
5 30.0000 . 1
6 62.0000 . 1
10 35.0000 . 1
40 51.0000 . 1
Total 42.9091 12.83320 11
A01. [RECORD GENDER
FROM OBSERVATION.
ASK IF NECESSARY.]
0 1.00 . 1
2 1.00 .000 5
3 1.00 . 1
5 1.00 . 1
6 1.00 . 1
10 1.00 . 1
40 1.00 . 1
Total 1.00 .000 11
A05. Which of the following
best describes your *main*
work status over the past
0 3.00 . 1
2 3.00 .000 5
3 3.00 . 1
5 3.00 . 1
6 3.00 . 1
10 3.00 . 1
40 3.00 . 1
Total 3.00 .000 11
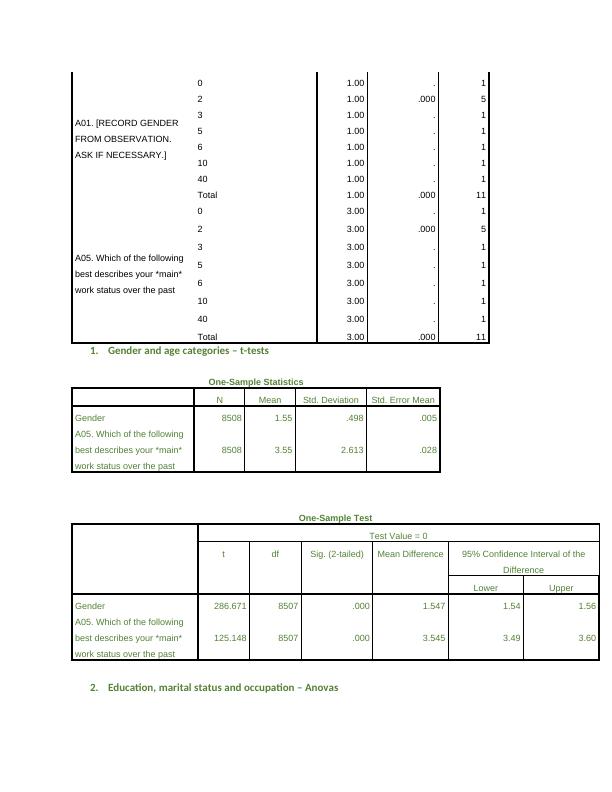
1. Gender and age categories – t-tests
One-Sample Statistics
N Mean Std. Deviation Std. Error Mean
Gender 8508 1.55 .498 .005
A05. Which of the following
best describes your *main*
work status over the past
8508 3.55 2.613 .028
One-Sample Test
Test Value = 0
t df Sig. (2-tailed) Mean Difference 95% Confidence Interval of the
Difference
Lower Upper
Gender 286.671 8507 .000 1.547 1.54 1.56
A05. Which of the following
best describes your *main*
work status over the past
125.148 8507 .000 3.545 3.49 3.60
2. Education, marital status and occupation – Anovas
FROM OBSERVATION.
ASK IF NECESSARY.]
0 1.00 . 1
2 1.00 .000 5
3 1.00 . 1
5 1.00 . 1
6 1.00 . 1
10 1.00 . 1
40 1.00 . 1
Total 1.00 .000 11
A05. Which of the following
best describes your *main*
work status over the past
0 3.00 . 1
2 3.00 .000 5
3 3.00 . 1
5 3.00 . 1
6 3.00 . 1
10 3.00 . 1
40 3.00 . 1
Total 3.00 .000 11
1. Gender and age categories – t-tests
One-Sample Statistics
N Mean Std. Deviation Std. Error Mean
Gender 8508 1.55 .498 .005
A05. Which of the following
best describes your *main*
work status over the past
8508 3.55 2.613 .028
One-Sample Test
Test Value = 0
t df Sig. (2-tailed) Mean Difference 95% Confidence Interval of the
Difference
Lower Upper
Gender 286.671 8507 .000 1.547 1.54 1.56
A05. Which of the following
best describes your *main*
work status over the past
125.148 8507 .000 3.545 3.49 3.60
2. Education, marital status and occupation – Anovas
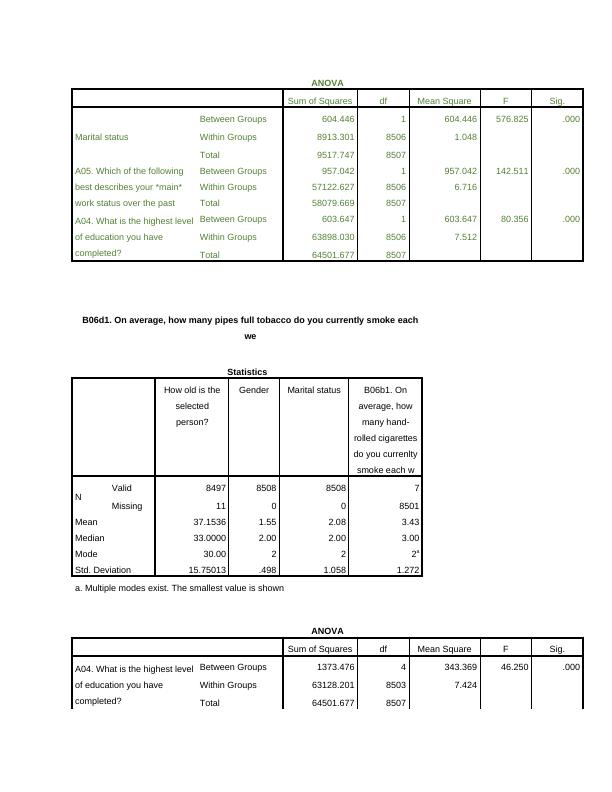
ANOVA
Sum of Squares df Mean Square F Sig.
Marital status
Between Groups 604.446 1 604.446 576.825 .000
Within Groups 8913.301 8506 1.048
Total 9517.747 8507
A05. Which of the following
best describes your *main*
work status over the past
Between Groups 957.042 1 957.042 142.511 .000
Within Groups 57122.627 8506 6.716
Total 58079.669 8507
A04. What is the highest level
of education you have
completed?
Between Groups 603.647 1 603.647 80.356 .000
Within Groups 63898.030 8506 7.512
Total 64501.677 8507
B06d1. On average, how many pipes full tobacco do you currently smoke each
we
Statistics
How old is the
selected
person?
Gender Marital status B06b1. On
average, how
many hand-
rolled cigarettes
do you currenlty
smoke each w
N Valid 8497 8508 8508 7
Missing 11 0 0 8501
Mean 37.1536 1.55 2.08 3.43
Median 33.0000 2.00 2.00 3.00
Mode 30.00 2 2 2a
Std. Deviation 15.75013 .498 1.058 1.272
a. Multiple modes exist. The smallest value is shown
ANOVA
Sum of Squares df Mean Square F Sig.
A04. What is the highest level
of education you have
completed?
Between Groups 1373.476 4 343.369 46.250 .000
Within Groups 63128.201 8503 7.424
Total 64501.677 8507
Sum of Squares df Mean Square F Sig.
Marital status
Between Groups 604.446 1 604.446 576.825 .000
Within Groups 8913.301 8506 1.048
Total 9517.747 8507
A05. Which of the following
best describes your *main*
work status over the past
Between Groups 957.042 1 957.042 142.511 .000
Within Groups 57122.627 8506 6.716
Total 58079.669 8507
A04. What is the highest level
of education you have
completed?
Between Groups 603.647 1 603.647 80.356 .000
Within Groups 63898.030 8506 7.512
Total 64501.677 8507
B06d1. On average, how many pipes full tobacco do you currently smoke each
we
Statistics
How old is the
selected
person?
Gender Marital status B06b1. On
average, how
many hand-
rolled cigarettes
do you currenlty
smoke each w
N Valid 8497 8508 8508 7
Missing 11 0 0 8501
Mean 37.1536 1.55 2.08 3.43
Median 33.0000 2.00 2.00 3.00
Mode 30.00 2 2 2a
Std. Deviation 15.75013 .498 1.058 1.272
a. Multiple modes exist. The smallest value is shown
ANOVA
Sum of Squares df Mean Square F Sig.
A04. What is the highest level
of education you have
completed?
Between Groups 1373.476 4 343.369 46.250 .000
Within Groups 63128.201 8503 7.424
Total 64501.677 8507
End of preview
Want to access all the pages? Upload your documents or become a member.
Related Documents
Relationship between gender and life happiness scorelg...
|26
|2817
|200
Biostatics SPSS Help Assignmentlg...
|7
|1001
|40
Paper on Sustainable Products by British Supermarketslg...
|29
|2550
|242
SOC5QSR Quantitative Skills for Social Researchlg...
|13
|1990
|200