SPSS Analysis Project: Correlation/Regression Analysis, Part 3
VerifiedAdded on 2023/01/24
|24
|5780
|67
Homework Assignment
AI Summary
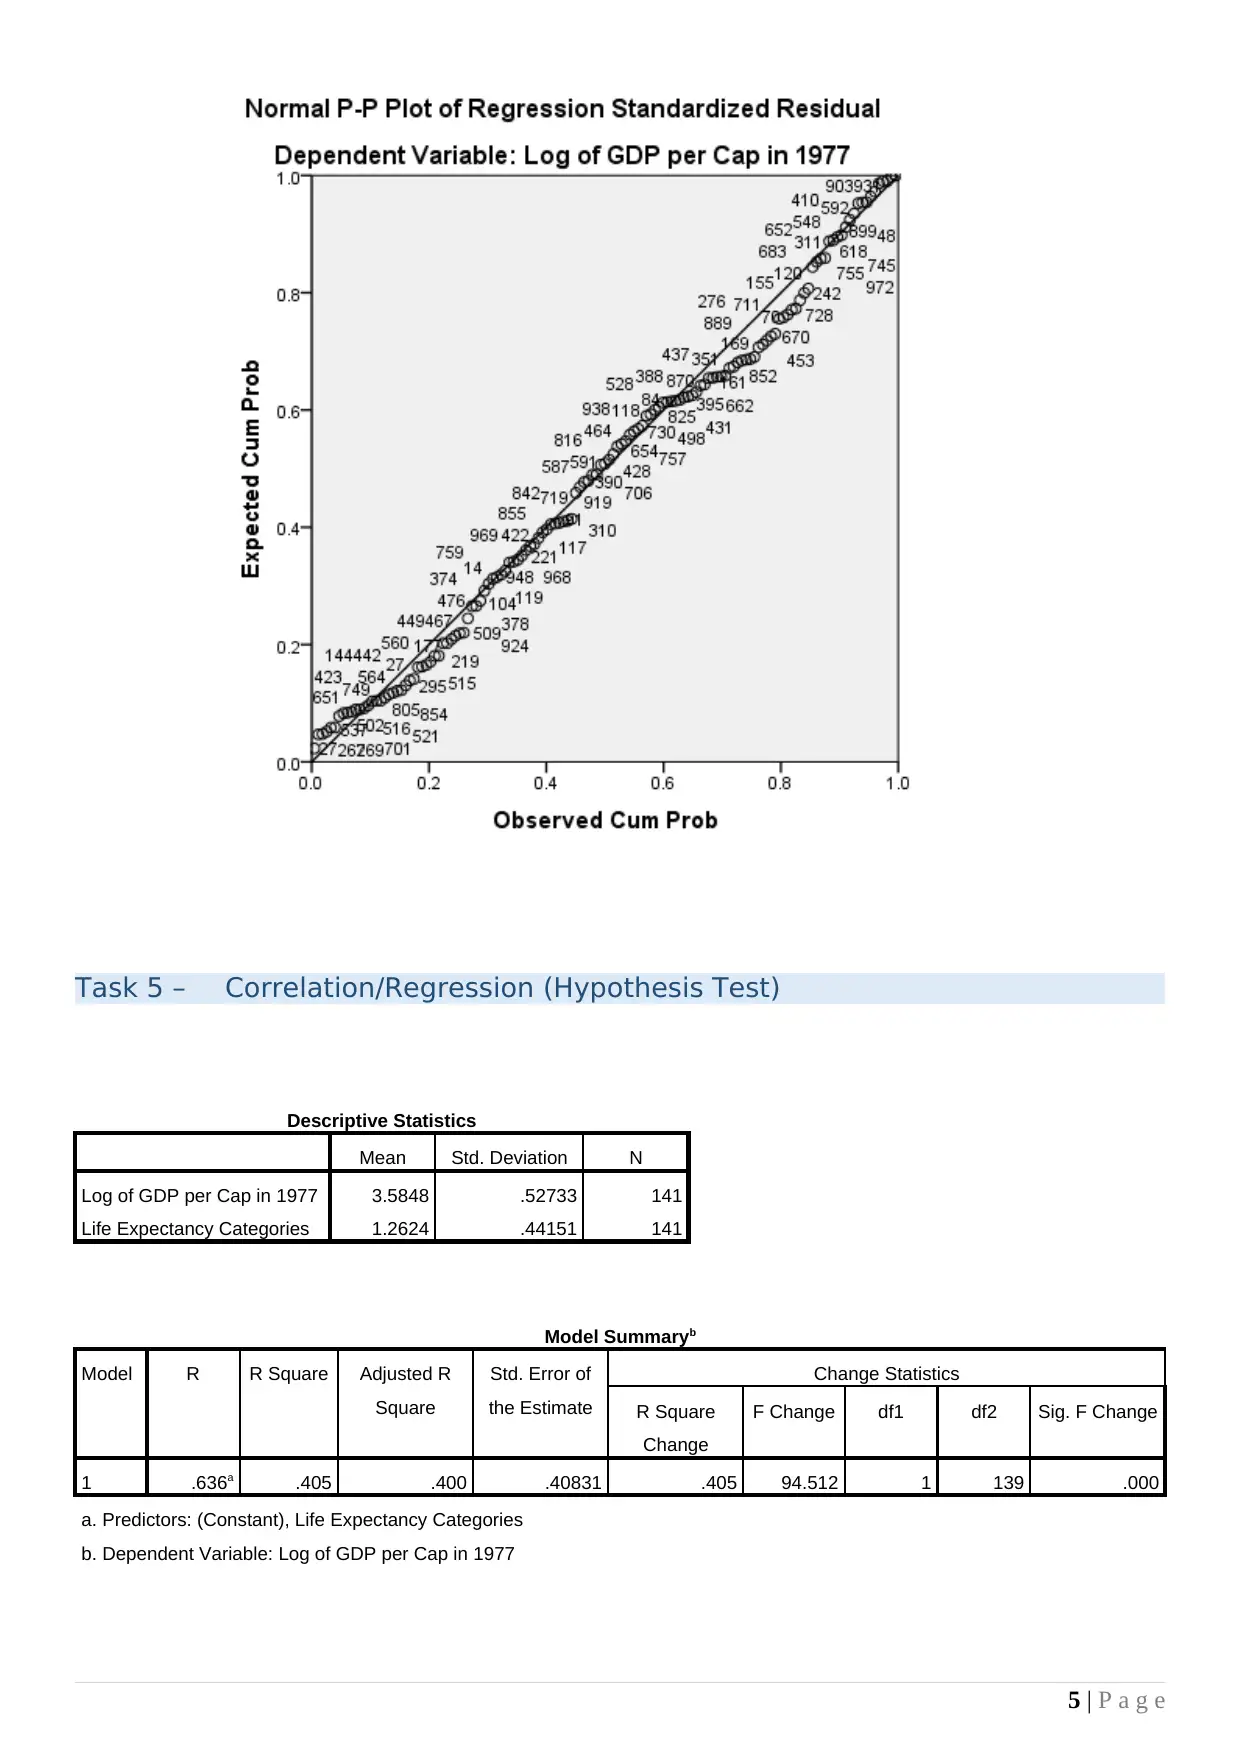
This SPSS analysis project explores the relationship between life expectancy and GDP per capita through correlation and regression analysis. The project begins by formulating hypotheses and then visualizes the data using scatter graphs. Bivariate correlation is examined, followed by regression analysis, assumption testing, and hypothesis testing. Furthermore, the project incorporates Chi-Square and OR analysis to investigate the association between hemisphere and life expectancy. The analysis includes descriptive statistics, model summaries, ANOVA tables, and coefficient interpretations to draw conclusions about the statistical relationships. The project provides a detailed examination of statistical methods, offering insights into data analysis techniques and interpretation of results.

1 out of 24
Related Documents


Your All-in-One AI-Powered Toolkit for Academic Success.
+13062052269
info@desklib.com
Available 24*7 on WhatsApp / Email
![[object Object]](/_next/static/media/star-bottom.7253800d.svg)
Copyright © 2020–2025 A2Z Services. All Rights Reserved. Developed and managed by ZUCOL.