SPSS Assessment: Analysis of Health and Lifestyle Data with Regression
VerifiedAdded on 2023/01/05
|32
|6201
|31
Report
AI Summary
This report presents an analysis of health and lifestyle data using SPSS. The study investigates the relationships between various factors, including marital status, smoking habits, age, and body mass index, based on a sample of 1000 respondents. The methodology includes descriptive statistics, linear regression analysis, t-tests, ANOVA, and chi-square tests to address research questions related to smoking and cigarette consumption, age and BMI, marital status and household bedrooms, and credit receivers and car ownership. The results section presents findings from these tests, including chi-square analysis of categorical variables and discussions on skewness, kurtosis, and percentiles. The report aims to provide insights into the health and lifestyle characteristics of the sample participants, with detailed explanations of the statistical methods employed and the outcomes of the analysis.

SPSS Assessment
Paraphrase This Document
Need a fresh take? Get an instant paraphrase of this document with our AI Paraphraser
Contents
INTRODUCTION...........................................................................................................................3
MAIN BODY..................................................................................................................................3
METHODS..................................................................................................................................3
Data analysis................................................................................................................................5
RESULTS....................................................................................................................................6
DISCUSSION................................................................................................................................19
REFERENCES..............................................................................................................................20
INTRODUCTION
The report is based on data related to health and general information. These data are
considered of a particular sample size. The objective of project report is to understand relation
between different kinds of data set which is given. The main aim of the report is to define the
health, socio-demographic and lifestyle of a large number of sample which are selected with the
help of randomly sampling method. There is different variable which such as material status,
household tenure, age, gender for the sample size which are beneficial in making correct test that
deliver the most suitable results for the research. The research questions outline about detailed
information related to different aspects of health and issues. The objective of research is assessed
or analyze about how marital status, smoking habits and other general information are
interrelated to each other’s. These data are collected by taking review of 1000 different
respondents. By help of this research, it will be easier to understand about how smoking status
and cigarettes are interrelated as well as relation between age and body mass index is also
analyzed through various SPSS tests. There are different kinds of data including dependent and
independent (Lawrence, 2019). Under the report different kinds of SPSS tests have been applied
in order to find out particular results. The tests which have been applied are descriptive statistics,
linear regression analysis, t test, etc. These tests are applied in accordance of nature of data set
and requirement in the brief. In order to complete different kinds of tests below some hypothesis
are prepared:
PURPOSE
The objective or purpose of such report is to assess health and lifestyle characteristics of those
participants which are used as sample. Under such analysis, detailed assessment of different
kinds of aspects has been done including their body mass index, smoking habits and many more.
As well as it is done in accordance of test of hypothesis in a detailed manner.
METHODS
In the context of above report, different kinds of tests have been applied. The main
sociodemographic, health and lifestyle characteristics of the selected sample participants are:
⊘ This is a preview!⊘
Do you want full access?
Subscribe today to unlock all pages.
Trusted by 1+ million students worldwide

Marital status, Household tenure, Systolic BP (mean 2nd/3rd), Diastolic BP (mean 2nd/3rd),
Alchol consumption grouped (units) – men and women, Extended smoking status and Body
Mass Index.
Research question one:
What is relation between smoking status and number of cigarettes smoked on weekdays?
H0: Is there positive relation between smoking status and number of cigarettes smoked on
weekdays?
H1: Is there negative relation between smoking status and number of cigarettes smoked on
weekdays?
Research questions two: There is dependency of age on body mass index.
H0: There is positive relation of age on body mass index.
H1: There is negative relation of age on body mass index
Research questions three: What is relation between people who are married and numbers of
bedrooms in household?
H0: Is there positive relation between people who are married and numbers of bedrooms in
household?
H1: Is there negative relation between people who are married and numbers of bedrooms in
household?
Research questions four: What is relation of credit receivers and car holders?
H0: Is there relation between people who receives credit and car holders.
Paraphrase This Document
Need a fresh take? Get an instant paraphrase of this document with our AI Paraphraser
H1: There is no relation between people who receives credit and car holders.
For each research question mention above there have been different type of test being performed
such as multiple linear regression analysis, t test, Z test, descriptive, frequencies and M-ANOVA
for each hypothesis and assumptions that have been checked to choose that test. The test which
are univariate are regression, descriptive, frequencies analysis and the other test are multivariate
such as t test, Z test and M-ANOVA.
In hypothesis one, correlation test has been applied as well as for hypothesis two, one sample t-
test applied. In addition to this, for hypothesis three ANOVA test applied and in the end for last
hypothesis Chi-square test is done. Apart from this descriptive statistic is also done in a detailed
manner. As well as for hypothesis four multiple regression analysis is also done.
Study design: Research is structured to coordinate the research procedure and statistical analysis
to guarantee either support or deny the null hypothesis and that the results represent the facts. In
relation to above case, the study is designed in order to do analysis given data which are primary
data (Dai, Wang and Li, 2019). The one-sample t-test is being used to assess if a sample
defines from such a given average population. The means demographic is often not understood,
but is often believed. For example, users would like to demonstrate that a modern
eating approach will boost their immune system to the state scale for pupils failing to various
diseases. Alternatively, many conclude that, considering the risks (e.g., tiredness) of serving
such long shifts, doctors employed in Emergency department (A & E) services work 100 hours
each week. In A & E units, they sample 1000 physicians and see if certain hours are different
from 100 hours.
Sample size: The collection of the number of findings or replicates to be used in the experimental
survey is an act to evaluate samples (Ding, Shuai and Wang, 2019). Any empiric analysis that
attempts to draw inferences on a sample people is an important aspect of its sample dimensions.
In the above research, the size of sample is 1000.
Data analysis
In order to uncover valuable information with business decision-making, statistical analysis was
considered as a method of processing, converting and modelling data. The objective of analysis
is to obtain valuable information again from information in order to make decisions depending
on data analysis. In certain real experiences, if they make any choice, it is by worrying for
whatever happened the last time in general health of customers or what can happen by making
the same decision. It is nothing but to evaluate and make choices dependent on the experience or
future. The accumulate thoughts of our history or visions of their potential for it though any
situation (Abadie, A., Imbens and Wooldridge, 2020). Therefore, it is stated as that was nothing
but some interpretation of numbers. Data Analysis is about the same activity a researcher is
doing for commercial purposes.
Multiple linear regression analysis: In mathematical modeling, regression analysis is a
series of mathematical mechanisms for evaluating the associations among a subject factor
(often named the 'outcome variable') and any or more independence factors. Most general
method of logistic regression is normal distribution, where a firm wants the line (or a
more complex control mixture) which more exactly resembles the data with a certain
statistical criterion (Lawrence, 2019). The system of commonplace minimal response for
example calculates the one line (or hyper - plane) which minimizes the data as a basis
between both the actual knowledge (or hyper plane) and that line. This helps researchers
to predict the dependent distribution's conditional mean (or population average) for
particular statistical purposes (see linear regression) if control variables take on a given
system of principles.
Descriptive and frequencies analysis: A descriptive figure (in the count nominal sense) is
a descriptive statistique which defines or summarizes features from data gathering in a
qualitative way, whereas descriptive figures are used and analyzed (Abadie, Athey and
Wooldridge, 2020). In order to analyze a survey instead of using the data to talk about the
community the application of the data is supposed to represent, descriptive statistics are
separating from inferential statisticians (or inductive figures). This implies that, in
contrast to statistical tests, definition statistics are not usually built based on the principle
of probability and instead parametric statistics. Qualitative data are often typically
submitted even though a data study draws the key conclusions using hypothesis testing.
⊘ This is a preview!⊘
Do you want full access?
Subscribe today to unlock all pages.
Trusted by 1+ million students worldwide
In such test we have used variables related to all those aspects which are given like
alcohol consumption, BMI, number of cigarettes smoked, state of generate health etc.
Apart from the categorical variables we have used all variables for descriptive statistics.
T test and Z test: Perhaps the basic example of data methods is univariate analysis (Guo,
Yang and Li, 2019). It may be inferential or abstract, as in other types of data. It is
important to remember that there is only one factor. In cases where multivarian research
is more suitable, multivariate analysis can lead to incorrect findings.
From the data provided it has been defined that each value represents a specific variable which
help in making a creating a new variable will help in making more results. The meaning label(s)
that really should be identified with each acronym of a type for coded explanatory data.
Primarily for numerical (i.e., nominal or ordinal) parameters, value marks are useful, particularly
if heath variables a have been reported as codes. It is highly recommended that you assign a
name to each quality such that they (and anybody looking at the information or results) know
what each number shows. When quality tags are specified, rather than the originally codes, the
symbols will be shown in the production. Notice that only the marks connected for each quality
are influenced by the definition of value marks, which do not alter the reported values itself.
Example: In the test sample, the ranking parameter reflects the class rank of the pupil. The 1, 2,
3, 4 values reflect the variables grades, respectively. Let's describe the group labels in the data
set for both the Rank attribute. Under the 'Values' tab, select a cell corresponding to a variable
which quality they like. The length of each line in the chart for Data Display. Notice that this is
not the same as the number of sides which each value shows. This applies precisely to the length
of the individual spreadsheet column. To adjust the text size of a variable, press the "Columns"
tab for such a variable within the cell. Then press the arrow symbols "up" or "down" to raise or
reduce the column distance. The material alignment in the SPSS Data Display file cells and ways
involve left-justified, centre-justified, or right-justified. The cell referring to both the 'Align' row
for that cell to configure the orientation for the category. Then choose the desired orientation by
using the drop-down menu: Left, Right, or Middle.
RESULTS
Chi square between two categorical variables (men vs women having a diagnosis of CVD)
Paraphrase This Document
Need a fresh take? Get an instant paraphrase of this document with our AI Paraphraser
The table below, describe that the chi-square number looks within the Value column table
straightaway to the accurate of “Pearson Chi-Square”. In the below context of male or female
condition to cardiovascular situation the exact value of the chi square number is 0.842. The p-
value seems like within the same row in the “Asymptotic Significance (2-sided)” column (.359).
The consequence is important if this significance is equivalent to or a lesser amount of than the
nominated alpha level normally 0.05. The p-value is lower than the actual alpha value throughout
this case, then we would reject the null hypothesis which argues that the two variables are
independent from each other. The data indicates that the factors men vs women having a
diagnosis of CVD are linked with each other.
The other chi square test is between the systolic bp and the age of different respondent present
for the survey. A calculation of the lightness of the heads of a series is skewness. In SPSS,
kurtosis 0.0 does have a standard deviation. Affected by outliers distributions can have strong
positively or negatively skewness values, whereas values of kurtosis similar to 0 are nearly
normal representations. If certain tails are 'heavier' that for a regular distribution, kurtosis is
positive, although neutral if the tails are 'lighter' except for a regular distribution. This are the
percentiles for the writing of a measure. Any of the quantities are relatively tiny, which would be
a function of how well they are measured. For example, if there isn't a value at precisely the fifth
percentile, the value has been normalized. There are some different methods to measure these
values, so SPSS clarifies how it does by saying that 'Definition 1' is being used. These columns
send one vector values for different percentiles.
Analysis- In accordance of above done chi-square test this can be stated that this test has been
applied on two distinct variables. In accordance of above prepared tables this can be assessed
that value of significance difference is of 0.359 which is more than 0.05. This is an indication
that there is no relation between factors which are used for above done test. In addition to this
volume of Pearson’s correlation is negative which indicates that there is poor relation between
selected variables for above done test of Chi-square test.
Regression analysis:
Variables Entered/Removed
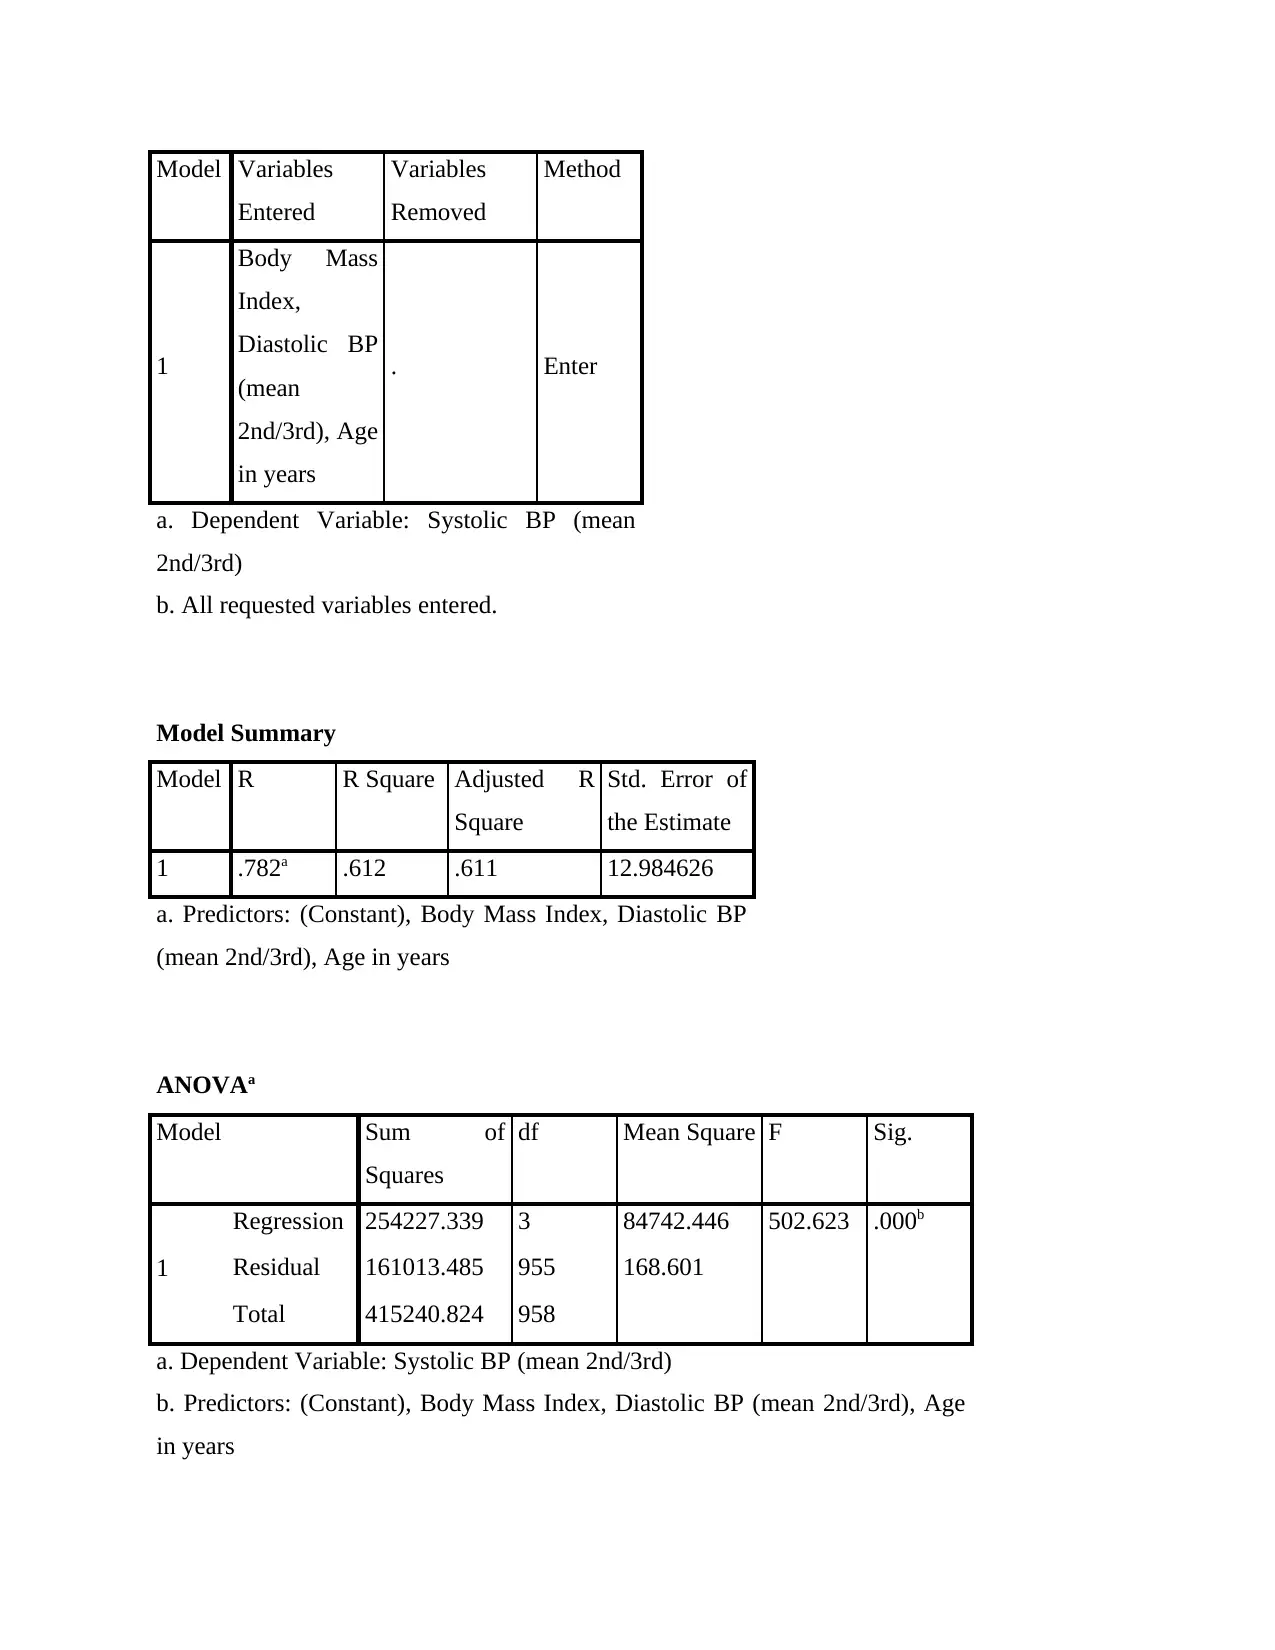
Model Variables
Entered
Variables
Removed
Method
1
Body Mass
Index,
Diastolic BP
(mean
2nd/3rd), Age
in years
. Enter
a. Dependent Variable: Systolic BP (mean
2nd/3rd)
b. All requested variables entered.
Model Summary
Model R R Square Adjusted R
Square
Std. Error of
the Estimate
1 .782a .612 .611 12.984626
a. Predictors: (Constant), Body Mass Index, Diastolic BP
(mean 2nd/3rd), Age in years
ANOVAa
Model Sum of
Squares
df Mean Square F Sig.
1
Regression 254227.339 3 84742.446 502.623 .000b
Residual 161013.485 955 168.601
Total 415240.824 958
a. Dependent Variable: Systolic BP (mean 2nd/3rd)
b. Predictors: (Constant), Body Mass Index, Diastolic BP (mean 2nd/3rd), Age
in years
⊘ This is a preview!⊘
Do you want full access?
Subscribe today to unlock all pages.
Trusted by 1+ million students worldwide
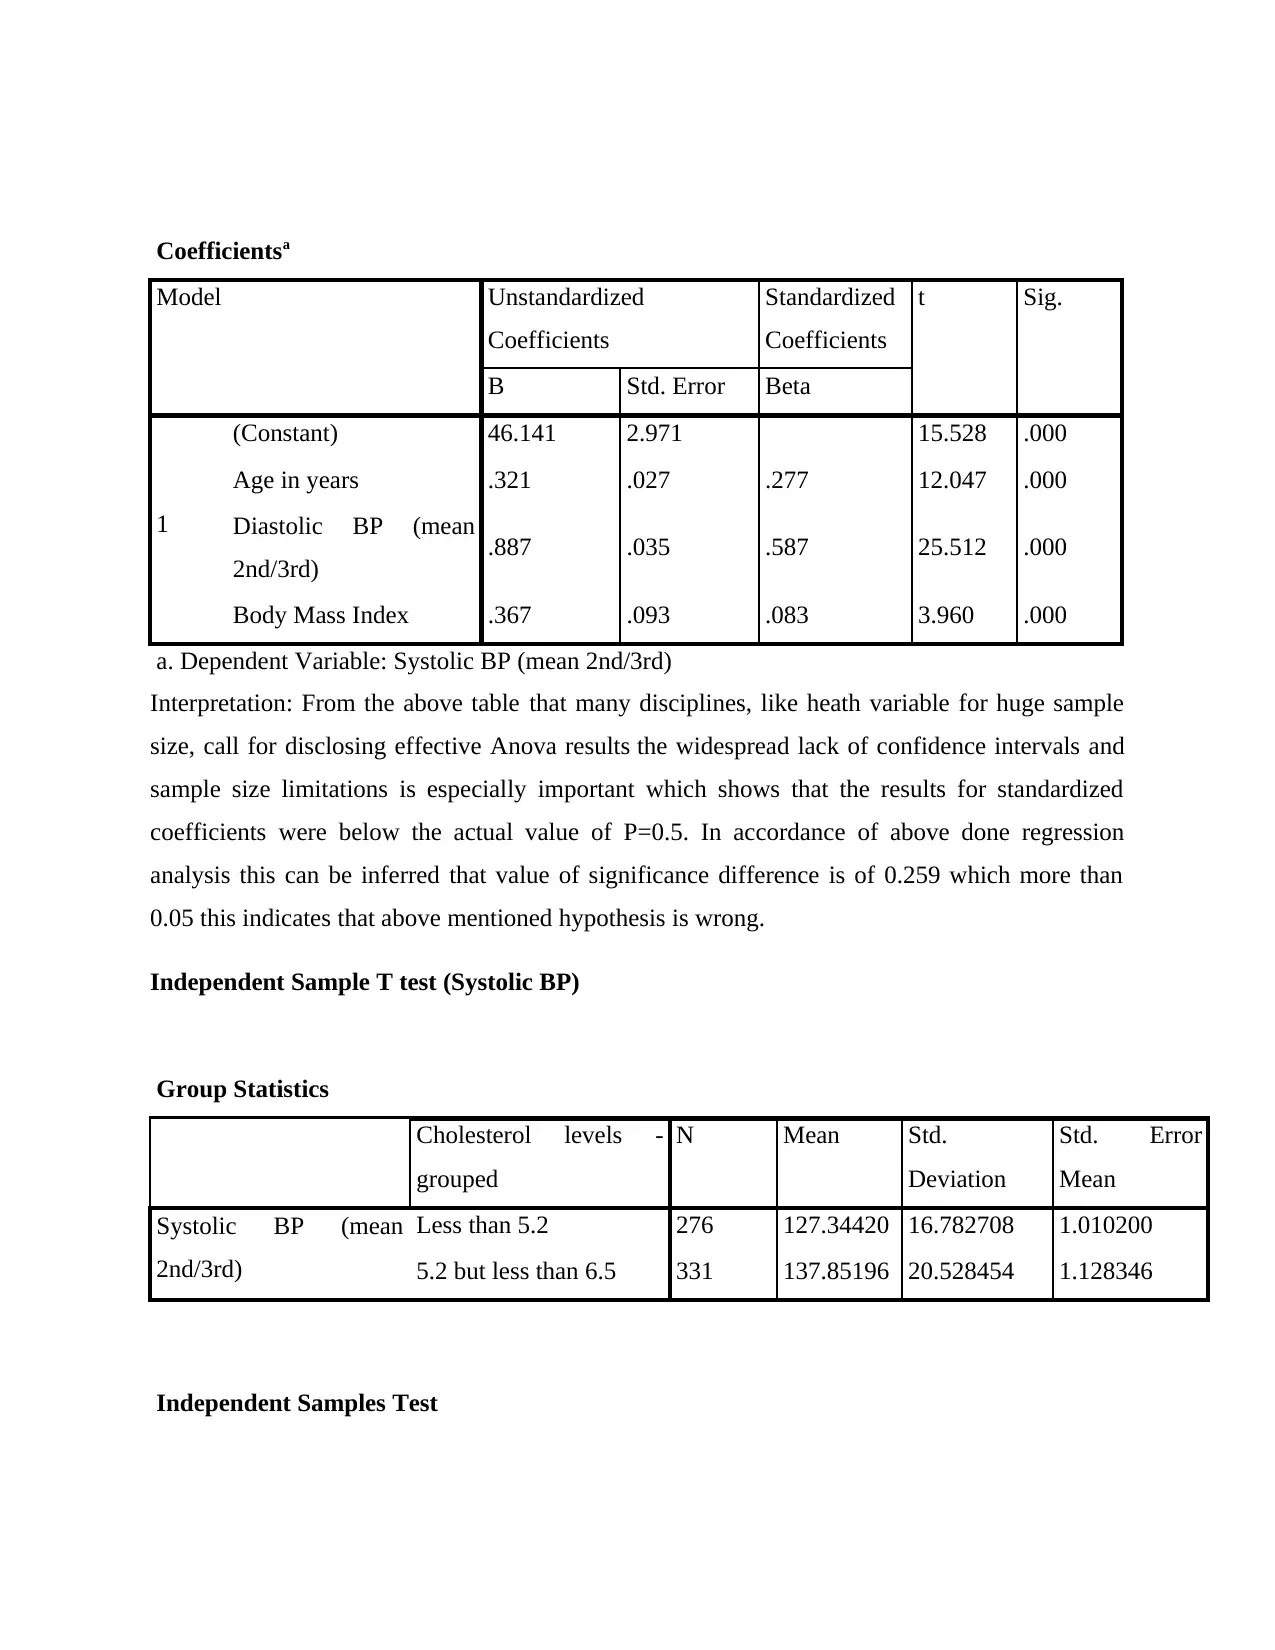
Coefficientsa
Model Unstandardized
Coefficients
Standardized
Coefficients
t Sig.
B Std. Error Beta
1
(Constant) 46.141 2.971 15.528 .000
Age in years .321 .027 .277 12.047 .000
Diastolic BP (mean
2nd/3rd) .887 .035 .587 25.512 .000
Body Mass Index .367 .093 .083 3.960 .000
a. Dependent Variable: Systolic BP (mean 2nd/3rd)
Interpretation: From the above table that many disciplines, like heath variable for huge sample
size, call for disclosing effective Anova results the widespread lack of confidence intervals and
sample size limitations is especially important which shows that the results for standardized
coefficients were below the actual value of P=0.5. In accordance of above done regression
analysis this can be inferred that value of significance difference is of 0.259 which more than
0.05 this indicates that above mentioned hypothesis is wrong.
Independent Sample T test (Systolic BP)
Group Statistics
Cholesterol levels -
grouped
N Mean Std.
Deviation
Std. Error
Mean
Systolic BP (mean
2nd/3rd)
Less than 5.2 276 127.34420 16.782708 1.010200
5.2 but less than 6.5 331 137.85196 20.528454 1.128346
Independent Samples Test
Paraphrase This Document
Need a fresh take? Get an instant paraphrase of this document with our AI Paraphraser
Levene's
Test for
Equality of
Variances
t-test for Equality of Means
F Sig. t df Sig.
(2-
tailed
)
Mean
Differenc
e
Std.
Error
Differenc
e
95% Confidence
Interval of the
Difference
Lower Upper
Systoli
c BP
(mean
2nd/3rd
)
Equal
variance
s
assumed
14.16
5
.00
0
-
6.81
4
605 .000
-
10.50776
1
1.542060
-
13.53620
1
-
7.47932
1
Equal
variance
s not
assumed
-
6.93
8
604.77
4 .000
-
10.50776
1
1.514486
-
13.48205
2
-
7.53347
0
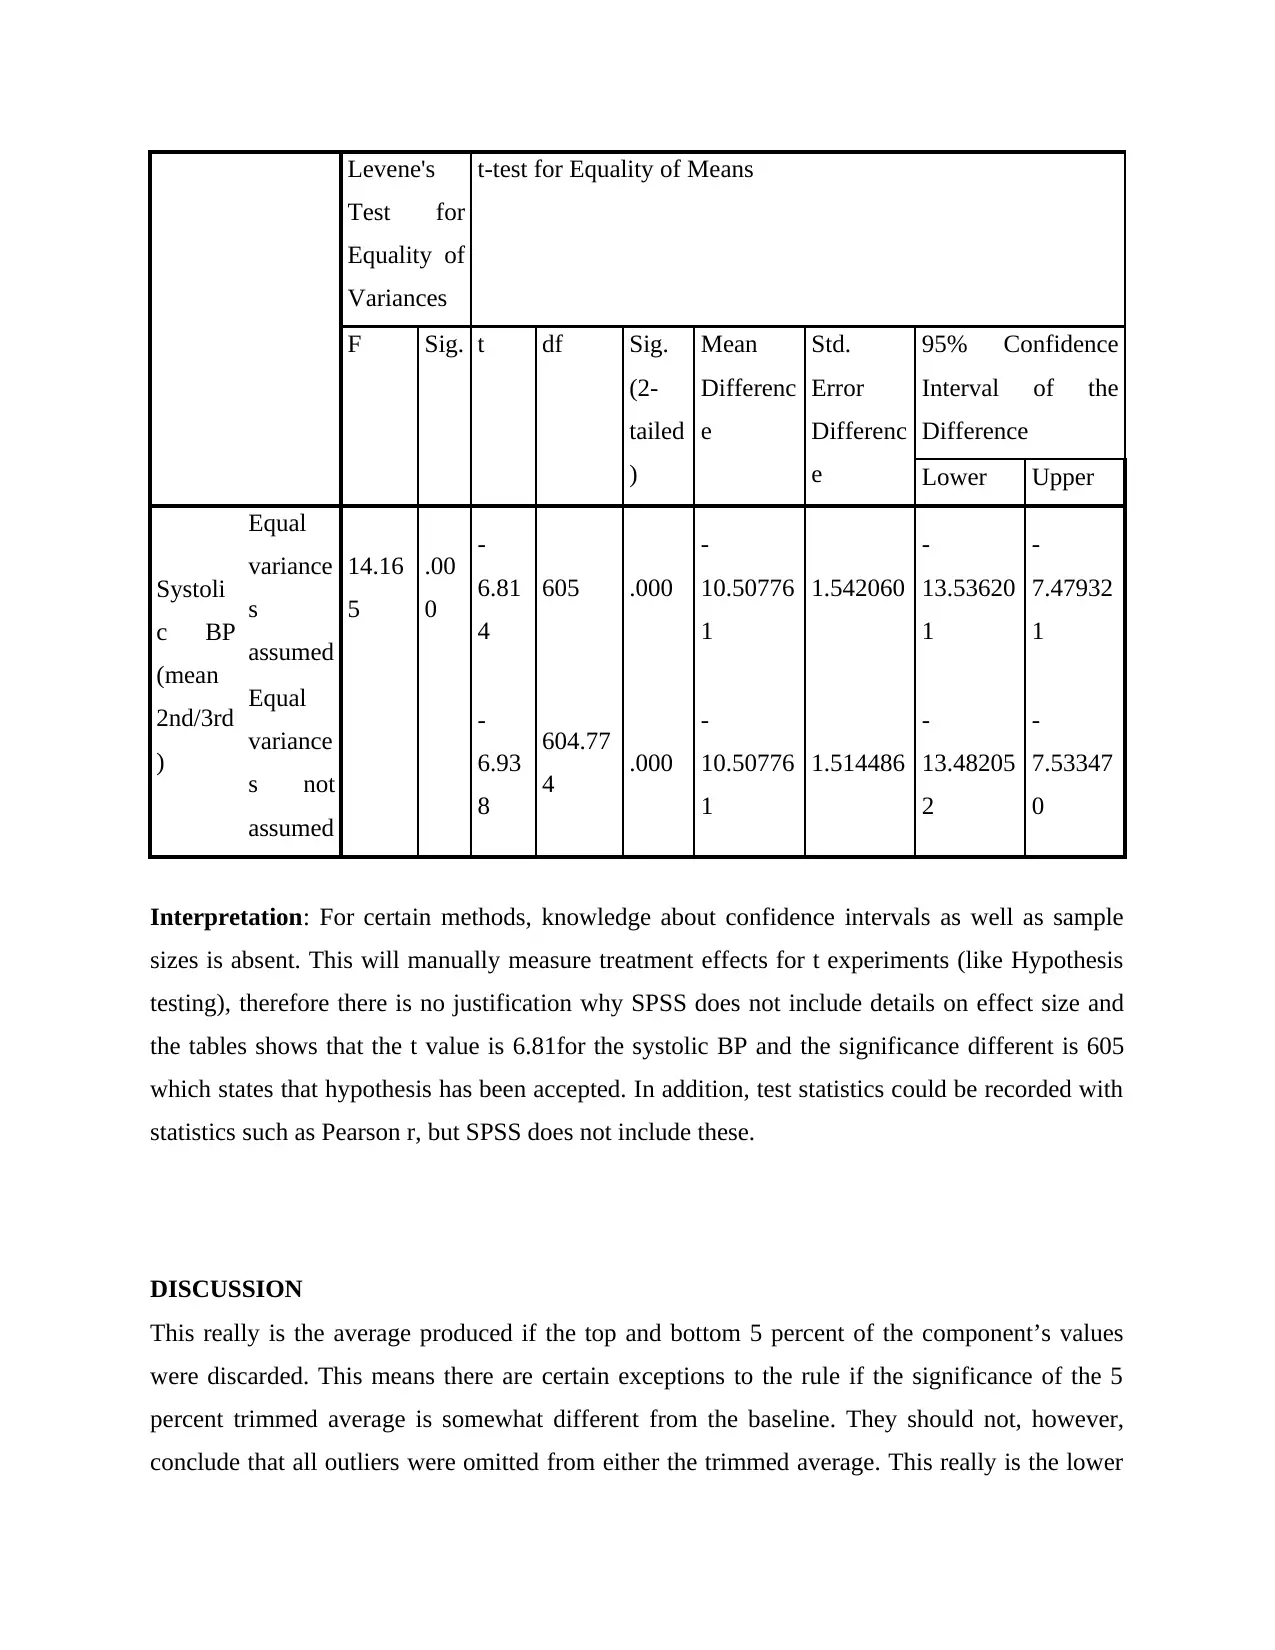
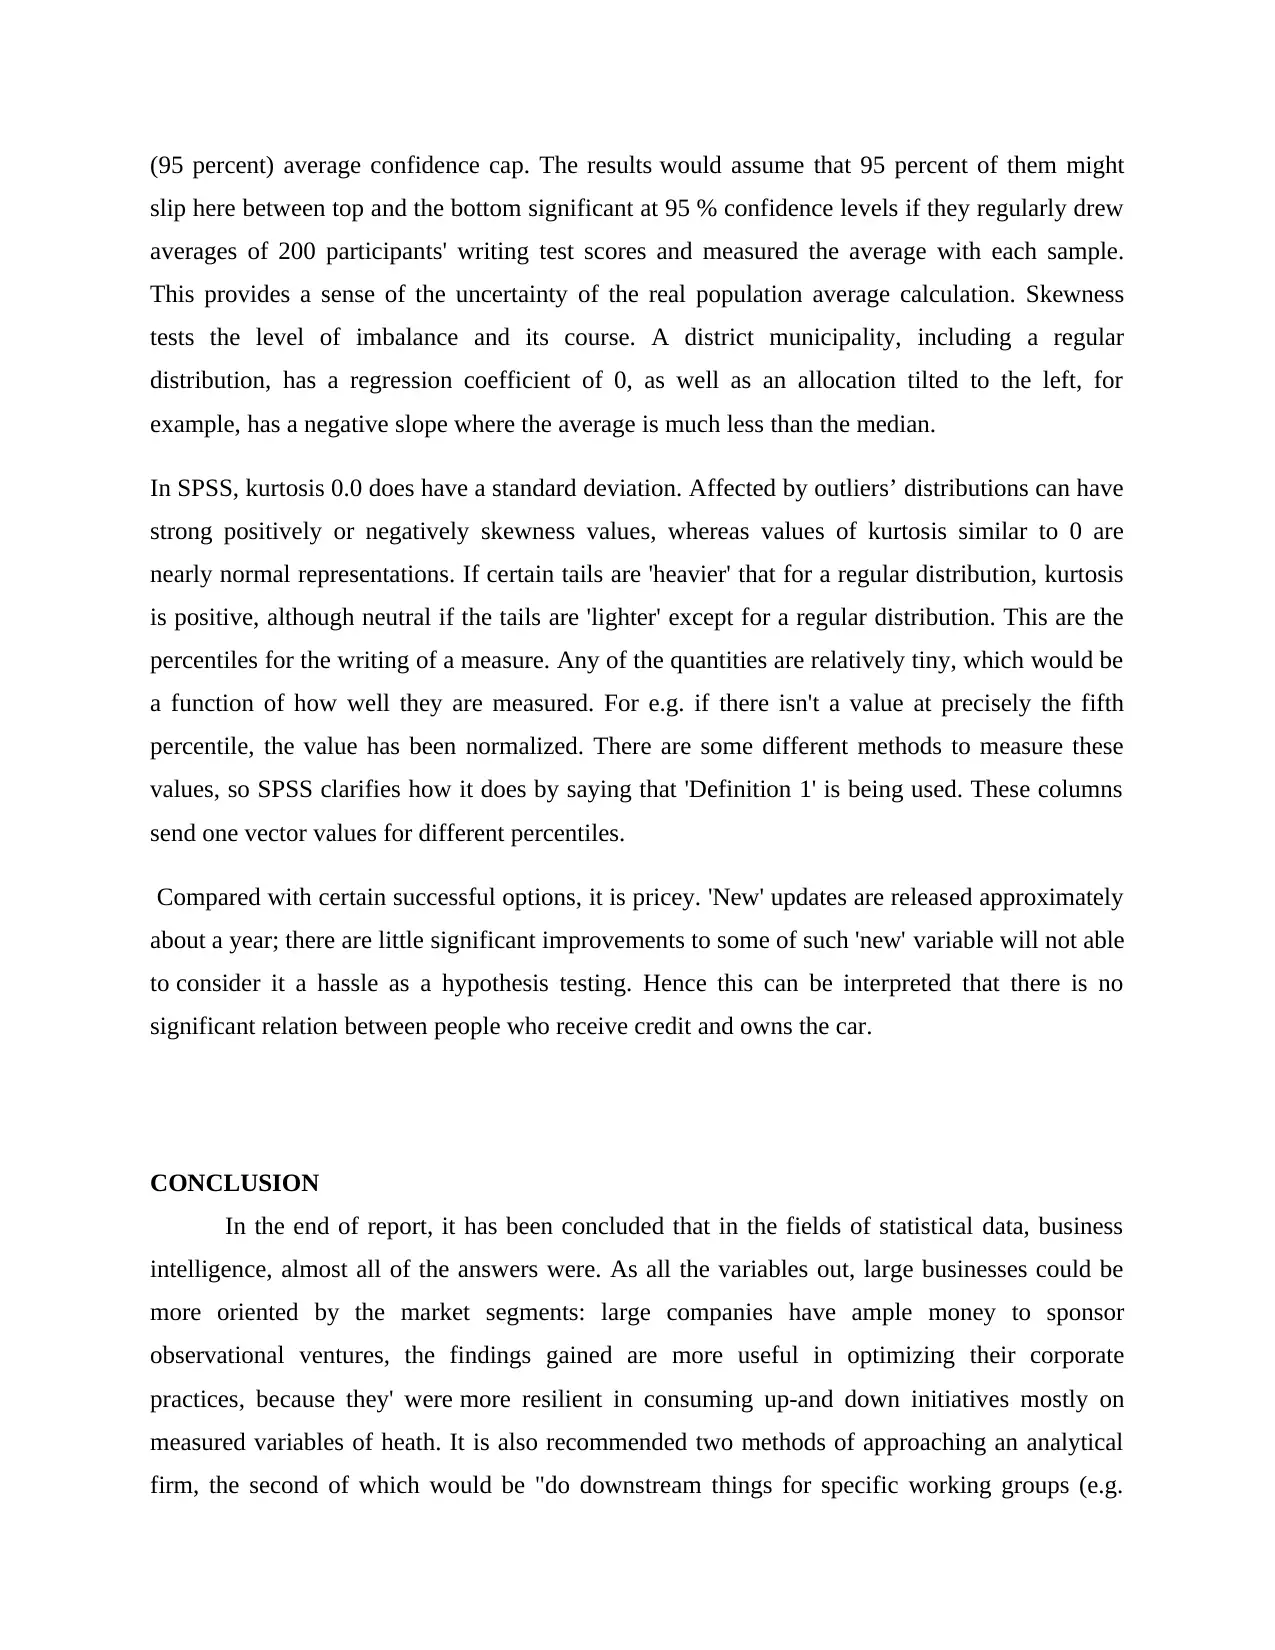
Interpretation: For certain methods, knowledge about confidence intervals as well as sample
sizes is absent. This will manually measure treatment effects for t experiments (like Hypothesis
testing), therefore there is no justification why SPSS does not include details on effect size and
the tables shows that the t value is 6.81for the systolic BP and the significance different is 605
which states that hypothesis has been accepted. In addition, test statistics could be recorded with
statistics such as Pearson r, but SPSS does not include these.
DISCUSSION
This really is the average produced if the top and bottom 5 percent of the component’s values
were discarded. This means there are certain exceptions to the rule if the significance of the 5
percent trimmed average is somewhat different from the baseline. They should not, however,
conclude that all outliers were omitted from either the trimmed average. This really is the lower
Test for
Equality of
Variances
t-test for Equality of Means
F Sig. t df Sig.
(2-
tailed
)
Mean
Differenc
e
Std.
Error
Differenc
e
95% Confidence
Interval of the
Difference
Lower Upper
Systoli
c BP
(mean
2nd/3rd
)
Equal
variance
s
assumed
14.16
5
.00
0
-
6.81
4
605 .000
-
10.50776
1
1.542060
-
13.53620
1
-
7.47932
1
Equal
variance
s not
assumed
-
6.93
8
604.77
4 .000
-
10.50776
1
1.514486
-
13.48205
2
-
7.53347
0
Interpretation: For certain methods, knowledge about confidence intervals as well as sample
sizes is absent. This will manually measure treatment effects for t experiments (like Hypothesis
testing), therefore there is no justification why SPSS does not include details on effect size and
the tables shows that the t value is 6.81for the systolic BP and the significance different is 605
which states that hypothesis has been accepted. In addition, test statistics could be recorded with
statistics such as Pearson r, but SPSS does not include these.
DISCUSSION
This really is the average produced if the top and bottom 5 percent of the component’s values
were discarded. This means there are certain exceptions to the rule if the significance of the 5
percent trimmed average is somewhat different from the baseline. They should not, however,
conclude that all outliers were omitted from either the trimmed average. This really is the lower
(95 percent) average confidence cap. The results would assume that 95 percent of them might
slip here between top and the bottom significant at 95 % confidence levels if they regularly drew
averages of 200 participants' writing test scores and measured the average with each sample.
This provides a sense of the uncertainty of the real population average calculation. Skewness
tests the level of imbalance and its course. A district municipality, including a regular
distribution, has a regression coefficient of 0, as well as an allocation tilted to the left, for
example, has a negative slope where the average is much less than the median.
In SPSS, kurtosis 0.0 does have a standard deviation. Affected by outliers’ distributions can have
strong positively or negatively skewness values, whereas values of kurtosis similar to 0 are
nearly normal representations. If certain tails are 'heavier' that for a regular distribution, kurtosis
is positive, although neutral if the tails are 'lighter' except for a regular distribution. This are the
percentiles for the writing of a measure. Any of the quantities are relatively tiny, which would be
a function of how well they are measured. For e.g. if there isn't a value at precisely the fifth
percentile, the value has been normalized. There are some different methods to measure these
values, so SPSS clarifies how it does by saying that 'Definition 1' is being used. These columns
send one vector values for different percentiles.
Compared with certain successful options, it is pricey. 'New' updates are released approximately
about a year; there are little significant improvements to some of such 'new' variable will not able
to consider it a hassle as a hypothesis testing. Hence this can be interpreted that there is no
significant relation between people who receive credit and owns the car.
CONCLUSION
In the end of report, it has been concluded that in the fields of statistical data, business
intelligence, almost all of the answers were. As all the variables out, large businesses could be
more oriented by the market segments: large companies have ample money to sponsor
observational ventures, the findings gained are more useful in optimizing their corporate
practices, because they' were more resilient in consuming up-and down initiatives mostly on
measured variables of heath. It is also recommended two methods of approaching an analytical
firm, the second of which would be "do downstream things for specific working groups (e.g.
⊘ This is a preview!⊘
Do you want full access?
Subscribe today to unlock all pages.
Trusted by 1+ million students worldwide
1 out of 32
Related Documents


Your All-in-One AI-Powered Toolkit for Academic Success.
+13062052269
info@desklib.com
Available 24*7 on WhatsApp / Email
![[object Object]](/_next/static/media/star-bottom.7253800d.svg)
Unlock your academic potential
Copyright © 2020–2026 A2Z Services. All Rights Reserved. Developed and managed by ZUCOL.