Comprehensive SPSS Report: Medical and General Statistics Analysis
VerifiedAdded on 2022/12/27
|13
|3004
|22
Report
AI Summary
This report presents an analysis of medical and general statistics data using SPSS. The study focuses on comprehending the relationships between various data sets, including fitness, socio-demographic characteristics, and activities of a wide group of randomly chosen individuals. The report explores the use of SPSS to examine the relationships between variables such as content status, household contracts, gender, and age. Various SPSS tests, including descriptive statistics, correlation coefficients, and exploratory methods, are employed to obtain specific findings. The report details the methods used, including linear regression, t-tests, Z-tests, and ANOVA, to test hypotheses and draw conclusions. Key findings include correlations between factors related to cardiovascular disease diagnoses in males and females, with statistical significance assessed using p-values. The analysis covers descriptive statistics, correlational analysis, and experimental data, providing a comprehensive overview of the data and its statistical properties, and concludes with the discussion of results and implications.
Spss
Paraphrase This Document
Need a fresh take? Get an instant paraphrase of this document with our AI Paraphraser
Table of Contents
INTRODUCTION...........................................................................................................................3
PURPOSE........................................................................................................................................3
Methods...........................................................................................................................................3
Data analysis....................................................................................................................................4
Variables..........................................................................................................................................5
CONCLUSION..............................................................................................................................11
REFERENCES..............................................................................................................................13
INTRODUCTION
The study is focused on data relevant to medical and general statistics. This indicators are
known of a specific sample size. The aim of the project document is to comprehend the
relationship between the various types of data sets provided. The report's key goal is to identify
the fitness, socio-demographic characteristics, and activities of a wide group of people who were
randomly chosen. For the random sample, there really are various variables such as content
status, households contract, gender, and age which are useful in making accurate tests that
produce the most appropriate outcomes for the study. The study questions provide extensive
background on a variety of topics. The study questions explain about specific knowledge relating
to various areas of wellbeing and problems. The purpose of study is judged or evaluate on how
employment satisfaction, smoking practises and other basic knowledge are interconnected to one
another. These data were gathered by a survey of specific respective questions. This study will
make it possible to realize how expression level and nicotine are linked, as well as the
relationship between aged and BMI, which will be examined using different SPSS measures.
There have been two types of data: contingent and autonomous data. Various types of SPSS
experiments were used to obtain specific findings in the study. Descriptive statistics, correlation
coefficient, exploratory, and other methods are being used. These measurements are used in
compliance with all relevant set's design as well as the brief's requirements.
PURPOSE
The aim or intent of such a study is to evaluate the dietary and fitness features of the survey
participants. A systematic evaluation of various variables, like the history of hypertension,
smoking patterns, and other factors, is already performed as part of this study. It is often carried
out in such a detailed way in line with the hypothesis test.
Methods
For each theory and inference that were tested to select that test, various types of tests were
conducted, like linear regression analysis, t test, Z test, descriptive, correlations, and M-ANOVA
with each study question listed above. Regression, predictive, and distributions review are
examples of un-ivariate tests, while t test, Z test, as well as M-ANOVA are examples of
multivariate tests.
Qualitative Research
⊘ This is a preview!⊘
Do you want full access?
Subscribe today to unlock all pages.
Trusted by 1+ million students worldwide
In assumption one, a correlation coefficient was used, and in multiple regressions, a one-sample
t-test was used. In comparison, for hypothesis three, an ANOVA test is used, however for
hypothesis four, a Chi-square method is used. Aside from that, descriptive statistics are often
performed in a thorough way. Multiple effects of the independent variables for assumption one
too though.
Quantitative Research
Study design: The study is organised to ensure that the study protocol and mathematical analyses
are coordinated to endorse or refute the scientific consensus, and that the findings accurately
represent the evidence. In the case at hand, the research is being conducted in order to analyse
the data that has been provided, which is descriptive statistics (Dai, Wang and Li, 2019). The
one-sample t-test is being used to determine if a sample is representative of a particular normal
number. The means population is sometimes misunderstood, but widely accepted. Users may
like to show that a new eating method would raise their immune response to the system level for
students who are afflicted with different diseases. Additionally, many people believe that, despite
the dangers (such as fatigue) of working such long days, physicians in emergency departments
(A & E) work 100 hours per week. 1000 doctors are sampled in A&E systems to see how those
hours vary from three months.
Data analysis
Data analysis was viewed as a means of analysing, transforming, and analysing information in
order to discover useful knowledge to aid business decision-making. The aim of research is to
extract value from data so that decisions can be made based on the findings. When people make
a choice based on real-life events, it is because they are concerned with what happens the very
last time in terms of consumer wellbeing or what could occur if they undertake the very same
judgment. It's just a matter of evaluating and making decisions based on past or future events. In
any case, they accumulate memories of our past or dreams of their future prospects. As a result,
it is claimed that it was nothing more than a numerical explanation. Statistical analysis is just the
same task that a researcher does for a company. Correlation analysis is a collection of statistical
mechanisms for analysing the relationships between a target factor (often referred to as the
'independent variables') and one or even more autonomy variables in mathematical modelling.
The most common form of regression analysis is simple model, where a company seeks the line
Paraphrase This Document
Need a fresh take? Get an instant paraphrase of this document with our AI Paraphraser
(or the more advanced communication mixture) that more closely matches the data according to
a set of statistical criteria. A descriptive estimate (in the count marginal sense) is a type of
descriptive statistic that distinguishes or summarises important attributes through data collection,
while descriptive statistics are being used and evaluated. Data analysis are distinguishing from
observational economists in interpreting a sample rather than using the results to speak about the
culture that the use of the information is meant to serve (or inductive figures). This means that,
unlike mathematical experiments, description statistics are normally constructed using
parametric statistics rather than the special relativity. Even if the data is qualitative, it is often
requested. For instance, the method of commonplace minimum answer measures the one line (or
hyper-plane) that minimises the information as a means for both the real information (and hyper
plane) but that line. If independent variables follow a set of rules, researchers may estimate the
conditional distribution's dependence structure (or population average) for specific tracking
purposes (see linear regression). And if a data analysis draws the main findings using hypothesis
tests, primary information is often sent. They used variables relevant to all of the aspects that
were given, like alcohol intake, BMI, and the amount of current smokers, in this research. They
already used parameters for descriptive analysis except the explanatory data.
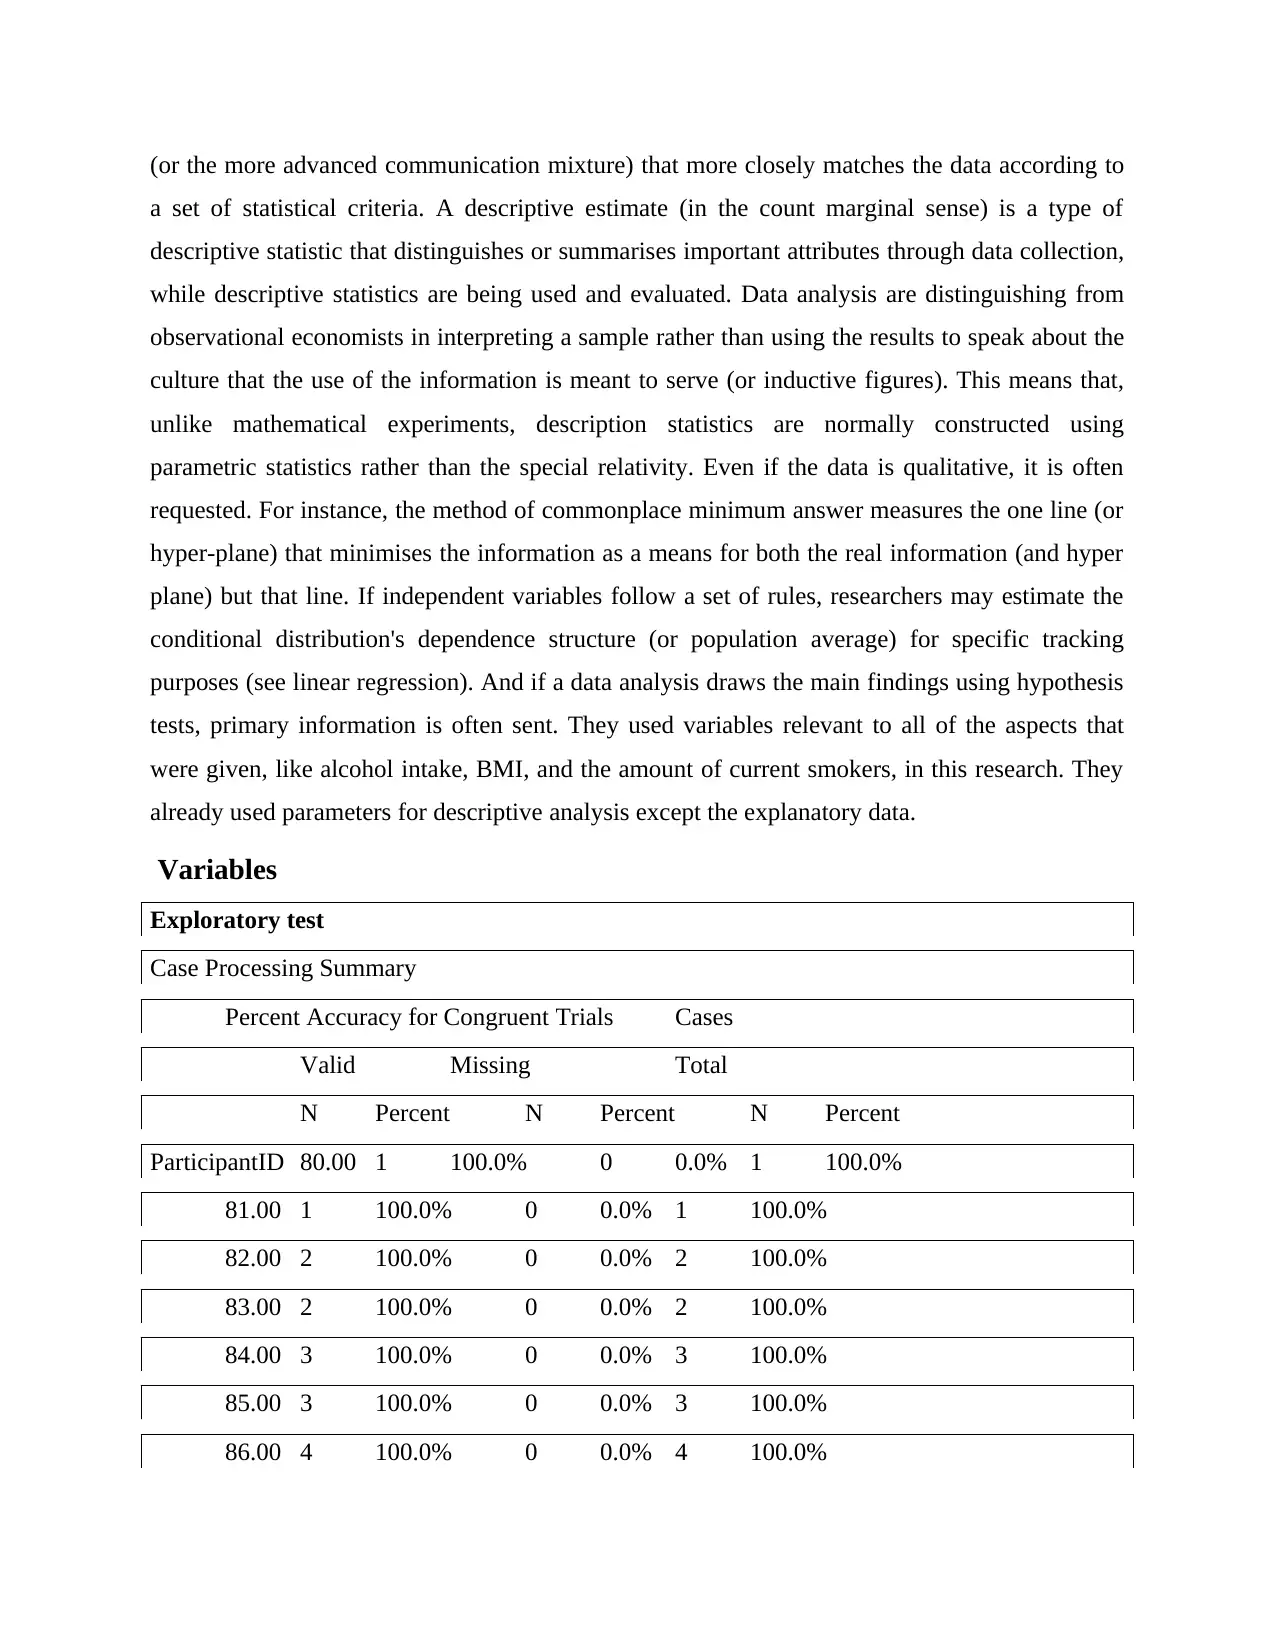
Variables
Exploratory test
Case Processing Summary
Percent Accuracy for Congruent Trials Cases
Valid Missing Total
N Percent N Percent N Percent
ParticipantID 80.00 1 100.0% 0 0.0% 1 100.0%
81.00 1 100.0% 0 0.0% 1 100.0%
82.00 2 100.0% 0 0.0% 2 100.0%
83.00 2 100.0% 0 0.0% 2 100.0%
84.00 3 100.0% 0 0.0% 3 100.0%
85.00 3 100.0% 0 0.0% 3 100.0%
86.00 4 100.0% 0 0.0% 4 100.0%
a set of statistical criteria. A descriptive estimate (in the count marginal sense) is a type of
descriptive statistic that distinguishes or summarises important attributes through data collection,
while descriptive statistics are being used and evaluated. Data analysis are distinguishing from
observational economists in interpreting a sample rather than using the results to speak about the
culture that the use of the information is meant to serve (or inductive figures). This means that,
unlike mathematical experiments, description statistics are normally constructed using
parametric statistics rather than the special relativity. Even if the data is qualitative, it is often
requested. For instance, the method of commonplace minimum answer measures the one line (or
hyper-plane) that minimises the information as a means for both the real information (and hyper
plane) but that line. If independent variables follow a set of rules, researchers may estimate the
conditional distribution's dependence structure (or population average) for specific tracking
purposes (see linear regression). And if a data analysis draws the main findings using hypothesis
tests, primary information is often sent. They used variables relevant to all of the aspects that
were given, like alcohol intake, BMI, and the amount of current smokers, in this research. They
already used parameters for descriptive analysis except the explanatory data.
Variables
Exploratory test
Case Processing Summary
Percent Accuracy for Congruent Trials Cases
Valid Missing Total
N Percent N Percent N Percent
ParticipantID 80.00 1 100.0% 0 0.0% 1 100.0%
81.00 1 100.0% 0 0.0% 1 100.0%
82.00 2 100.0% 0 0.0% 2 100.0%
83.00 2 100.0% 0 0.0% 2 100.0%
84.00 3 100.0% 0 0.0% 3 100.0%
85.00 3 100.0% 0 0.0% 3 100.0%
86.00 4 100.0% 0 0.0% 4 100.0%
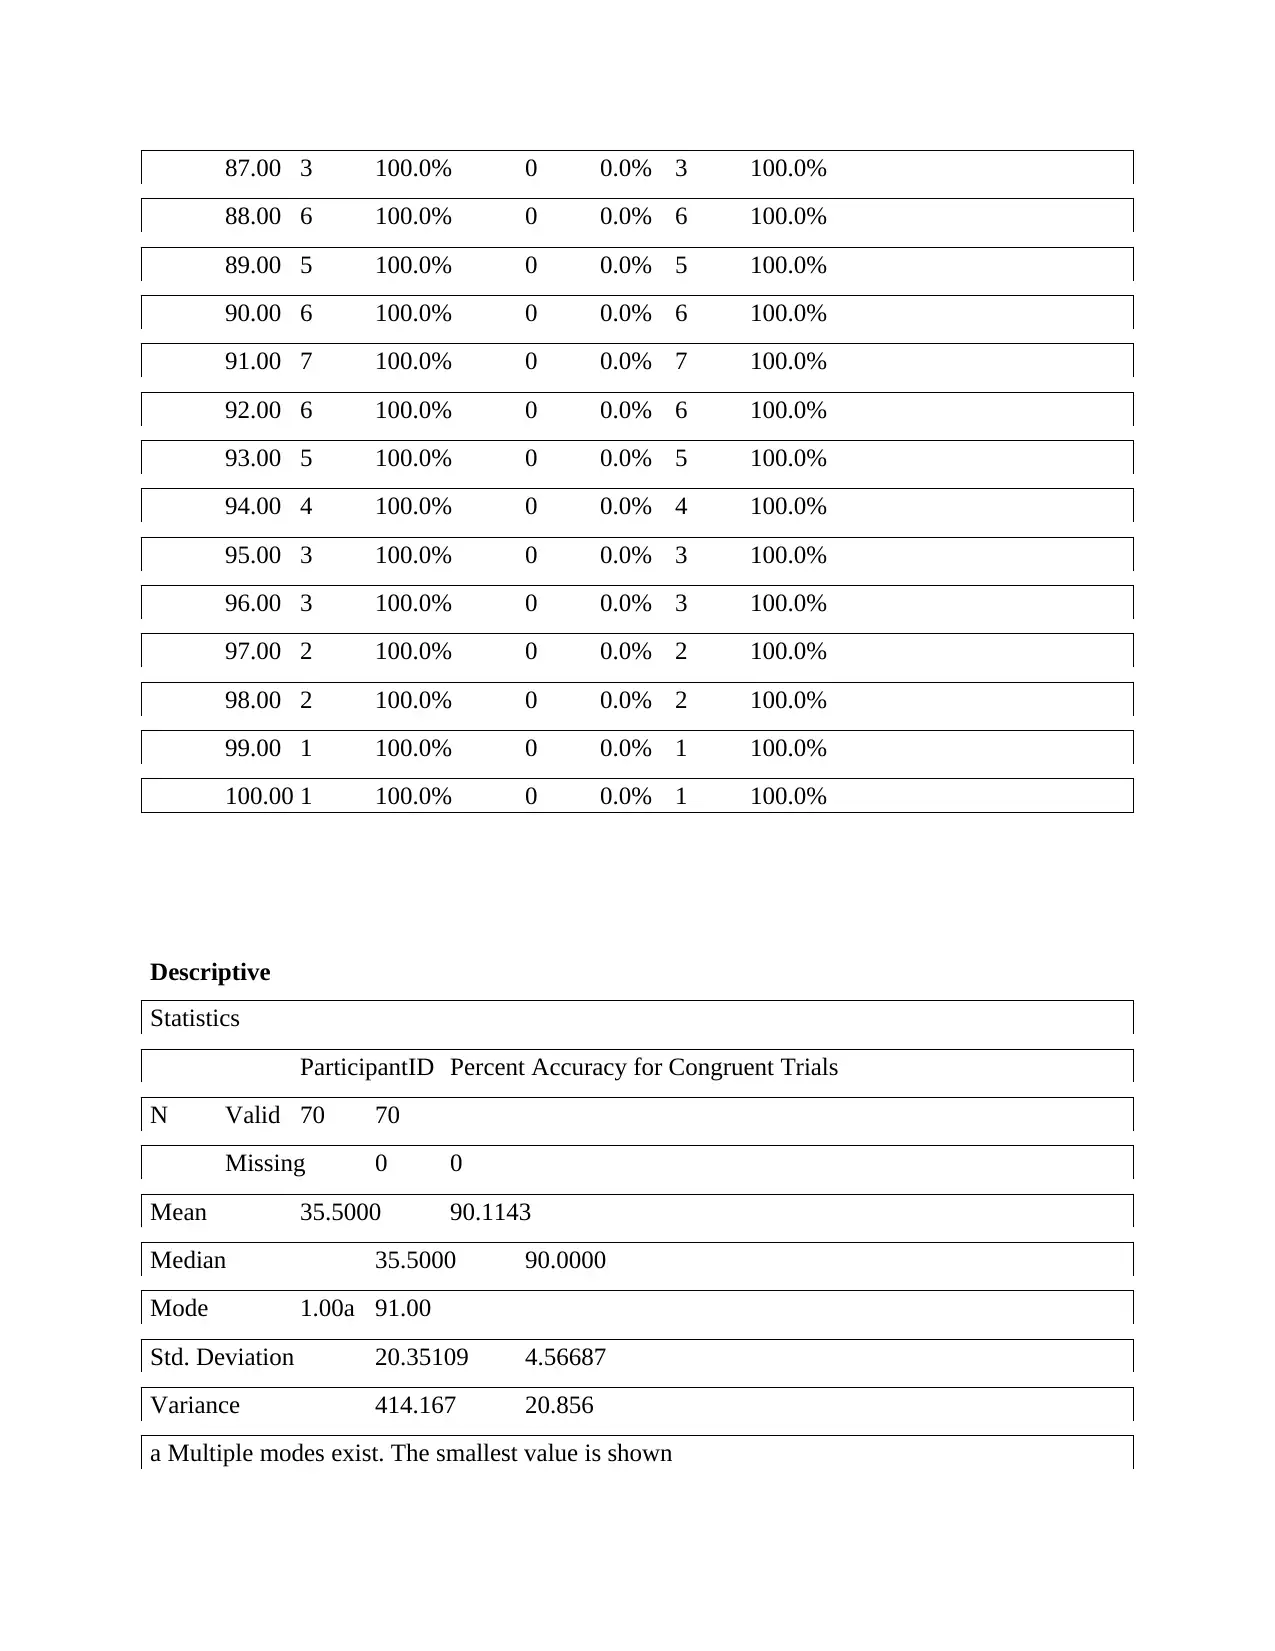
87.00 3 100.0% 0 0.0% 3 100.0%
88.00 6 100.0% 0 0.0% 6 100.0%
89.00 5 100.0% 0 0.0% 5 100.0%
90.00 6 100.0% 0 0.0% 6 100.0%
91.00 7 100.0% 0 0.0% 7 100.0%
92.00 6 100.0% 0 0.0% 6 100.0%
93.00 5 100.0% 0 0.0% 5 100.0%
94.00 4 100.0% 0 0.0% 4 100.0%
95.00 3 100.0% 0 0.0% 3 100.0%
96.00 3 100.0% 0 0.0% 3 100.0%
97.00 2 100.0% 0 0.0% 2 100.0%
98.00 2 100.0% 0 0.0% 2 100.0%
99.00 1 100.0% 0 0.0% 1 100.0%
100.00 1 100.0% 0 0.0% 1 100.0%
Descriptive
Statistics
ParticipantID Percent Accuracy for Congruent Trials
N Valid 70 70
Missing 0 0
Mean 35.5000 90.1143
Median 35.5000 90.0000
Mode 1.00a 91.00
Std. Deviation 20.35109 4.56687
Variance 414.167 20.856
a Multiple modes exist. The smallest value is shown
⊘ This is a preview!⊘
Do you want full access?
Subscribe today to unlock all pages.
Trusted by 1+ million students worldwide
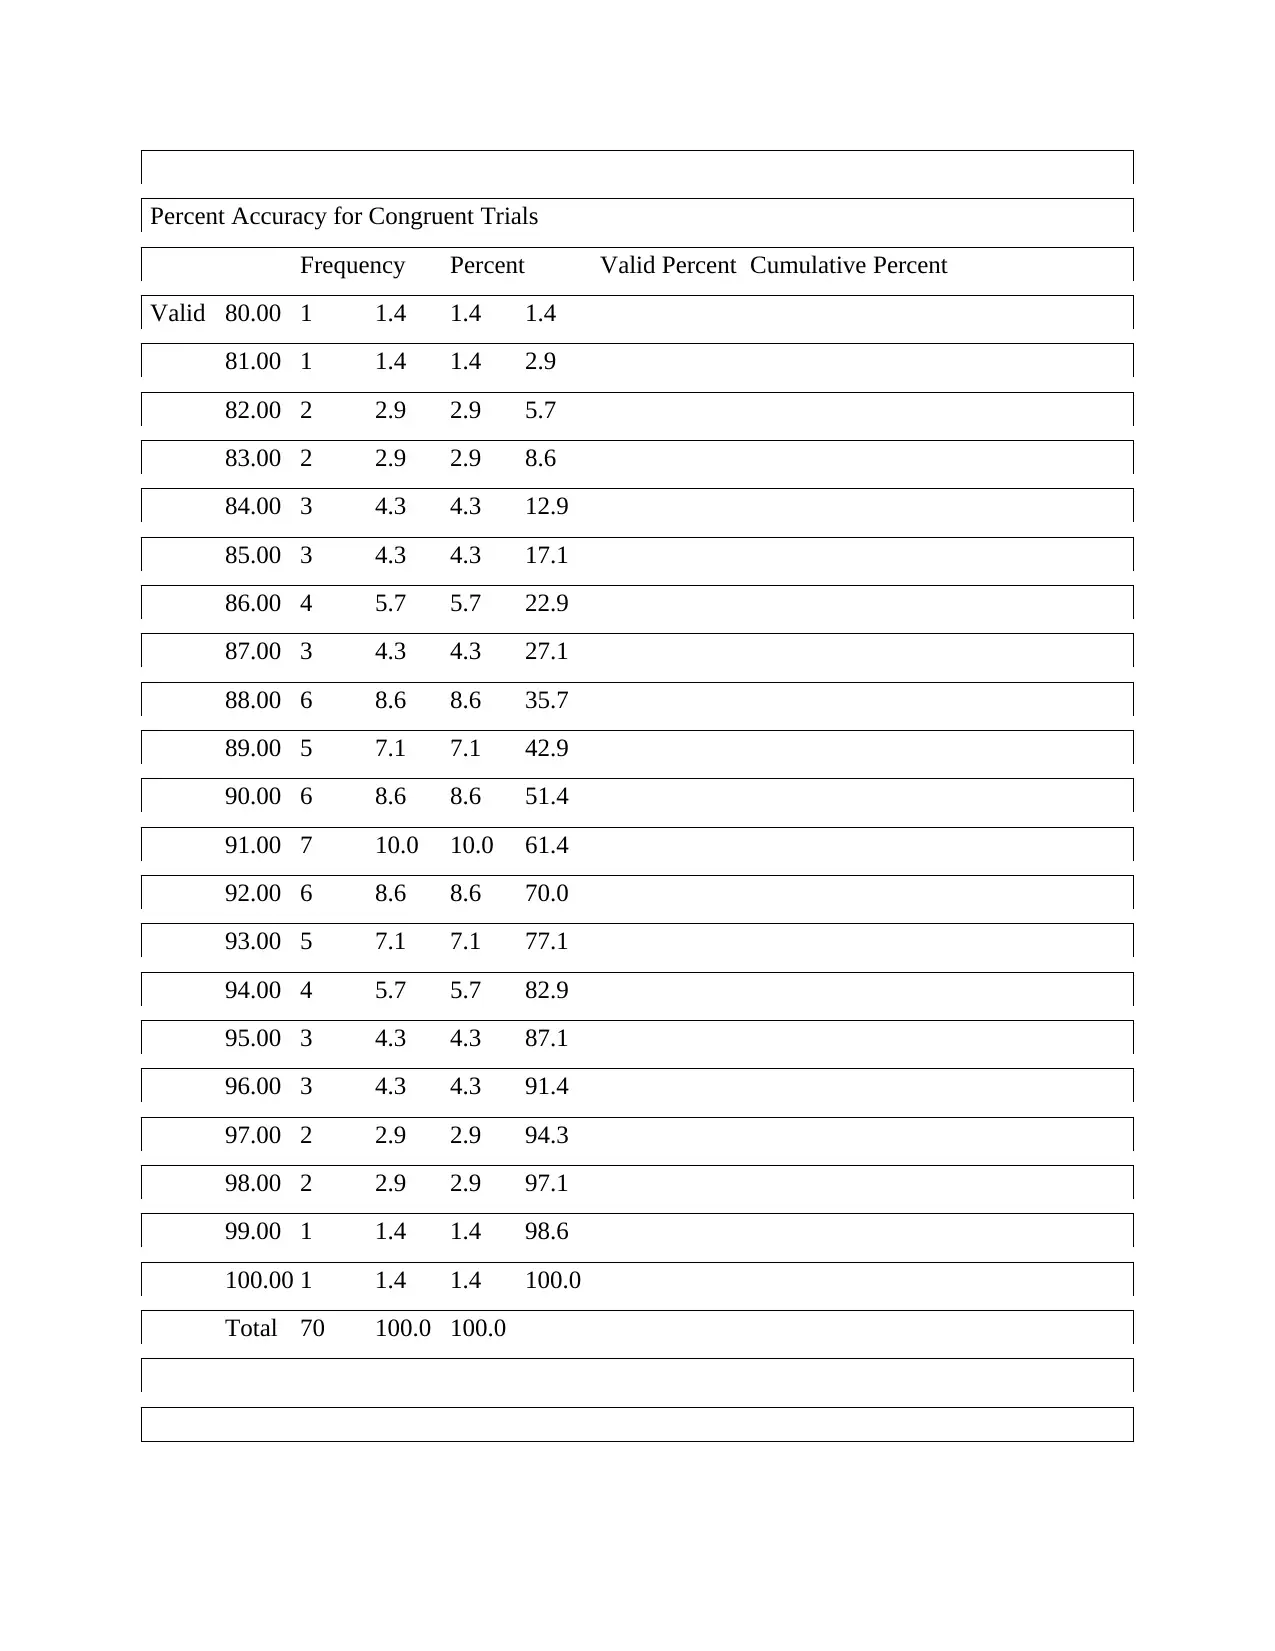
Percent Accuracy for Congruent Trials
Frequency Percent Valid Percent Cumulative Percent
Valid 80.00 1 1.4 1.4 1.4
81.00 1 1.4 1.4 2.9
82.00 2 2.9 2.9 5.7
83.00 2 2.9 2.9 8.6
84.00 3 4.3 4.3 12.9
85.00 3 4.3 4.3 17.1
86.00 4 5.7 5.7 22.9
87.00 3 4.3 4.3 27.1
88.00 6 8.6 8.6 35.7
89.00 5 7.1 7.1 42.9
90.00 6 8.6 8.6 51.4
91.00 7 10.0 10.0 61.4
92.00 6 8.6 8.6 70.0
93.00 5 7.1 7.1 77.1
94.00 4 5.7 5.7 82.9
95.00 3 4.3 4.3 87.1
96.00 3 4.3 4.3 91.4
97.00 2 2.9 2.9 94.3
98.00 2 2.9 2.9 97.1
99.00 1 1.4 1.4 98.6
100.00 1 1.4 1.4 100.0
Total 70 100.0 100.0
Paraphrase This Document
Need a fresh take? Get an instant paraphrase of this document with our AI Paraphraser
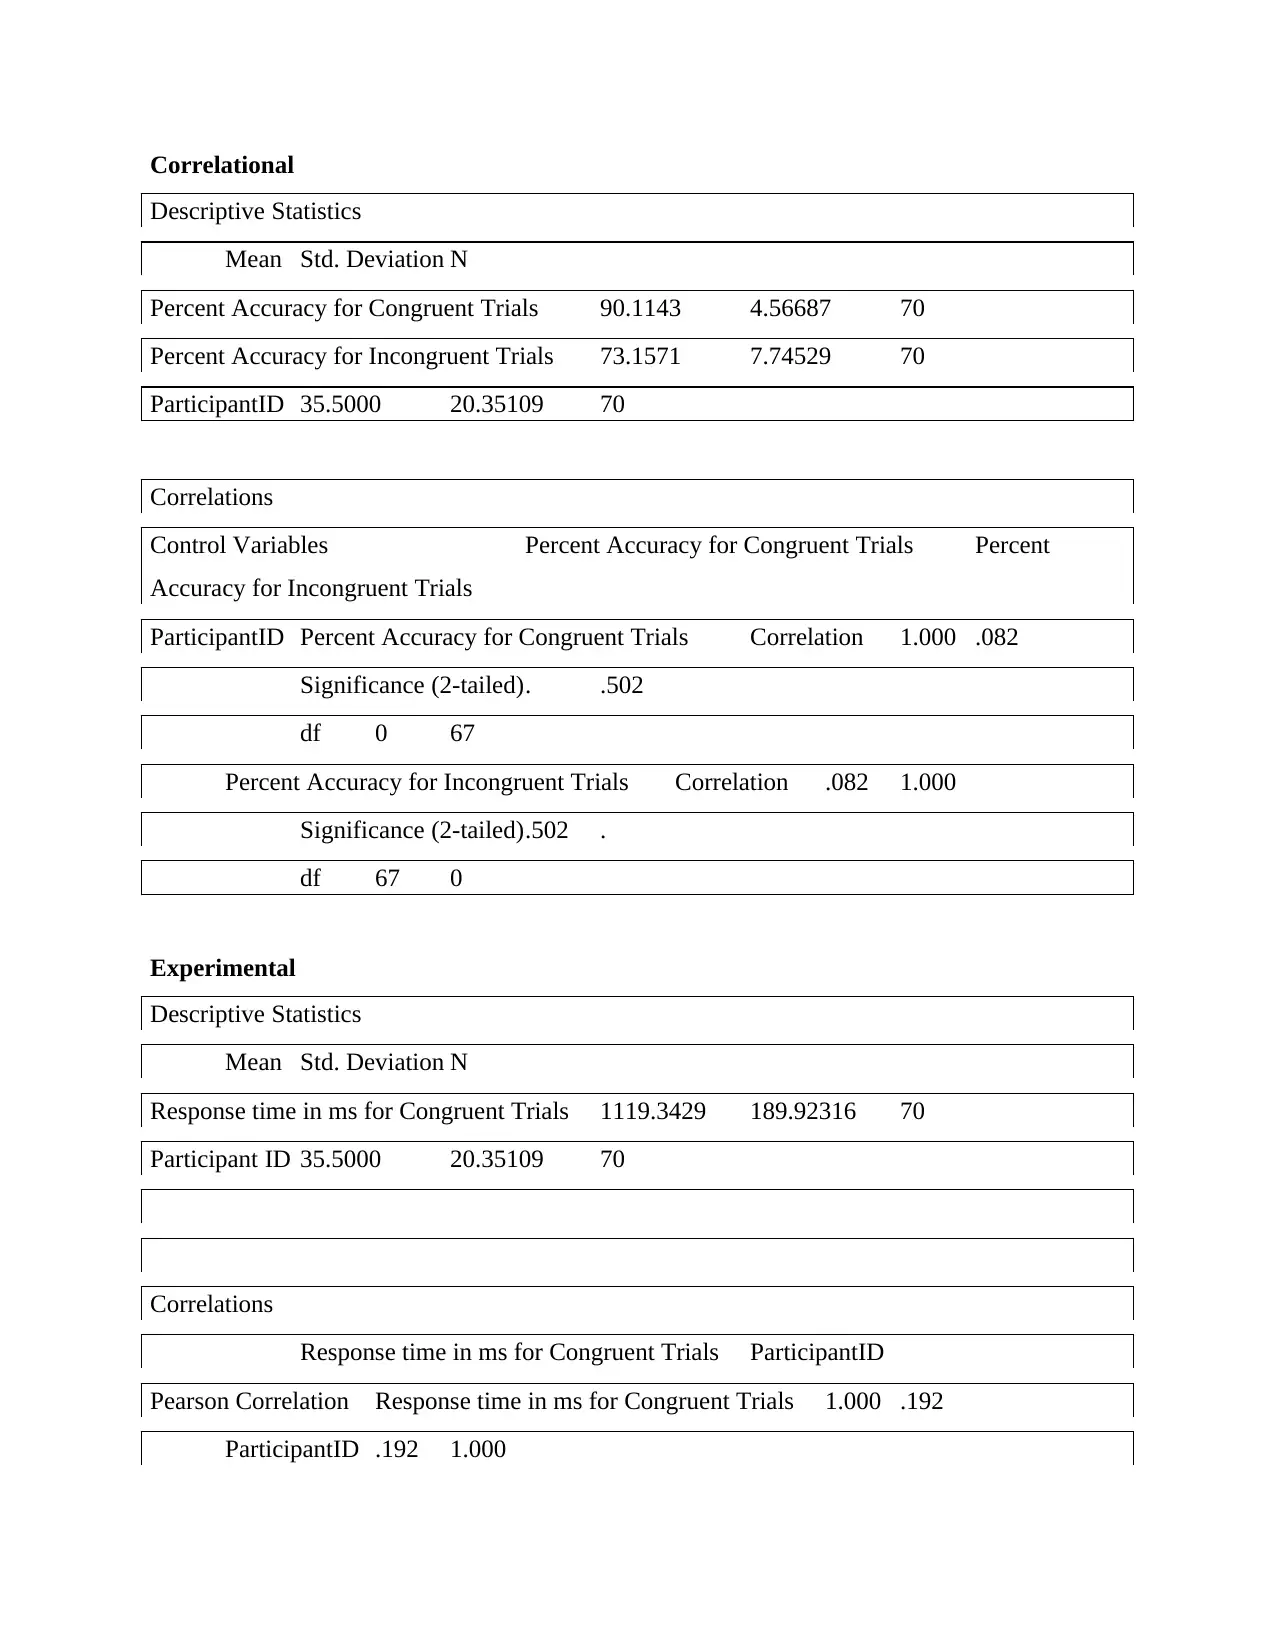
Correlational
Descriptive Statistics
Mean Std. Deviation N
Percent Accuracy for Congruent Trials 90.1143 4.56687 70
Percent Accuracy for Incongruent Trials 73.1571 7.74529 70
ParticipantID 35.5000 20.35109 70
Correlations
Control Variables Percent Accuracy for Congruent Trials Percent
Accuracy for Incongruent Trials
ParticipantID Percent Accuracy for Congruent Trials Correlation 1.000 .082
Significance (2-tailed). .502
df 0 67
Percent Accuracy for Incongruent Trials Correlation .082 1.000
Significance (2-tailed).502 .
df 67 0
Experimental
Descriptive Statistics
Mean Std. Deviation N
Response time in ms for Congruent Trials 1119.3429 189.92316 70
Participant ID 35.5000 20.35109 70
Correlations
Response time in ms for Congruent Trials ParticipantID
Pearson Correlation Response time in ms for Congruent Trials 1.000 .192
ParticipantID .192 1.000
Descriptive Statistics
Mean Std. Deviation N
Percent Accuracy for Congruent Trials 90.1143 4.56687 70
Percent Accuracy for Incongruent Trials 73.1571 7.74529 70
ParticipantID 35.5000 20.35109 70
Correlations
Control Variables Percent Accuracy for Congruent Trials Percent
Accuracy for Incongruent Trials
ParticipantID Percent Accuracy for Congruent Trials Correlation 1.000 .082
Significance (2-tailed). .502
df 0 67
Percent Accuracy for Incongruent Trials Correlation .082 1.000
Significance (2-tailed).502 .
df 67 0
Experimental
Descriptive Statistics
Mean Std. Deviation N
Response time in ms for Congruent Trials 1119.3429 189.92316 70
Participant ID 35.5000 20.35109 70
Correlations
Response time in ms for Congruent Trials ParticipantID
Pearson Correlation Response time in ms for Congruent Trials 1.000 .192
ParticipantID .192 1.000
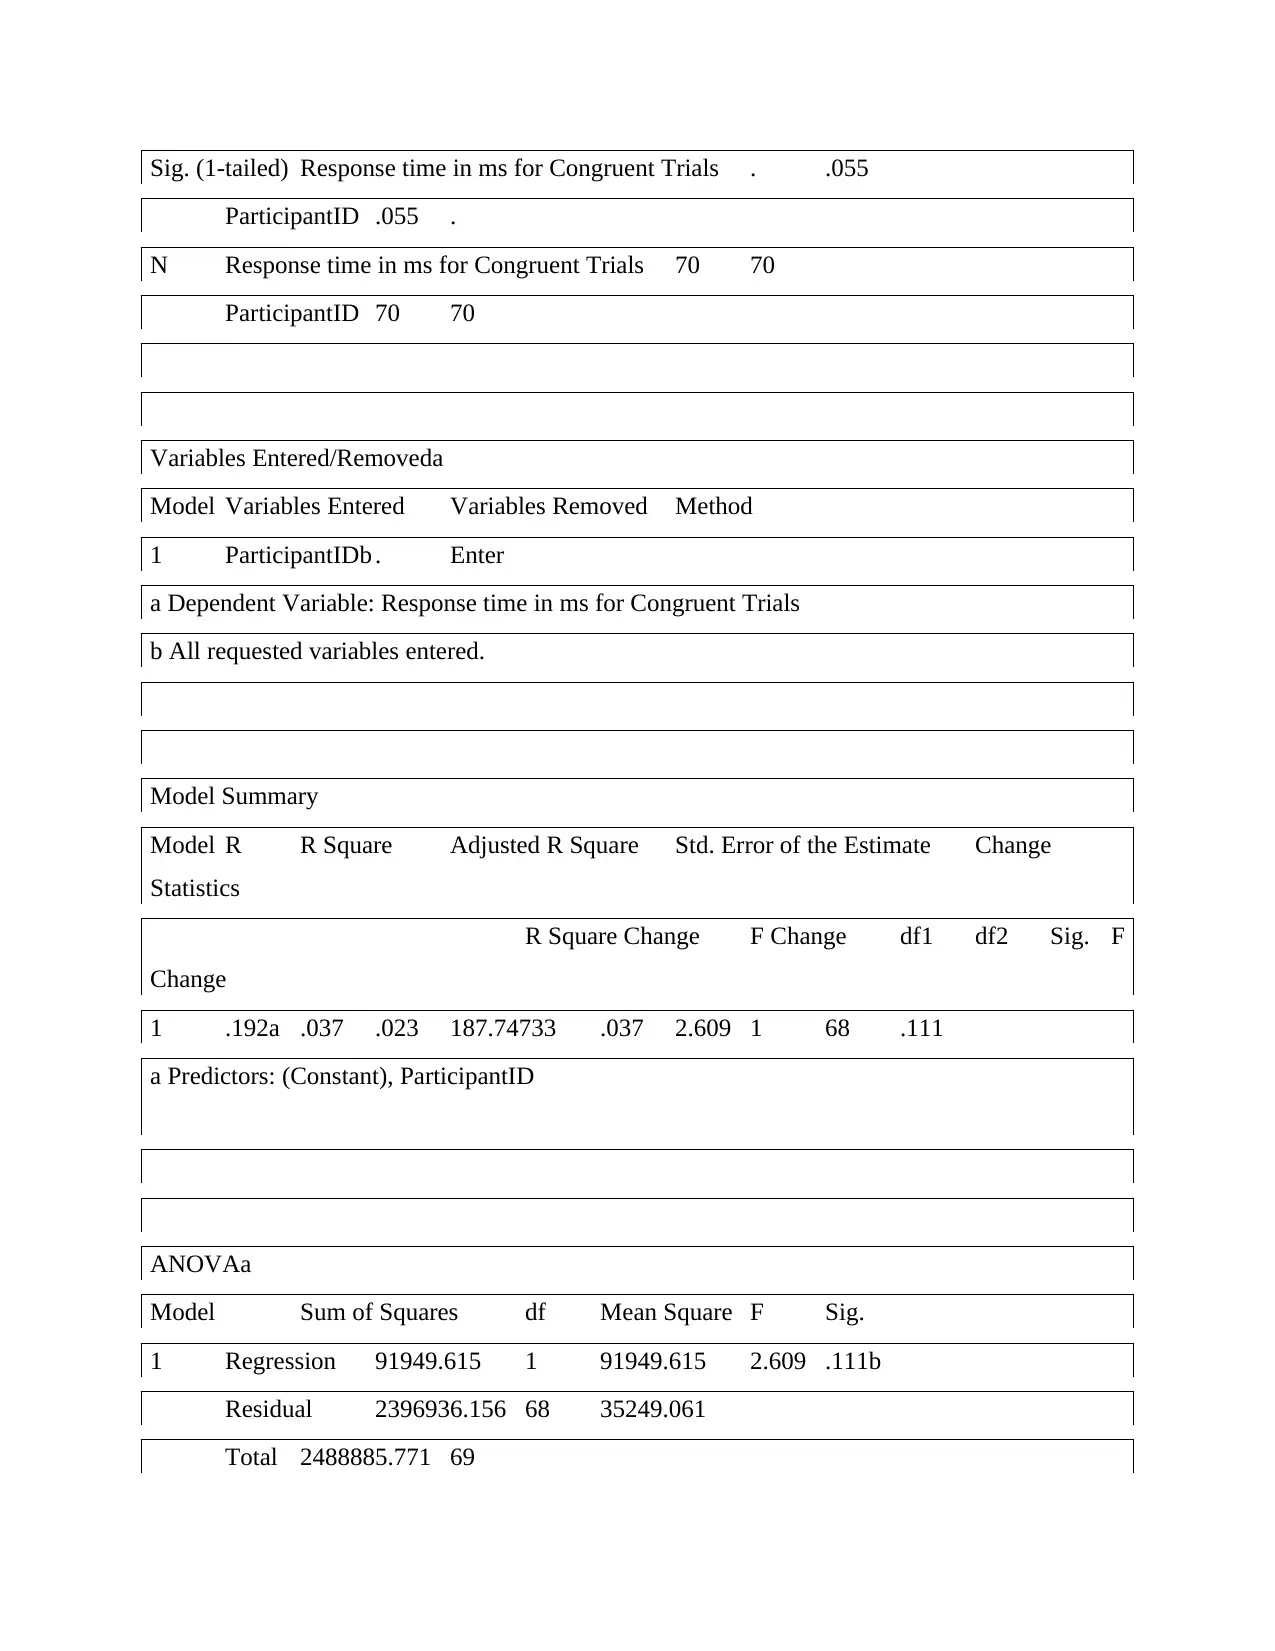
Sig. (1-tailed) Response time in ms for Congruent Trials . .055
ParticipantID .055 .
N Response time in ms for Congruent Trials 70 70
ParticipantID 70 70
Variables Entered/Removeda
Model Variables Entered Variables Removed Method
1 ParticipantIDb . Enter
a Dependent Variable: Response time in ms for Congruent Trials
b All requested variables entered.
Model Summary
Model R R Square Adjusted R Square Std. Error of the Estimate Change
Statistics
R Square Change F Change df1 df2 Sig. F
Change
1 .192a .037 .023 187.74733 .037 2.609 1 68 .111
a Predictors: (Constant), ParticipantID
ANOVAa
Model Sum of Squares df Mean Square F Sig.
1 Regression 91949.615 1 91949.615 2.609 .111b
Residual 2396936.156 68 35249.061
Total 2488885.771 69
⊘ This is a preview!⊘
Do you want full access?
Subscribe today to unlock all pages.
Trusted by 1+ million students worldwide
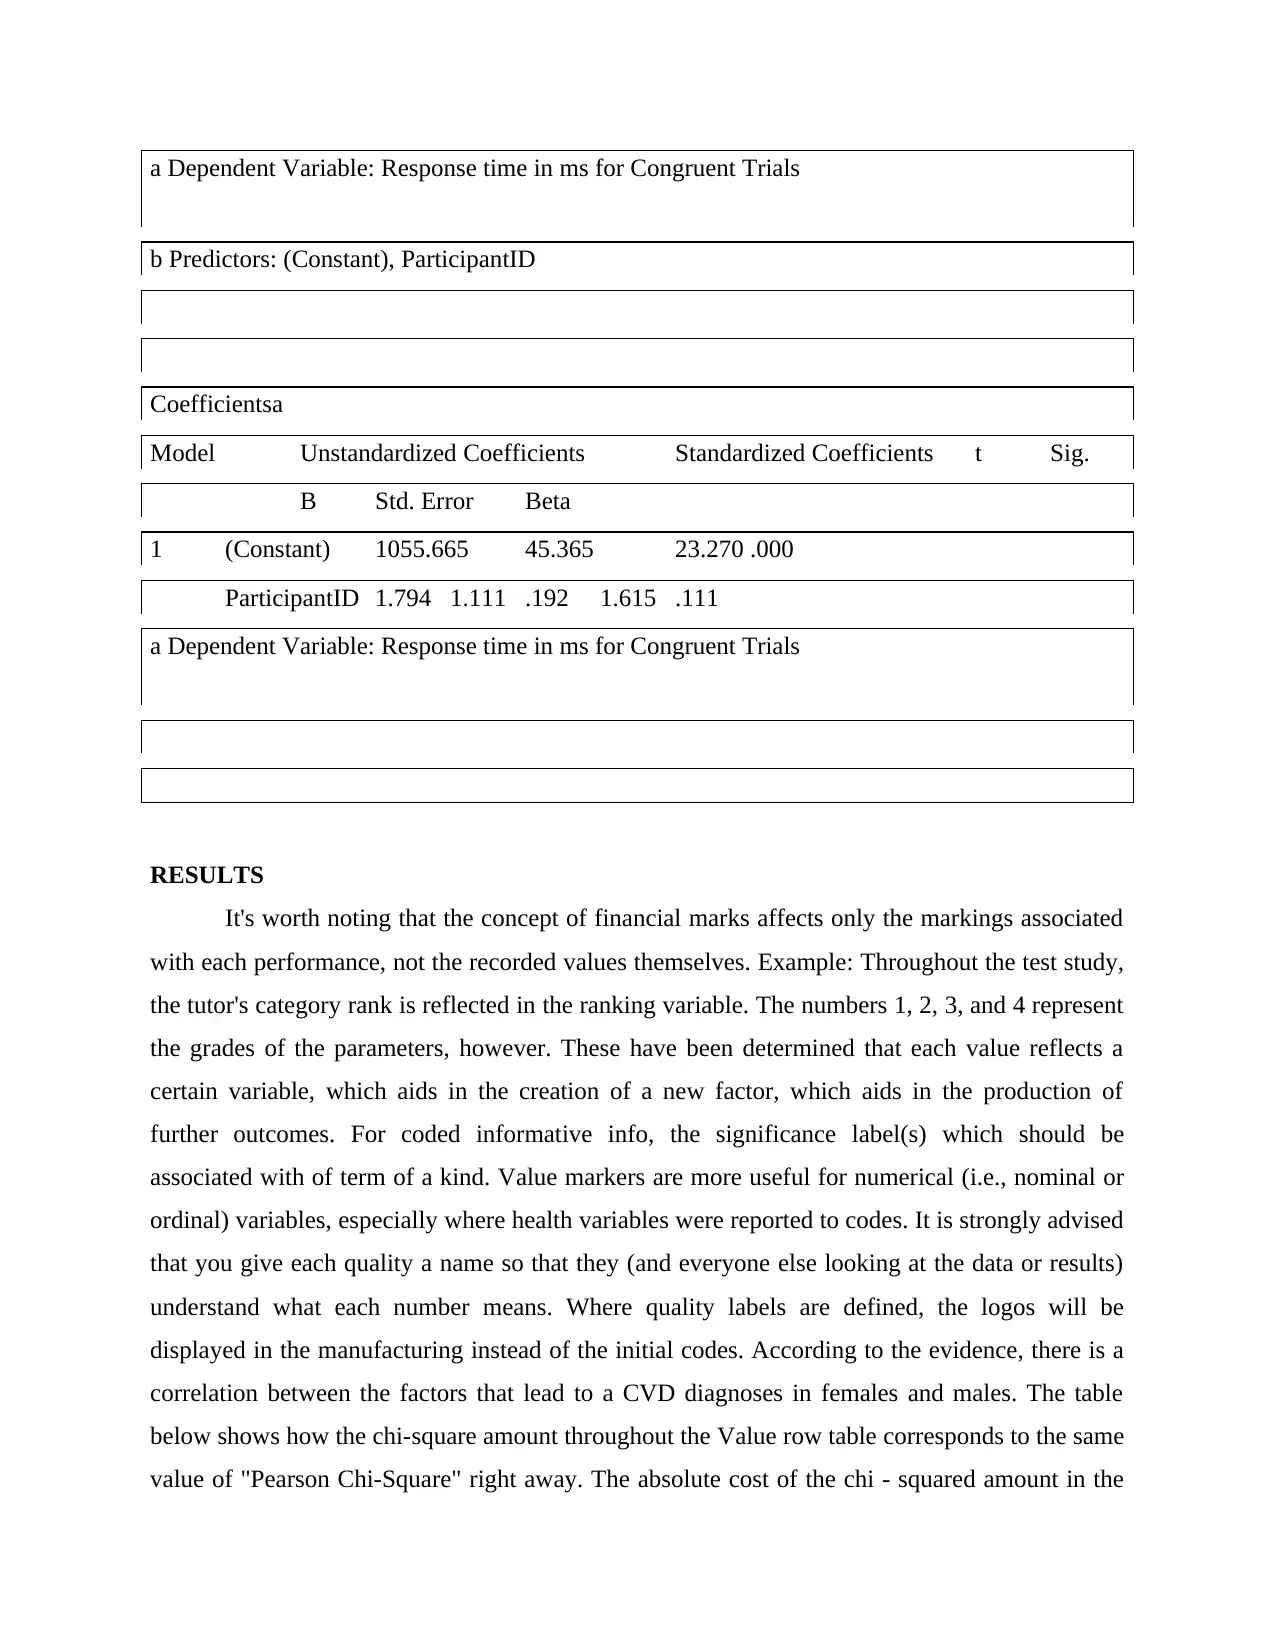
a Dependent Variable: Response time in ms for Congruent Trials
b Predictors: (Constant), ParticipantID
Coefficientsa
Model Unstandardized Coefficients Standardized Coefficients t Sig.
B Std. Error Beta
1 (Constant) 1055.665 45.365 23.270 .000
ParticipantID 1.794 1.111 .192 1.615 .111
a Dependent Variable: Response time in ms for Congruent Trials
RESULTS
It's worth noting that the concept of financial marks affects only the markings associated
with each performance, not the recorded values themselves. Example: Throughout the test study,
the tutor's category rank is reflected in the ranking variable. The numbers 1, 2, 3, and 4 represent
the grades of the parameters, however. These have been determined that each value reflects a
certain variable, which aids in the creation of a new factor, which aids in the production of
further outcomes. For coded informative info, the significance label(s) which should be
associated with of term of a kind. Value markers are more useful for numerical (i.e., nominal or
ordinal) variables, especially where health variables were reported to codes. It is strongly advised
that you give each quality a name so that they (and everyone else looking at the data or results)
understand what each number means. Where quality labels are defined, the logos will be
displayed in the manufacturing instead of the initial codes. According to the evidence, there is a
correlation between the factors that lead to a CVD diagnoses in females and males. The table
below shows how the chi-square amount throughout the Value row table corresponds to the same
value of "Pearson Chi-Square" right away. The absolute cost of the chi - squared amount in the
Paraphrase This Document
Need a fresh take? Get an instant paraphrase of this document with our AI Paraphraser
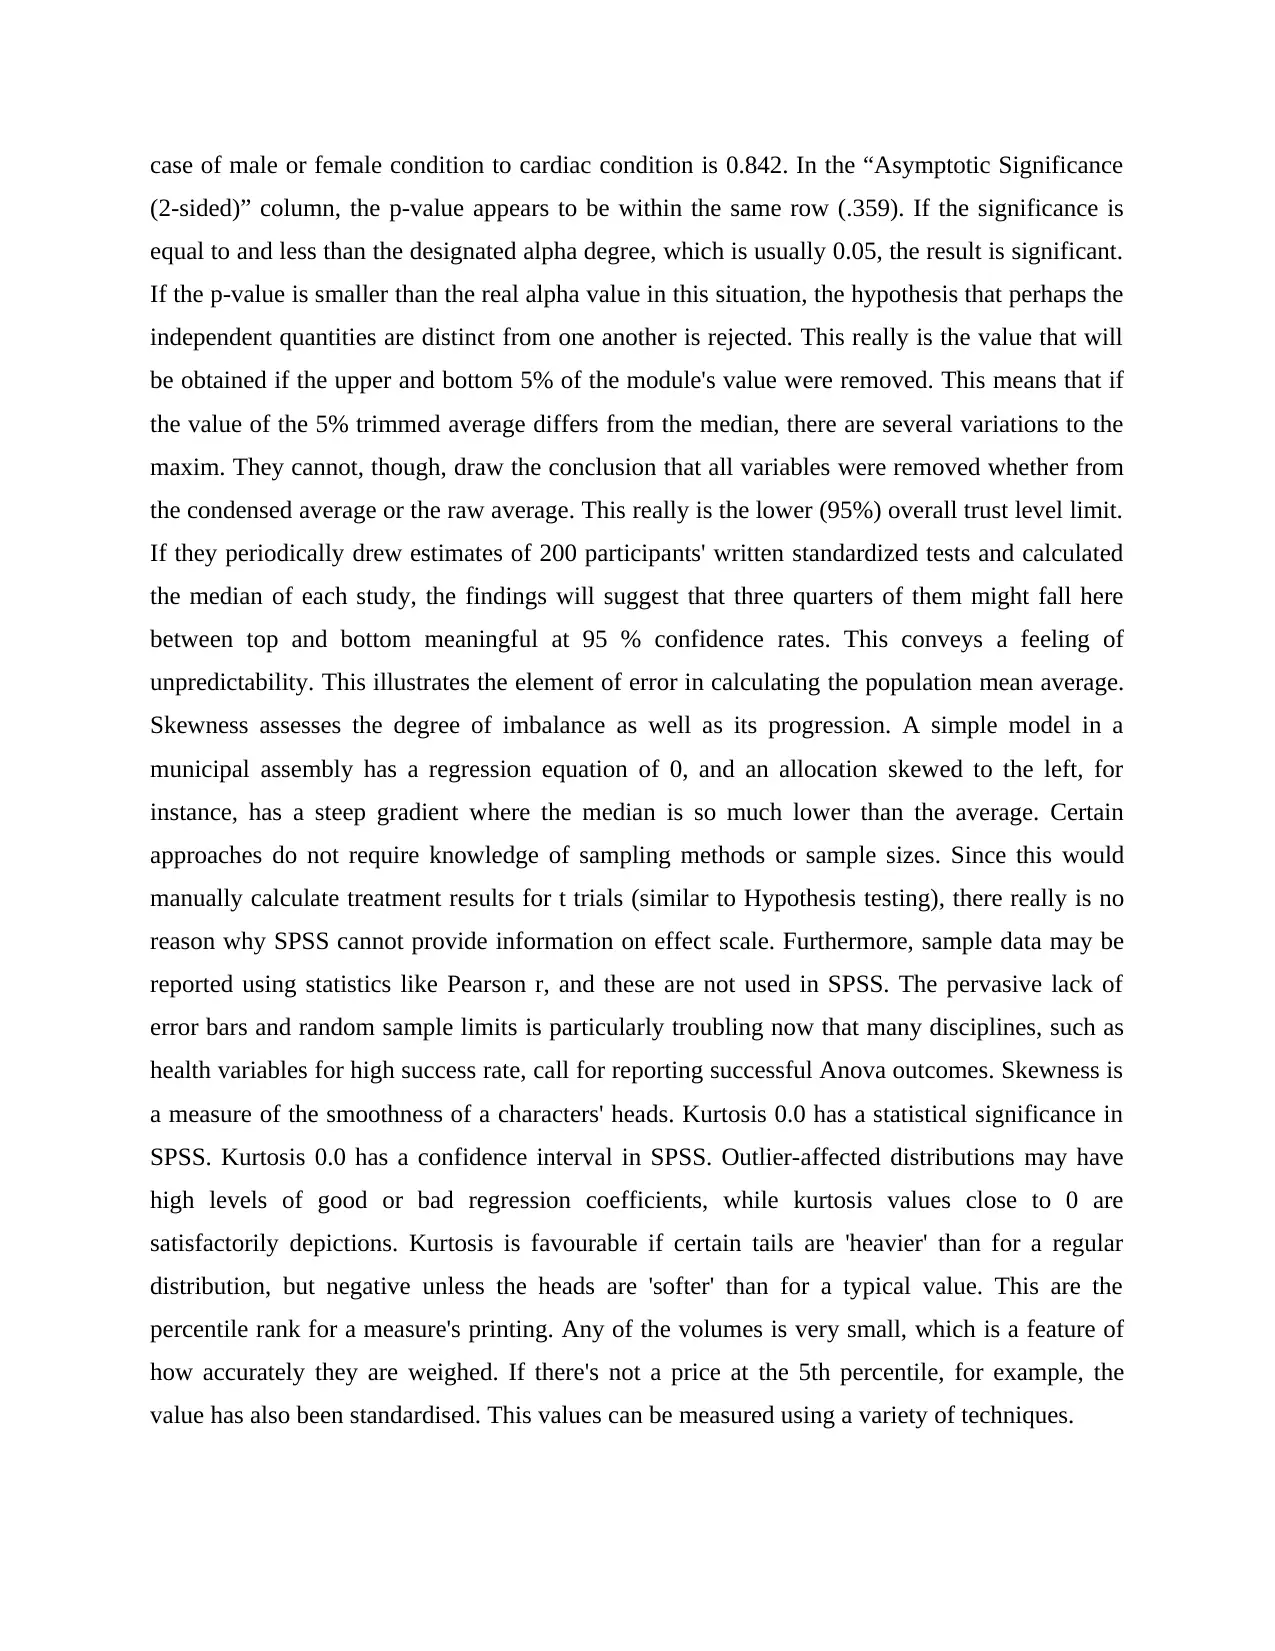
case of male or female condition to cardiac condition is 0.842. In the “Asymptotic Significance
(2-sided)” column, the p-value appears to be within the same row (.359). If the significance is
equal to and less than the designated alpha degree, which is usually 0.05, the result is significant.
If the p-value is smaller than the real alpha value in this situation, the hypothesis that perhaps the
independent quantities are distinct from one another is rejected. This really is the value that will
be obtained if the upper and bottom 5% of the module's value were removed. This means that if
the value of the 5% trimmed average differs from the median, there are several variations to the
maxim. They cannot, though, draw the conclusion that all variables were removed whether from
the condensed average or the raw average. This really is the lower (95%) overall trust level limit.
If they periodically drew estimates of 200 participants' written standardized tests and calculated
the median of each study, the findings will suggest that three quarters of them might fall here
between top and bottom meaningful at 95 % confidence rates. This conveys a feeling of
unpredictability. This illustrates the element of error in calculating the population mean average.
Skewness assesses the degree of imbalance as well as its progression. A simple model in a
municipal assembly has a regression equation of 0, and an allocation skewed to the left, for
instance, has a steep gradient where the median is so much lower than the average. Certain
approaches do not require knowledge of sampling methods or sample sizes. Since this would
manually calculate treatment results for t trials (similar to Hypothesis testing), there really is no
reason why SPSS cannot provide information on effect scale. Furthermore, sample data may be
reported using statistics like Pearson r, and these are not used in SPSS. The pervasive lack of
error bars and random sample limits is particularly troubling now that many disciplines, such as
health variables for high success rate, call for reporting successful Anova outcomes. Skewness is
a measure of the smoothness of a characters' heads. Kurtosis 0.0 has a statistical significance in
SPSS. Kurtosis 0.0 has a confidence interval in SPSS. Outlier-affected distributions may have
high levels of good or bad regression coefficients, while kurtosis values close to 0 are
satisfactorily depictions. Kurtosis is favourable if certain tails are 'heavier' than for a regular
distribution, but negative unless the heads are 'softer' than for a typical value. This are the
percentile rank for a measure's printing. Any of the volumes is very small, which is a feature of
how accurately they are weighed. If there's not a price at the 5th percentile, for example, the
value has also been standardised. This values can be measured using a variety of techniques.
CONCLUSION
Almost all of the responses were right in the fields of scientific analysis and business
knowledge, according to the report's conclusion. Since they were more resistant in purchasing
optional measures mostly on calculated variables of heath, large firms may be more focused by
consumer segments, when all the parameters are out: large corporations have enough resources
to sponsor research projects, the results found are more valuable in optimising their corporate
practises, and the key motivating are much more valuable in optimising their business behavior,
until they were most resistant in purchasing up-and-down interventions mostly on variables
measured of heath. The second way of contacting a research firm is to "do upstream stuff with
particular project teams (e.g. internal consultancy, external contractor data interface)."
⊘ This is a preview!⊘
Do you want full access?
Subscribe today to unlock all pages.
Trusted by 1+ million students worldwide
1 out of 13
Related Documents


Your All-in-One AI-Powered Toolkit for Academic Success.
+13062052269
info@desklib.com
Available 24*7 on WhatsApp / Email
![[object Object]](/_next/static/media/star-bottom.7253800d.svg)
Unlock your academic potential
Copyright © 2020–2026 A2Z Services. All Rights Reserved. Developed and managed by ZUCOL.