SPSS Analysis Report on Internet Gaming Disorder and Health Factors
VerifiedAdded on 2023/01/09
|21
|5359
|47
Report
AI Summary
This report presents an SPSS analysis of a study investigating the relationship between internet gaming disorder (IGD) and various health metrics. The study involved 87 participants and utilized descriptive and inferential statistical methods, including correlation and regression analyses. Descriptive statistics examined demographic information, IGD scores, Brief Symptom Inventory (BSI) scores, mental health (SFmental health), and general health (SFgeneral health). Inferential statistics explored the correlations between IGDTotal and BSI scores, SFmental health, and SFgeneral health, revealing significant relationships. Regression analyses were performed to assess the influence of IGDTotal, age, and gender on BSI, SFmental health, and SFgeneral health. The findings suggest a significant negative correlation between IGD and mental/general health, and implications of the study have been discussed.

SPSS
1
1
Paraphrase This Document
Need a fresh take? Get an instant paraphrase of this document with our AI Paraphraser
Contents
RESULTS........................................................................................................................................3
Descriptive statistics....................................................................................................................3
Inferential statistics......................................................................................................................4
DISCUSSION..................................................................................................................................6
REFERENCES..............................................................................................................................11
APPENDIX....................................................................................................................................13
1. Descriptive statistics of all the variables...............................................................................13
2. Identification of relationship between IGDTotal and BSI scores using correlation..............17
3. Identification of relationship between IGDTotal and SFmental health using correlation.....17
4. Identification of relationship between IGD and SFgeneral health using correlation............17
5. BSI (dependent variable) x IGDTotal, age, and gender (Independent variable) using
regression...................................................................................................................................18
6. SFmental health (dependent variable) x IGDTotal, age, and gender (Independent variable)
using regression.........................................................................................................................18
7. SFgeneral health (dependent variable) x IGDTotal, age, and gender (Independent variable)
using regression.........................................................................................................................19
2
RESULTS
Descriptive statistics
The statistical data which has been collected from 87 participants is divided into certain
categories, these categories include demographic information, Internet Gaming Disorder
information, Brief Symptom Inventory information, mental health information and general health
information. Each of these categories have multiple variables which are required to be analysed
using descriptive statistics. In order to better conclude descriptive, a variable representing each
category is selected for descriptive statistics. IGD total for Internet Gaming Disorder, BSI total
for Brief Symptom Inventory information, SFmental health, SFgeneral health, Gender and age
representing demographic information and lastly fplay representing number of hours per week
spend playing videos games. The results of descriptive statistics and relevant graphical charts are
attached in appendix.
The first variable assessed using descriptive statistics using SPSS is age. The age range
selected for the sample was 18 to 63 years. Out of 87 respondents, 5 has not responded to
mention their age due to which age is analysed using 82 frequencies. The mean of this data set is
3
⊘ This is a preview!⊘
Do you want full access?
Subscribe today to unlock all pages.
Trusted by 1+ million students worldwide
observed to be 24.39 which implies average age of respondents is 24 years and it can be also
implied that video games are most famous among people aged 24. The mode of the age variable
is 21 implying maximum number of respondents have their age as 24 and with the help of its
graphical representation, an exact value of 15 has been seen suggesting 15 people among 82 has
their age as 21. The minimum and maximum values of this variable is 18 and 63 representing
range of sample. Another variable representing demographical information of respondents is
gender. By looking at the descriptive statics table in appendix, it has been observed similar to
age 5 respondents has not responded their gender due to which analysis has been made using 82
data points. Mode of this data set is 1 that indicates maximum number of people who
participated in this study are males which suggests that when compared, males are more inclined
to play video games than females.
IGDtotal is the total score of nine items of IGD questionnaire which aims to analyse the
severity of IGD disorder in participants. These scores will vary from 9 representing least severity
to 45 representing most severity. The descriptive analysis represents mean score of 16.36 which
implies the disorder of gaming is not severe in 82 participants. The maximum value of IGDtotal
is 36 denoting that among 82 gamers, there is an individual who is facing moderate severity on
internet gaming disorder. Another variable analysed is BSItotal representing various conditions
in participants including depression, somatization and anxiety. BSItotal has total scores of 18
variables in which 18 value is representing least severity of BSI and 90 representing high
severity. The descriptive statistics attached in appendix is showing mean value of 26.87 implying
that on an average the participant group is not suffering from depression or anxiety. The
maximum value of such dataset is 61 which implies one among 82 participants is close to having
severe depression and anxiety.
SF mental and general health are two more variable selected for analysis using
descriptive statistics. These variables are the total scores of 38 items divided into 8 scales
including physical functioning, social functioning, mental health and more. The data analysis and
graphical representation is showing mean of SF mental health as 330 and SF general health as
352. According to the scale, higher the scores of participants are, higher their mental and general
health is. The minimum of SF mental health and general health is 100 which indicating low
mental and physical health of people due to playing video games.
4
Paraphrase This Document
Need a fresh take? Get an instant paraphrase of this document with our AI Paraphraser
Last variable selected for analysis is fplay that represents the number of hours in a week
that a participant spends playing video games. The mean value of such variable is 10.65 which
suggests that on an average a participant spends 10.65 hours in a week solely playing video
games. The maximum value of such variable is 80 hours implying that among 78 participants,
there are people who play video games for 80 hours in a week which is even more than 11 hours
in a day.
Inferential statistics
Correlation is a statistical measure which helps in measuring the relationship between two
variables along with the strength and nature of the relationship. Using SPSS, relationship among
IGDtotal and other variables is computed.
Relationship between IGDTotal and BSI scores (correlation)
The correlation results for such relationship is attached in Appendix. The correlation
table is presenting the Pearson’s correlation coefficient as .406 which representing a significant
but average relationship between IGDtotal and BSItotal. The correlation test is showing
significant position correlation between the participant’s internet gaming disorder and brief
symptom inventory (Depression, Somatization and Anxiety) (p = .000, two tailed). This
relationship implies that with increasing internet gaming disorder, the condition of experiencing
depression and anxiety also increases in a participant (correlation).
Hence, the hypothesis stating that there is a significant relationship between IGD and BSI
is accepted.
Relationship between IGDTotal and SFmental health (correlation)
Using the tool of correlation, IGDTotal is tested along with SFmental health in order to
identify that whether or not there is a relationship in gaming disorder of an individual and their
mental health. The correlation results of the analysis are attached in appendix which represents
the correlation coefficient as -.46. This coefficient shows a significant relationship between
IGDtotal and SFmental health but the strength of this relationship is average and nature of this
relationship is negative as the correlation coefficient has a negative value.
There was a significant negative correlation between the participant’s IGDtotal scores
and SFmental health scores (p = .000, two tailed), indicating that with greater IGD scores of
individuals, the mental health of individual decreases (correlation).
5
Hence, the hypothesis stating that there is a significant relationship between IGD and
mental health is accepted.
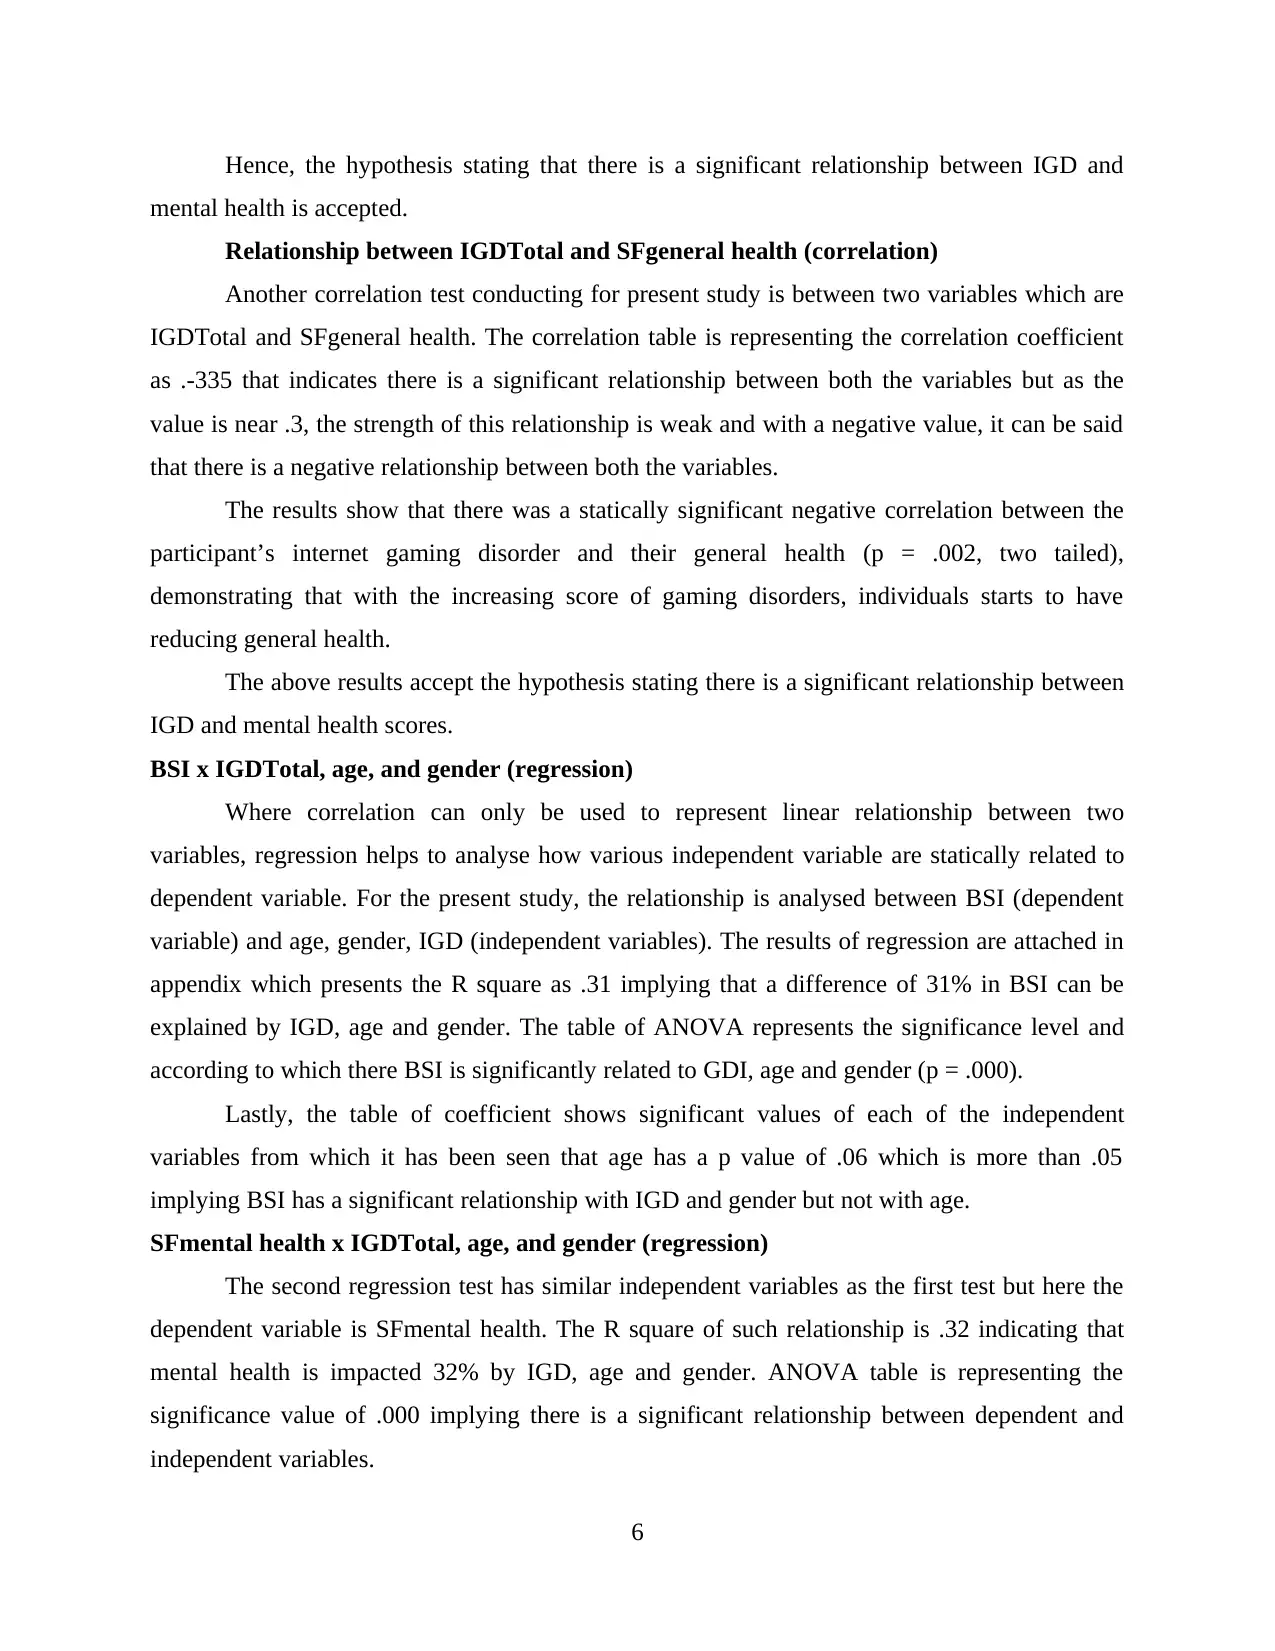
Relationship between IGDTotal and SFgeneral health (correlation)
Another correlation test conducting for present study is between two variables which are
IGDTotal and SFgeneral health. The correlation table is representing the correlation coefficient
as .-335 that indicates there is a significant relationship between both the variables but as the
value is near .3, the strength of this relationship is weak and with a negative value, it can be said
that there is a negative relationship between both the variables.
The results show that there was a statically significant negative correlation between the
participant’s internet gaming disorder and their general health (p = .002, two tailed),
demonstrating that with the increasing score of gaming disorders, individuals starts to have
reducing general health.
The above results accept the hypothesis stating there is a significant relationship between
IGD and mental health scores.
BSI x IGDTotal, age, and gender (regression)
Where correlation can only be used to represent linear relationship between two
variables, regression helps to analyse how various independent variable are statically related to
dependent variable. For the present study, the relationship is analysed between BSI (dependent
variable) and age, gender, IGD (independent variables). The results of regression are attached in
appendix which presents the R square as .31 implying that a difference of 31% in BSI can be
explained by IGD, age and gender. The table of ANOVA represents the significance level and
according to which there BSI is significantly related to GDI, age and gender (p = .000).
Lastly, the table of coefficient shows significant values of each of the independent
variables from which it has been seen that age has a p value of .06 which is more than .05
implying BSI has a significant relationship with IGD and gender but not with age.
SFmental health x IGDTotal, age, and gender (regression)
The second regression test has similar independent variables as the first test but here the
dependent variable is SFmental health. The R square of such relationship is .32 indicating that
mental health is impacted 32% by IGD, age and gender. ANOVA table is representing the
significance value of .000 implying there is a significant relationship between dependent and
independent variables.
6
mental health is accepted.
Relationship between IGDTotal and SFgeneral health (correlation)
Another correlation test conducting for present study is between two variables which are
IGDTotal and SFgeneral health. The correlation table is representing the correlation coefficient
as .-335 that indicates there is a significant relationship between both the variables but as the
value is near .3, the strength of this relationship is weak and with a negative value, it can be said
that there is a negative relationship between both the variables.
The results show that there was a statically significant negative correlation between the
participant’s internet gaming disorder and their general health (p = .002, two tailed),
demonstrating that with the increasing score of gaming disorders, individuals starts to have
reducing general health.
The above results accept the hypothesis stating there is a significant relationship between
IGD and mental health scores.
BSI x IGDTotal, age, and gender (regression)
Where correlation can only be used to represent linear relationship between two
variables, regression helps to analyse how various independent variable are statically related to
dependent variable. For the present study, the relationship is analysed between BSI (dependent
variable) and age, gender, IGD (independent variables). The results of regression are attached in
appendix which presents the R square as .31 implying that a difference of 31% in BSI can be
explained by IGD, age and gender. The table of ANOVA represents the significance level and
according to which there BSI is significantly related to GDI, age and gender (p = .000).
Lastly, the table of coefficient shows significant values of each of the independent
variables from which it has been seen that age has a p value of .06 which is more than .05
implying BSI has a significant relationship with IGD and gender but not with age.
SFmental health x IGDTotal, age, and gender (regression)
The second regression test has similar independent variables as the first test but here the
dependent variable is SFmental health. The R square of such relationship is .32 indicating that
mental health is impacted 32% by IGD, age and gender. ANOVA table is representing the
significance value of .000 implying there is a significant relationship between dependent and
independent variables.
6
⊘ This is a preview!⊘
Do you want full access?
Subscribe today to unlock all pages.
Trusted by 1+ million students worldwide
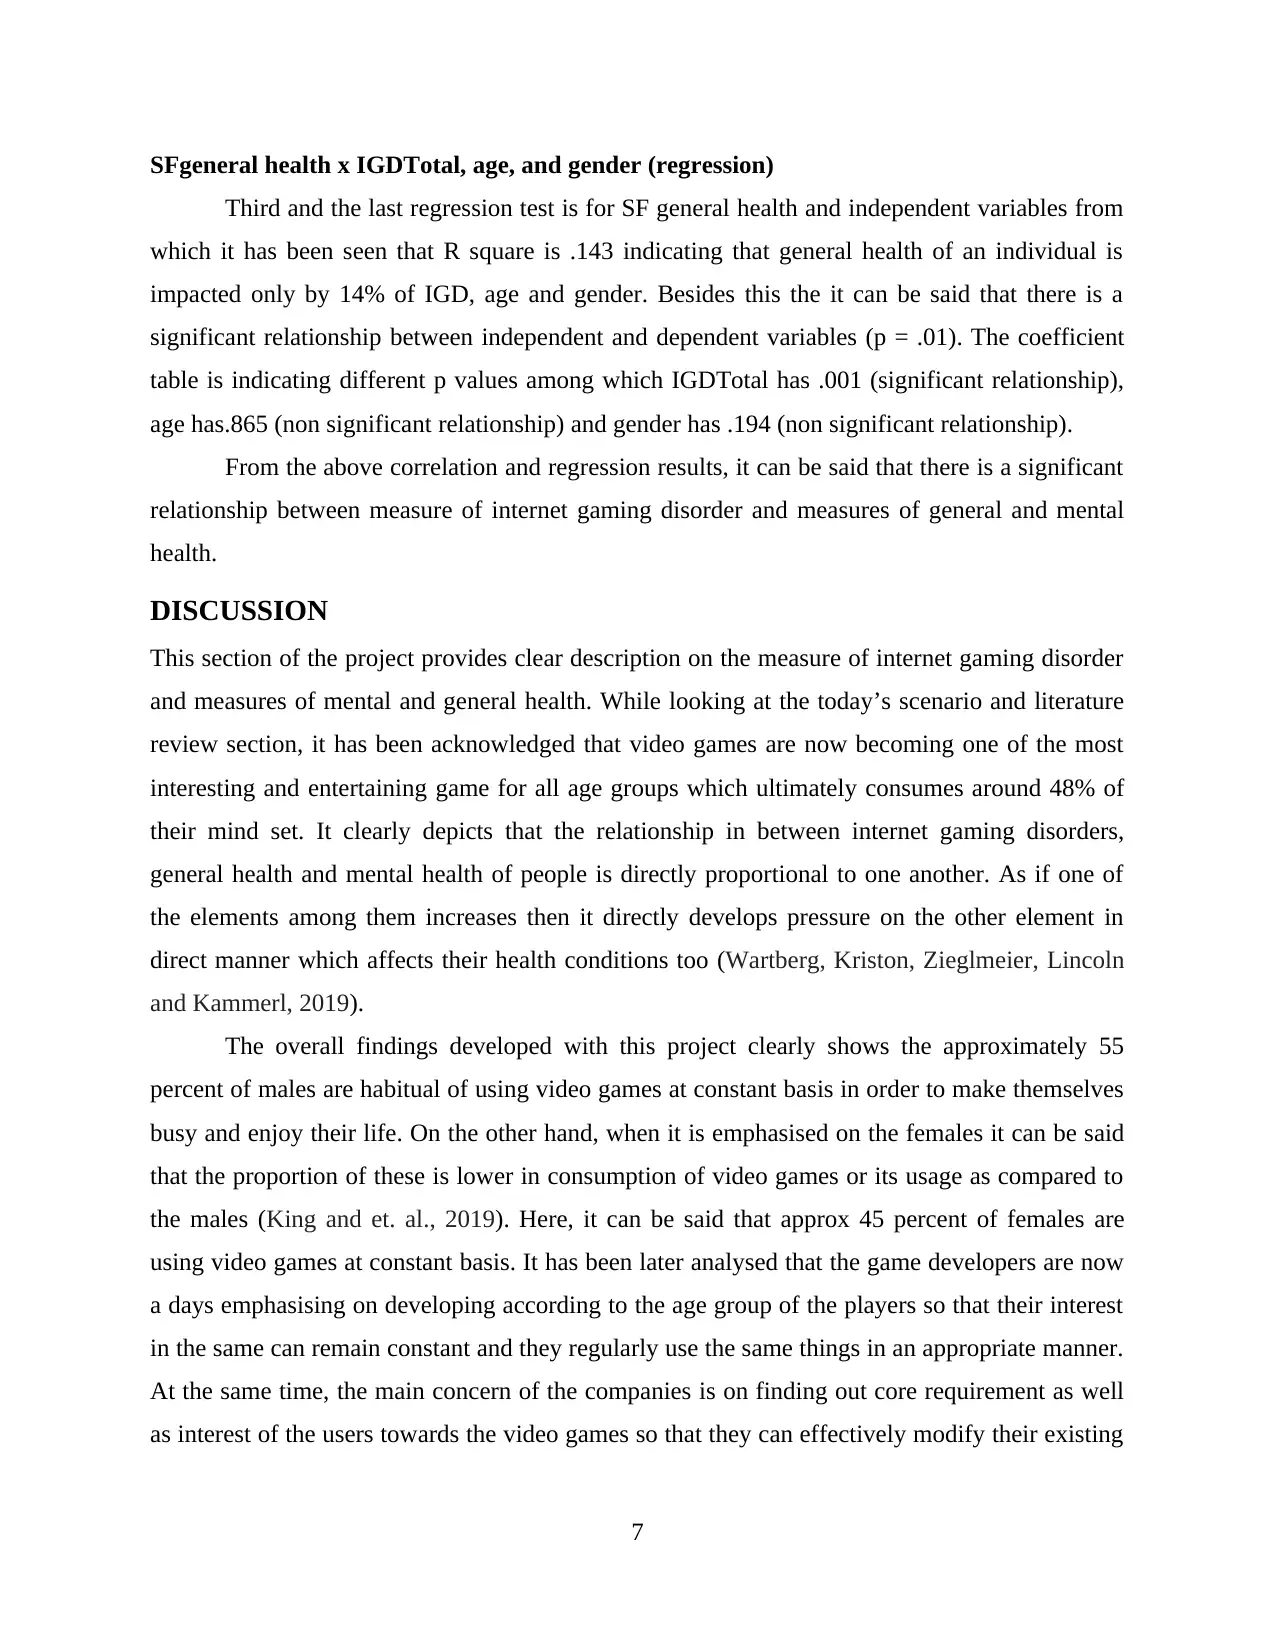
SFgeneral health x IGDTotal, age, and gender (regression)
Third and the last regression test is for SF general health and independent variables from
which it has been seen that R square is .143 indicating that general health of an individual is
impacted only by 14% of IGD, age and gender. Besides this the it can be said that there is a
significant relationship between independent and dependent variables (p = .01). The coefficient
table is indicating different p values among which IGDTotal has .001 (significant relationship),
age has.865 (non significant relationship) and gender has .194 (non significant relationship).
From the above correlation and regression results, it can be said that there is a significant
relationship between measure of internet gaming disorder and measures of general and mental
health.
DISCUSSION
This section of the project provides clear description on the measure of internet gaming disorder
and measures of mental and general health. While looking at the today’s scenario and literature
review section, it has been acknowledged that video games are now becoming one of the most
interesting and entertaining game for all age groups which ultimately consumes around 48% of
their mind set. It clearly depicts that the relationship in between internet gaming disorders,
general health and mental health of people is directly proportional to one another. As if one of
the elements among them increases then it directly develops pressure on the other element in
direct manner which affects their health conditions too (Wartberg, Kriston, Zieglmeier, Lincoln
and Kammerl, 2019).
The overall findings developed with this project clearly shows the approximately 55
percent of males are habitual of using video games at constant basis in order to make themselves
busy and enjoy their life. On the other hand, when it is emphasised on the females it can be said
that the proportion of these is lower in consumption of video games or its usage as compared to
the males (King and et. al., 2019). Here, it can be said that approx 45 percent of females are
using video games at constant basis. It has been later analysed that the game developers are now
a days emphasising on developing according to the age group of the players so that their interest
in the same can remain constant and they regularly use the same things in an appropriate manner.
At the same time, the main concern of the companies is on finding out core requirement as well
as interest of the users towards the video games so that they can effectively modify their existing
7
Paraphrase This Document
Need a fresh take? Get an instant paraphrase of this document with our AI Paraphraser
offering according to the core requirements of the audience. This simply makes it easier for the
users to maintain their interest into the same for longer period of time.
Apart from this, the respective project provides clearer knowledge on the increasing
popularity of the video games among the people as they thinks that it distress them and fresh
their mind which ultimately contributes in the influencing them to focus on their core work in
rightful manner. Along with this, the study has revealed that there are range of the characters
which are considered by the game developers thus they are table to add on few interesting things
in the game. Some of these features are collectibles, challenges, explorations, secrets, unlock
able, music, choices etc. All of these features collaboratively enhances the frequency of the users
while these games. This ultimately adds on the rewards as well as value to the same product and
services (Kircaburun, Griffiths and Billieux, 2019). Along with this, it increases the overall
playing time of the users which enhances profitability of the businesses which are dealing into
the same in an appropriate manner. With the passing period of time evolution of the video game
have effectively developed range of opportunities for the companies which are dealing the
videogames. These are basically seen as the commercial video games like Until Dawn, The
Witcher 3, Mass Effect 2, Heavy Rain, etc. Also, the investigation revealed that the core
importance of in-game learning processes, following the stimulation of dopamine in
neuromodulated areas. In addition to this, it has been further analysed that the results associated
with the same have indicated that there are high level of dopamine which were determined the in
the respective region. The main among them have acknowledged that it plays important role in
reward and motivation. Along with this several arguments represented by authors have clearly
depicted that robust progressive system has raised dopamine concentration which ultimately
contributes in enhancing frequency rate of the videogame play that contributes in the
accomplishment of the objectives (Király and et.al., 2019). On the other hand, while focusing on
the overall negative influence of the same can be acknowledged among the people by
determining its increasing risk factor linked with the desensitization of an individual’s gaming
tolerance. This can be well understood by simply taking example. For instance: It has been
analysed that the people who uses video games at constant basis faces main problems, the main
among them is that they are not able to concentrate on their studies or the essential things as their
maximum time is being consumed in playing games for longer period of time. It can be further
said that lower education directly reduces chances of the career attainment. Along with this,
8
some of the main cases that have been identified due thhe excessive usage of the video games are
APA (American Psychiatric Association) etc. In addition to this, it has been later analysed that
there are several categories under which internet gaming disorder falls are preoccupation with
gaming, tolerance – the need to spend more time gaming to satisfy urge, giving up other
activities – loss of interest in previously enjoyed activities due to gaming, withdrawal symptoms
when gaming is taken away or not possible (sadness, anxiety, irritability), inability to reduce
playing, continuing to game despite problems, risked opportunities, deceiving family members or
other about amount of time spent on gaming, continuing to game despite problems, reduced
interests and many others. All of these are acknowledged as the main categories under which
Internet Gaming Disorder develops at constant basis.
Away with this, the long term influence of video games if often observed is seen quite positive as
it improvises the health condition of the people as the feels quite diverted from their core daily
life based issues. Along with this, it also provides support in the execution of their daily life
based work in more effective manner (Leung and et. al., 2020). In addition to this, it is also
acknowledged that people who plays video games are able to perform the work and deal with
different situation in optimised form which ultimately maximises their working capability in
rightful manner. However, it is also seen that video game directly offers a variety of features
which ultimately allows person in stimulating its neuronal response that contributes in the
effective recovery of the persons mental representation this simply includes videogame
mechanics and gaming platforms.
Moreover the findings as well as study has revealed that the perception of the person
completely depends upon their own past experiences and the associated information which have
been stored by them in their mind. The respective theory clearly provides detailed information on
the sequence of actions that is being taken by person in the several situations which is being
faced by them in their daily based life. It clearly depicts that videogame mechanism has
relationship with the execution of function.
In addition to this, the literature review section has clearly specified the spending time while
playing videogame are acknowledged the cognitive development process. In simple words, it can
be said that this increases attentiveness, multitasking as well as working memory of the person in
lucrative form. However, the motivational values of the videogames are acknowledged as most
9
⊘ This is a preview!⊘
Do you want full access?
Subscribe today to unlock all pages.
Trusted by 1+ million students worldwide
influential one because it creates craving among the people to play game again and again in order
to improvise their mindset in effective manner.
Views expressed that some other scholars has justified that Internet gaming disorder has been
experienced by many players as they are getting distracted due to spending their most precious
time in the working. In addition to this, it might also distract other people from performing the
core work as they are not realising their responsibility. Here, it can be said that there are many
people who are highly sports lover but still their main occupation is to perform the work in
another profession (Kim, 2019). It can be said if any video game player is going to attend any
urgent meeting or are indulging into some other professional work while at the same time
respective person is reach to about the finale in their game. In this situation this person won’t be
able to concentrate on their work as their full focus is diverted towards the game only.
The overall results associated with the same are determined that there are several variable
such as Age, Gender, IGDTotal, BSITotal, Sfmental health and Sfgeneral health. T Findings
developed by analysing all provides actual knowledge on the relationship in between internet
gaming disorders, general health and mental health of people.
The core findings developed from the result section depicts that people belonging to the age
group in between 20-21 years plays video game a lot which ultimately develops their interest at
constant basis. In addition to this, the moderate level of frequency is commonly seen among in
between the age group of 19 years old to 26 years.
Apart from this, it has been later acknowledged that the numbers of males are more
interested in playing videogames as compared to the males. This is due to the surrounding
influence of these people. The overall findings developed which relationship in between
IGDTotal and BSI scores is highly accepted as it can be said that the increasing internet gaming
disorder among people directly raises the condition of the anxiety and depression among all the
participants which is ultimately affecting mental health (Evren and et. al., 2018). On the other
hand, it has been analysed that the overall relationship in-between IGDTotal and SFmental health
is on average which states that the regular based usage of the video games and spending time
while visiting these games is good for the people as they are able to enjoy and release their
stress. Thus, these people are able to love better lifestyle on an average. Along with this, it can be
later said that the overall relationship between IGDTotal and SFgeneral health is negative as the
results section has shown that internet gaming disorder s increasing number of the health issues
10
Paraphrase This Document
Need a fresh take? Get an instant paraphrase of this document with our AI Paraphraser
among the people also it is reduces the general health issues among the people. The finding
sections has not be seen satisfied with the information depicted in the literature review section as
it shows that video games are diverting mind of the people towards other work. As a result, these
people are not able to settle down their career due to huge level of distraction in the society. In
the whole sum it can be said that information developed from the literature review section and
the findings clearly shows that video games are considered as the advance form of games which
are highly useful in engaging people in the work for longer period of time. But, the people who
are habitual of this are gaining its positive as well as negative influence over them (Stockdale
and Coyne, 2018). The positive influence related to the same is that these people are able to deal
with the difficult situations in more positive manner. Also, the level of depression and anxiety
among them declines with the passing period of time. Whereas if it is talked about the negative
influence over the same it can be said that these people gets diverted towards the other due to
high consumption in playing video games.
11
REFERENCES
Books and Journals
Wartberg, L., Kriston, L., Zieglmeier, M., Lincoln, T. and Kammerl, R., 2019. A longitudinal
study on psychosocial causes and consequences of Internet gaming disorder in
adolescence. Psychological medicine, 49(2), pp.287-294.
King, D.L., Delfabbro, P.H., Perales, J.C., Deleuze, J., Király, O., Krossbakken, E. and Billieux,
J., 2019. Maladaptive player-game relationships in problematic gaming and gaming
disorder: A systematic review. Clinical psychology review, 73, p.101777.
Kircaburun, K., Griffiths, M.D. and Billieux, J., 2019. Psychosocial factors mediating the
relationship between childhood emotional trauma and internet gaming disorder: a pilot
study. European Journal of Psychotraumatology, 10(1), p.1565031.
Király, O., Bőthe, B., Ramos-Diaz, J., Rahimi-Movaghar, A., Lukavska, K., Hrabec, O.,
Miovsky, M., Billieux, J., Deleuze, J., Nuyens, F. and Karila, L., 2019. Ten-Item Internet
Gaming Disorder Test (IGDT-10): Measurement invariance and cross-cultural validation
across seven language-based samples. Psychology of Addictive Behaviors, 33(1), p.91.
Leung, H., Pakpour, A.H., Strong, C., Lin, Y.C., Tsai, M.C., Griffiths, M.D., Lin, C.Y. and
Chen, I.H., 2020. Measurement invariance across young adults from Hong Kong and
Taiwan among three internet-related addiction scales: Bergen Social Media Addiction
Scale (BSMAS), Smartphone Application-Based Addiction Scale (SABAS), and Internet
Gaming Disorder Scale-Short Form (IGDS-SF9)(Study Part A). Addictive
behaviors, 101, p.105969.
Kim, B.N., 2019. Korean Validation of the Internet Gaming Disorder-20 Test. Cyberpsychology,
Behavior, And Social Networking, 22(4), pp.271-276.
Evren, C., Dalbudak, E., Topcu, M., Kutlu, N., Evren, B. and Pontes, H.M., 2018. Psychometric
validation of the Turkish nine-item internet gaming disorder scale–short form (IGDS9-
SF). Psychiatry Research, 265, pp.349-354.
Stockdale, L. and Coyne, S.M., 2018. Video game addiction in emerging adulthood: Cross-
sectional evidence of pathology in video game addicts as compared to matched healthy
controls. Journal of affective disorders, 225, pp.265-272.
Wong, H.Y., Mo, H.Y., Potenza, M.N., Chan, M.N.M., Lau, W.M., Chui, T.K., Pakpour, A.H.
and Lin, C.Y., 2020. Relationships between severity of internet gaming disorder, severity
of problematic social media use, sleep quality and psychological distress. International
Journal of Environmental Research and Public Health, 17(6), p.1879.
Allen, J.J. and Anderson, C.A., 2018. Satisfaction and frustration of basic psychological needs in
the real world and in video games predict internet gaming disorder scores and well-
being. Computers in Human Behavior, 84, pp.220-229.
Stavropoulos, V., Burleigh, T.L., Beard, C.L., Gomez, R. and Griffiths, M.D., 2019. Being there:
A preliminary study examining the role of presence in internet gaming
disorder. International Journal of Mental Health and Addiction, 17(4), pp.880-890.
González-Bueso, V., Santamaría, J.J., Oliveras, I., Fernández, D., Montero, E., Baño, M.,
Jiménez-Murcia, S., del Pino-Gutiérrez, A. and Ribas, J., 2020. Internet Gaming Disorder
Clustering Based on Personality Traits in Adolescents, and Its Relation with Comorbid
Psychological Symptoms. International Journal of Environmental Research and Public
Health, 17(5), p.1516.
12
⊘ This is a preview!⊘
Do you want full access?
Subscribe today to unlock all pages.
Trusted by 1+ million students worldwide
1 out of 21
Related Documents


Your All-in-One AI-Powered Toolkit for Academic Success.
+13062052269
info@desklib.com
Available 24*7 on WhatsApp / Email
![[object Object]](/_next/static/media/star-bottom.7253800d.svg)
Unlock your academic potential
Copyright © 2020–2026 A2Z Services. All Rights Reserved. Developed and managed by ZUCOL.