SPSS Analysis: Transport Subsidies and Student Education

Verified

Added on  2020/01/28

|21
|3211
|62
Report
AI Summary
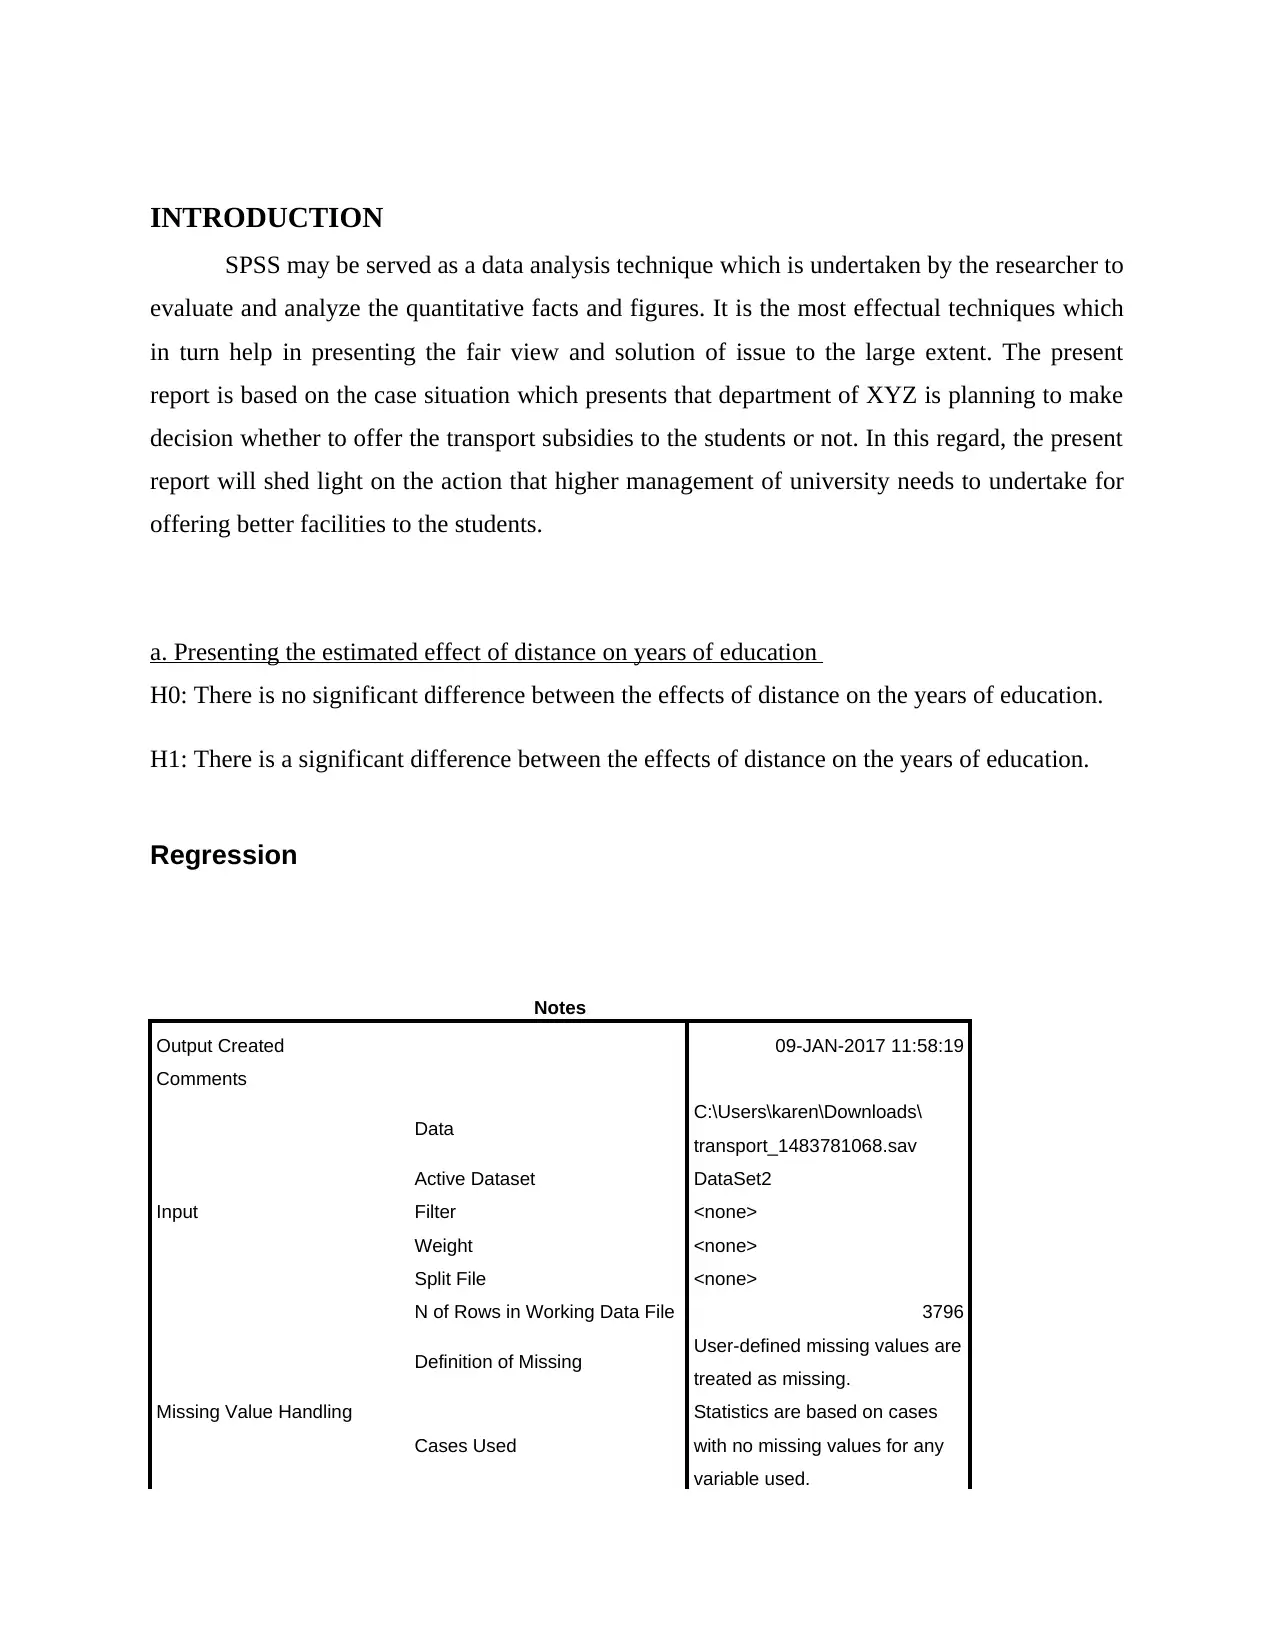
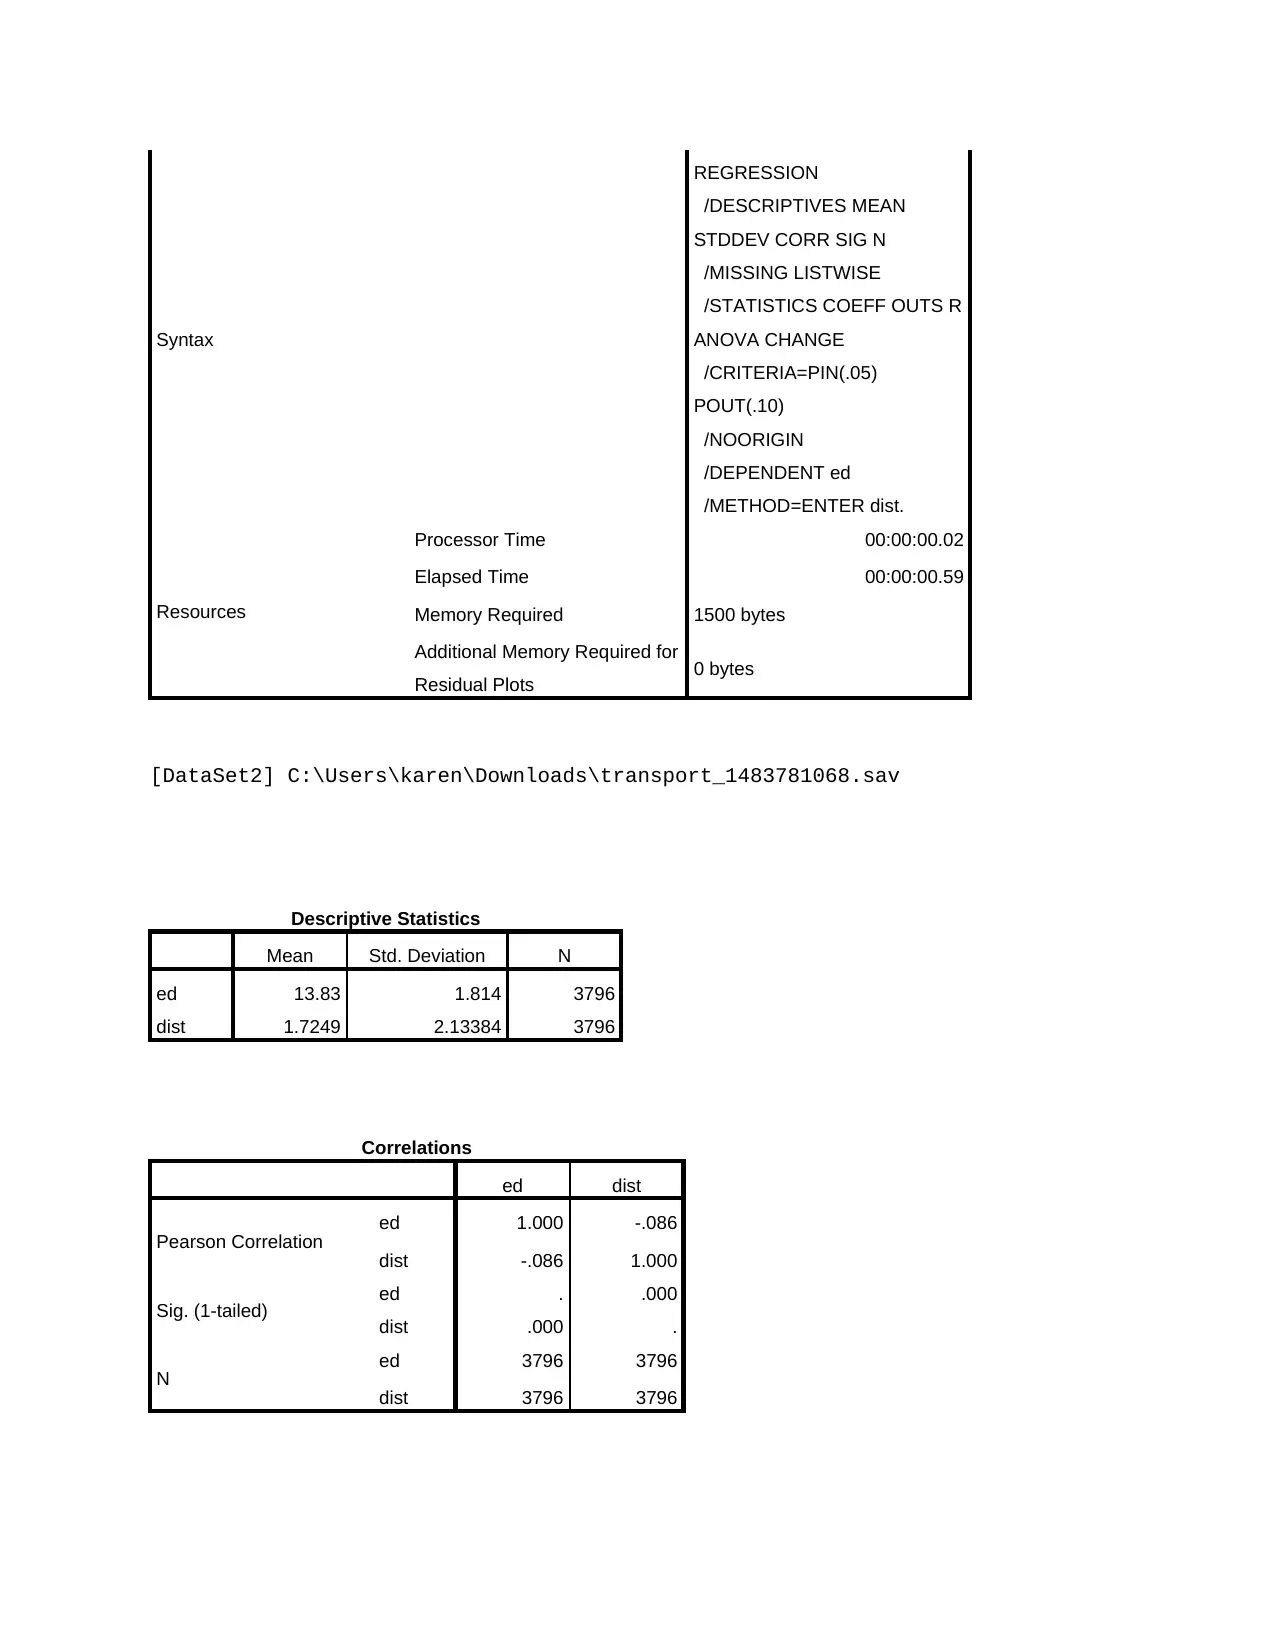
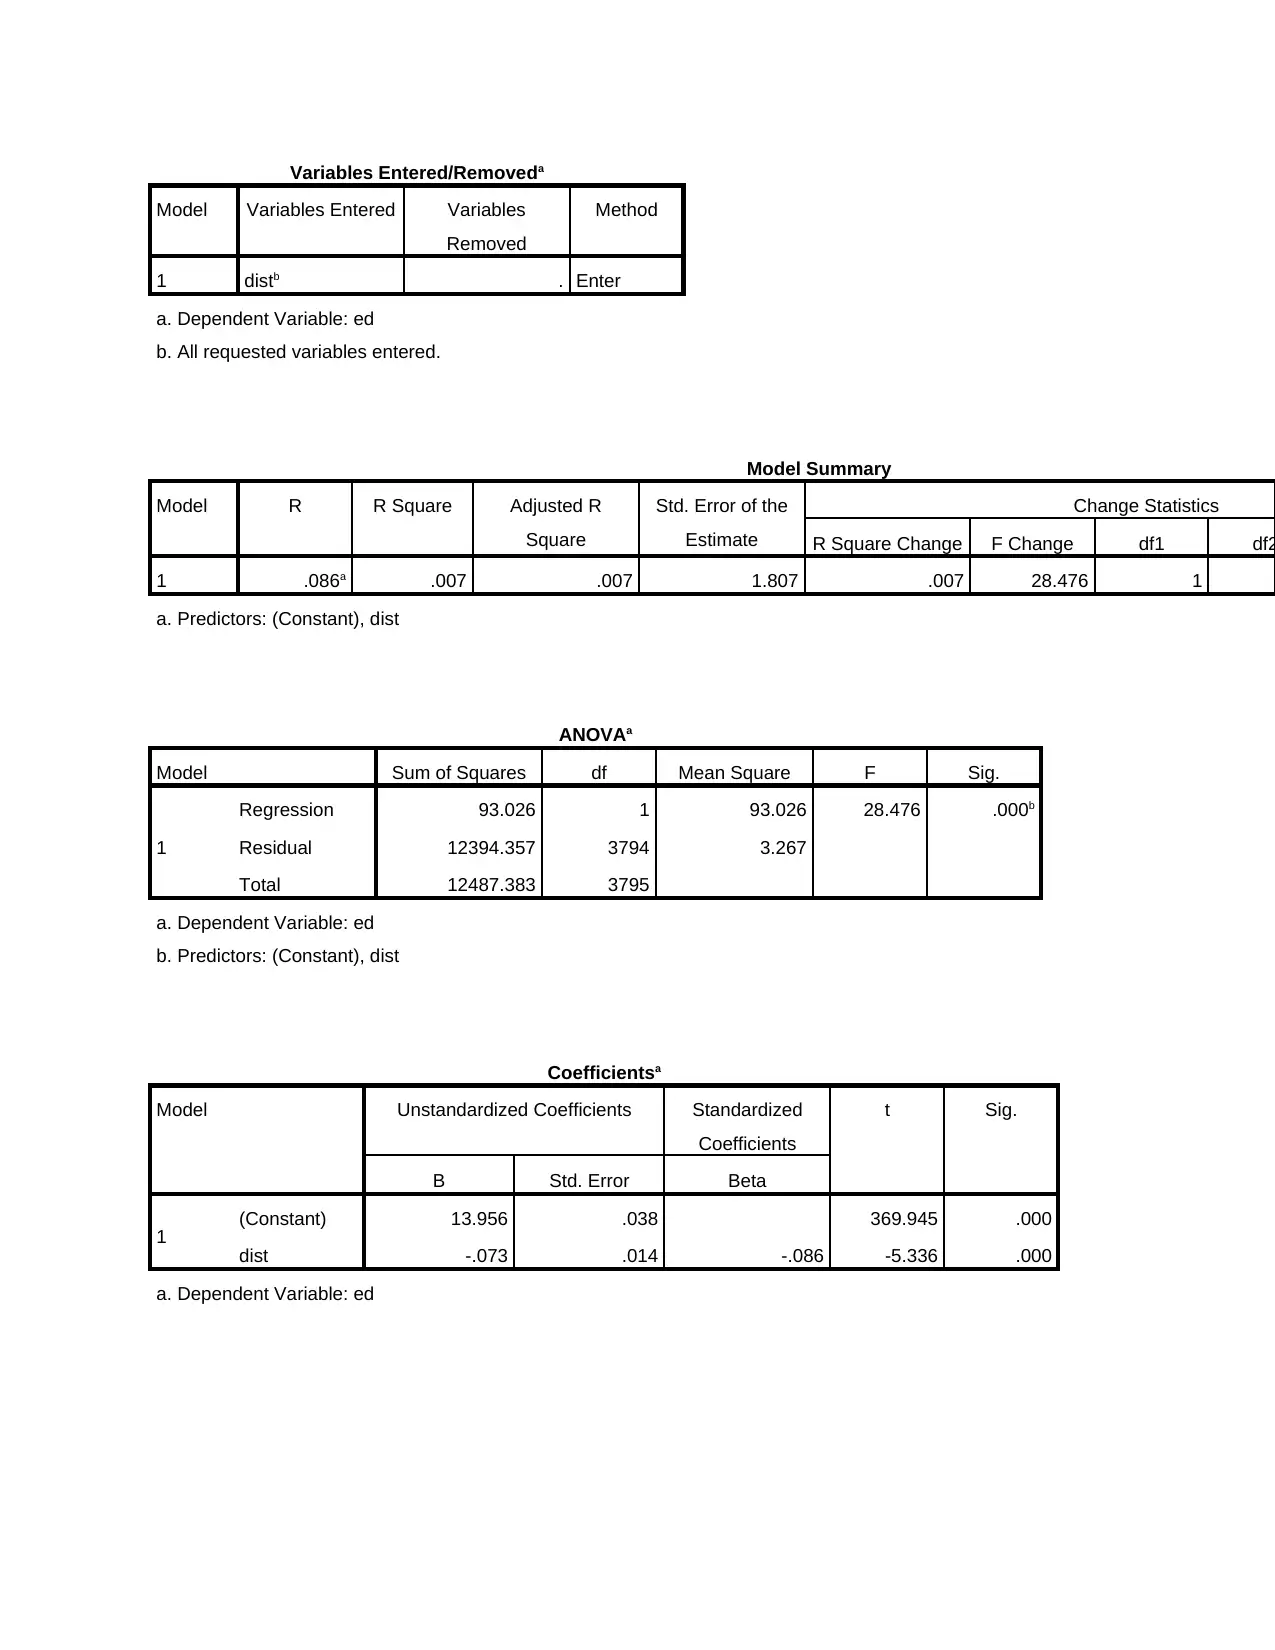
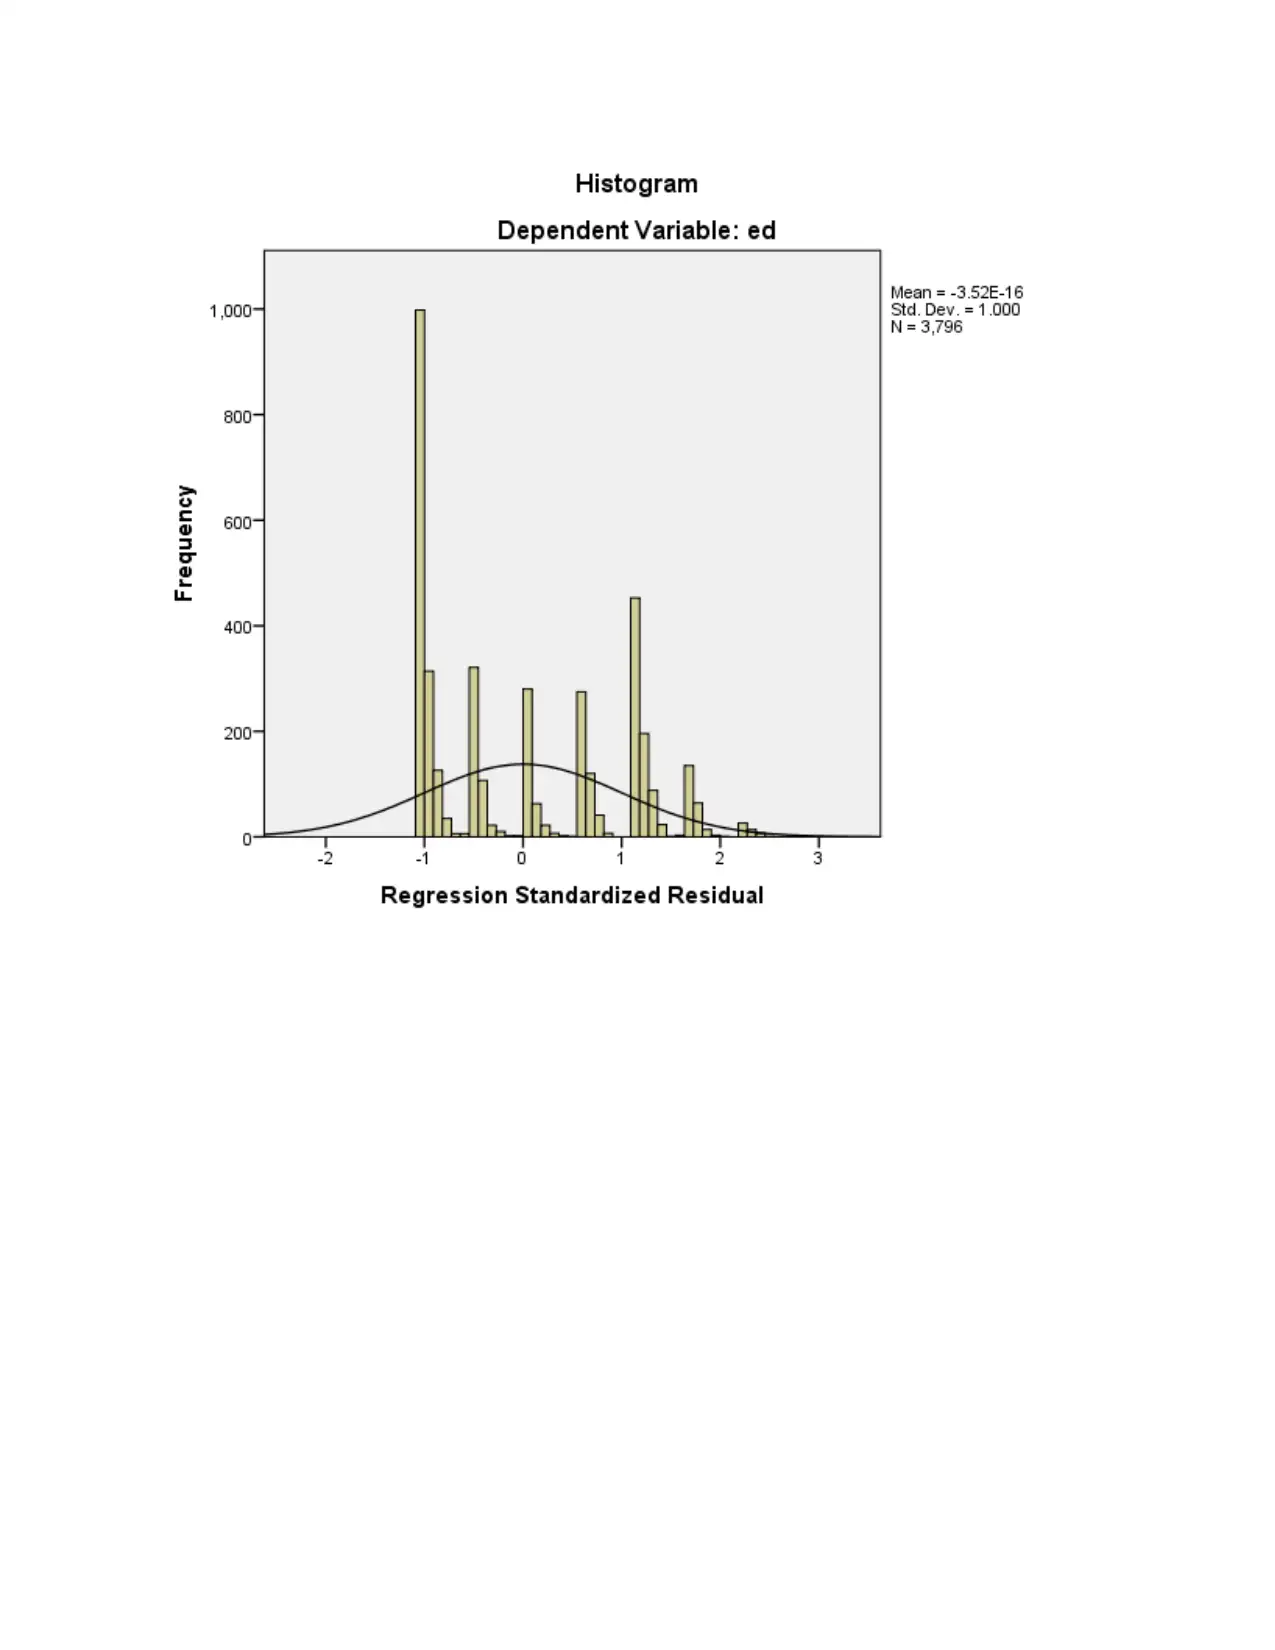
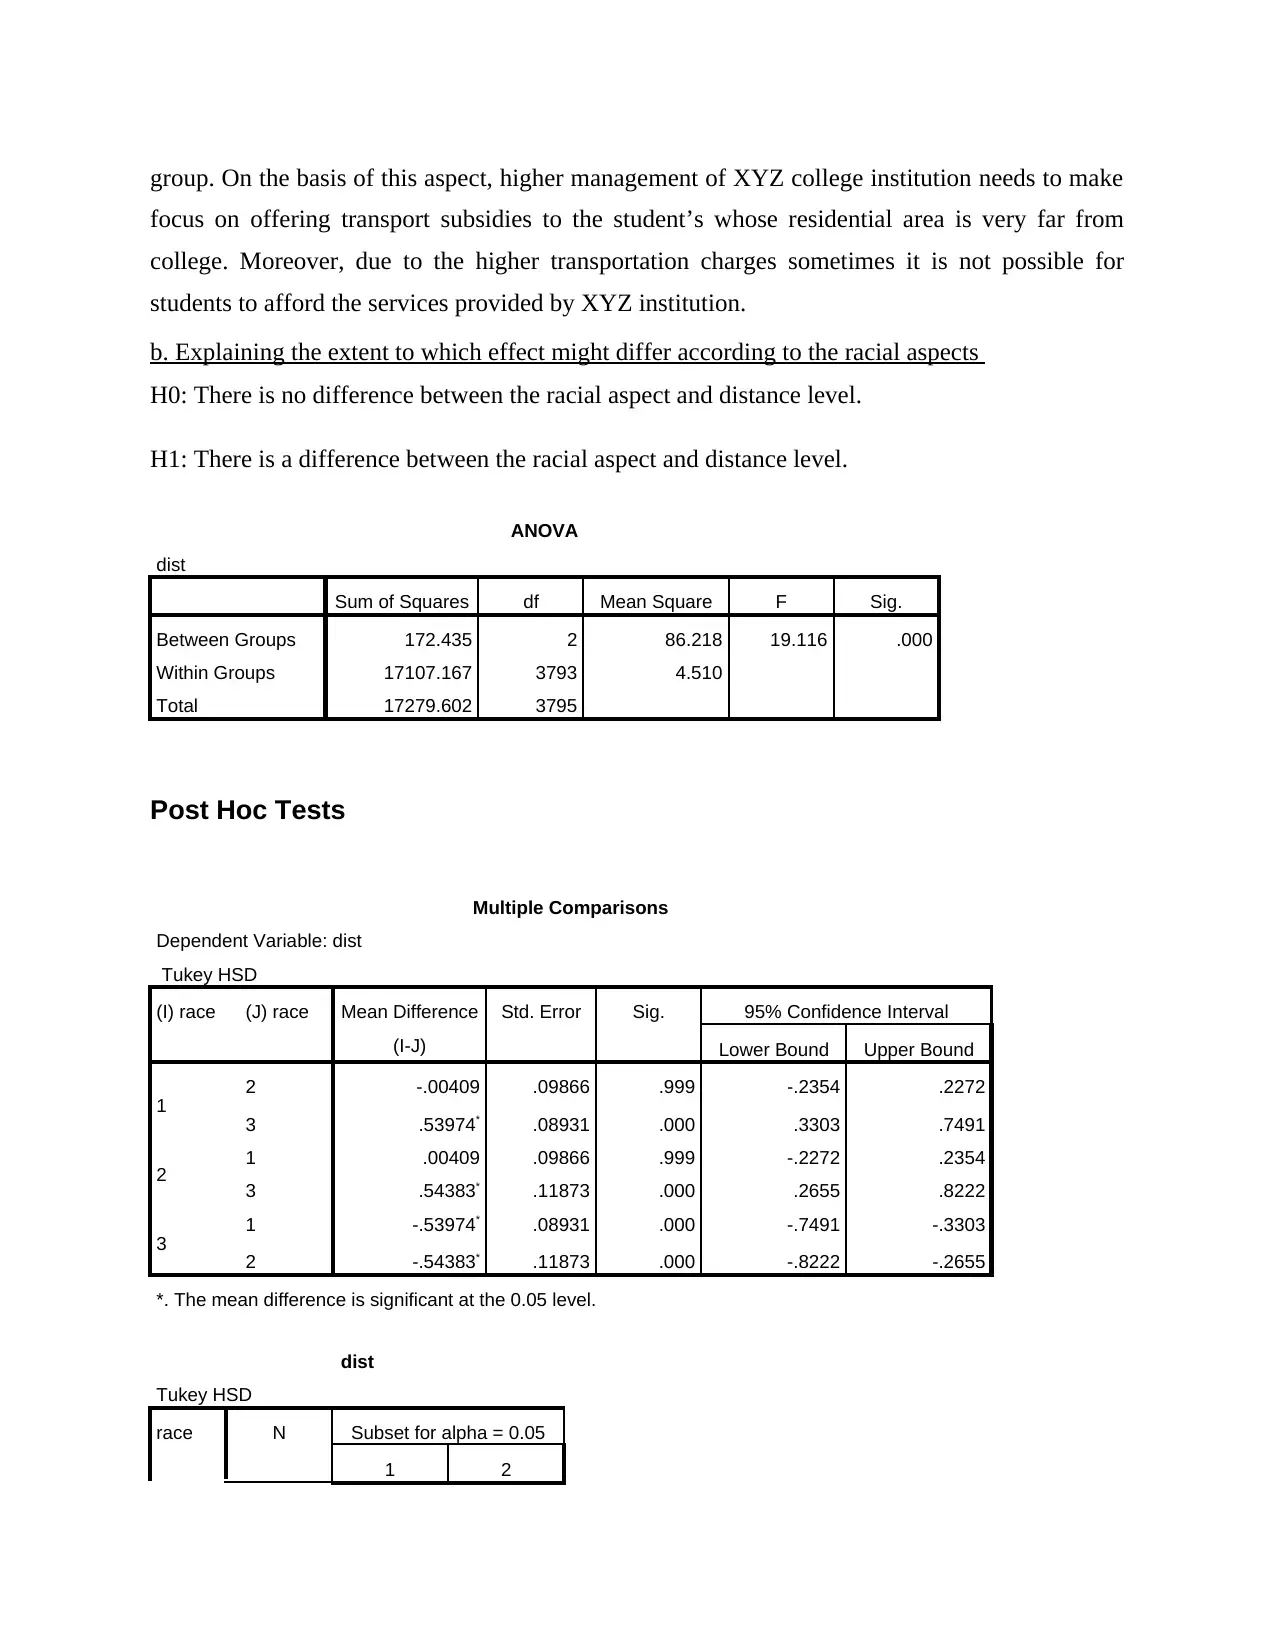
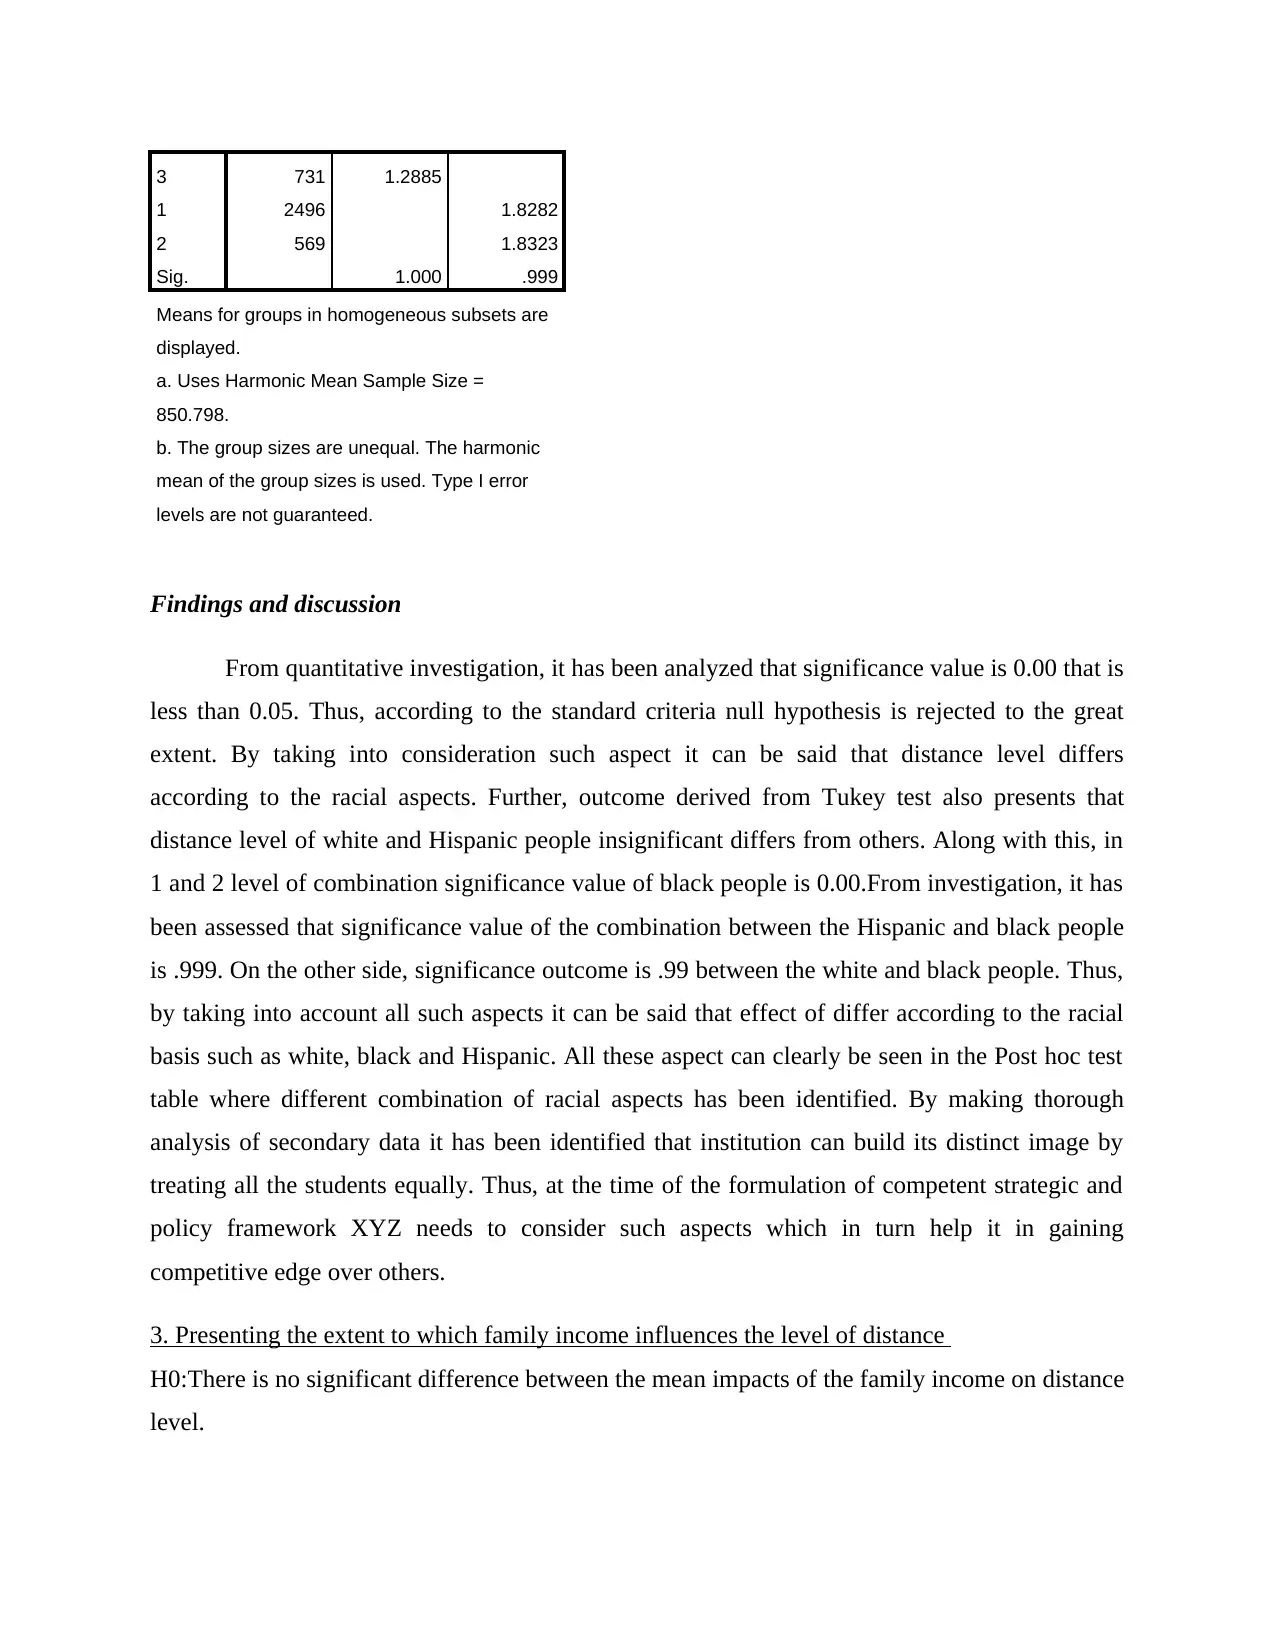
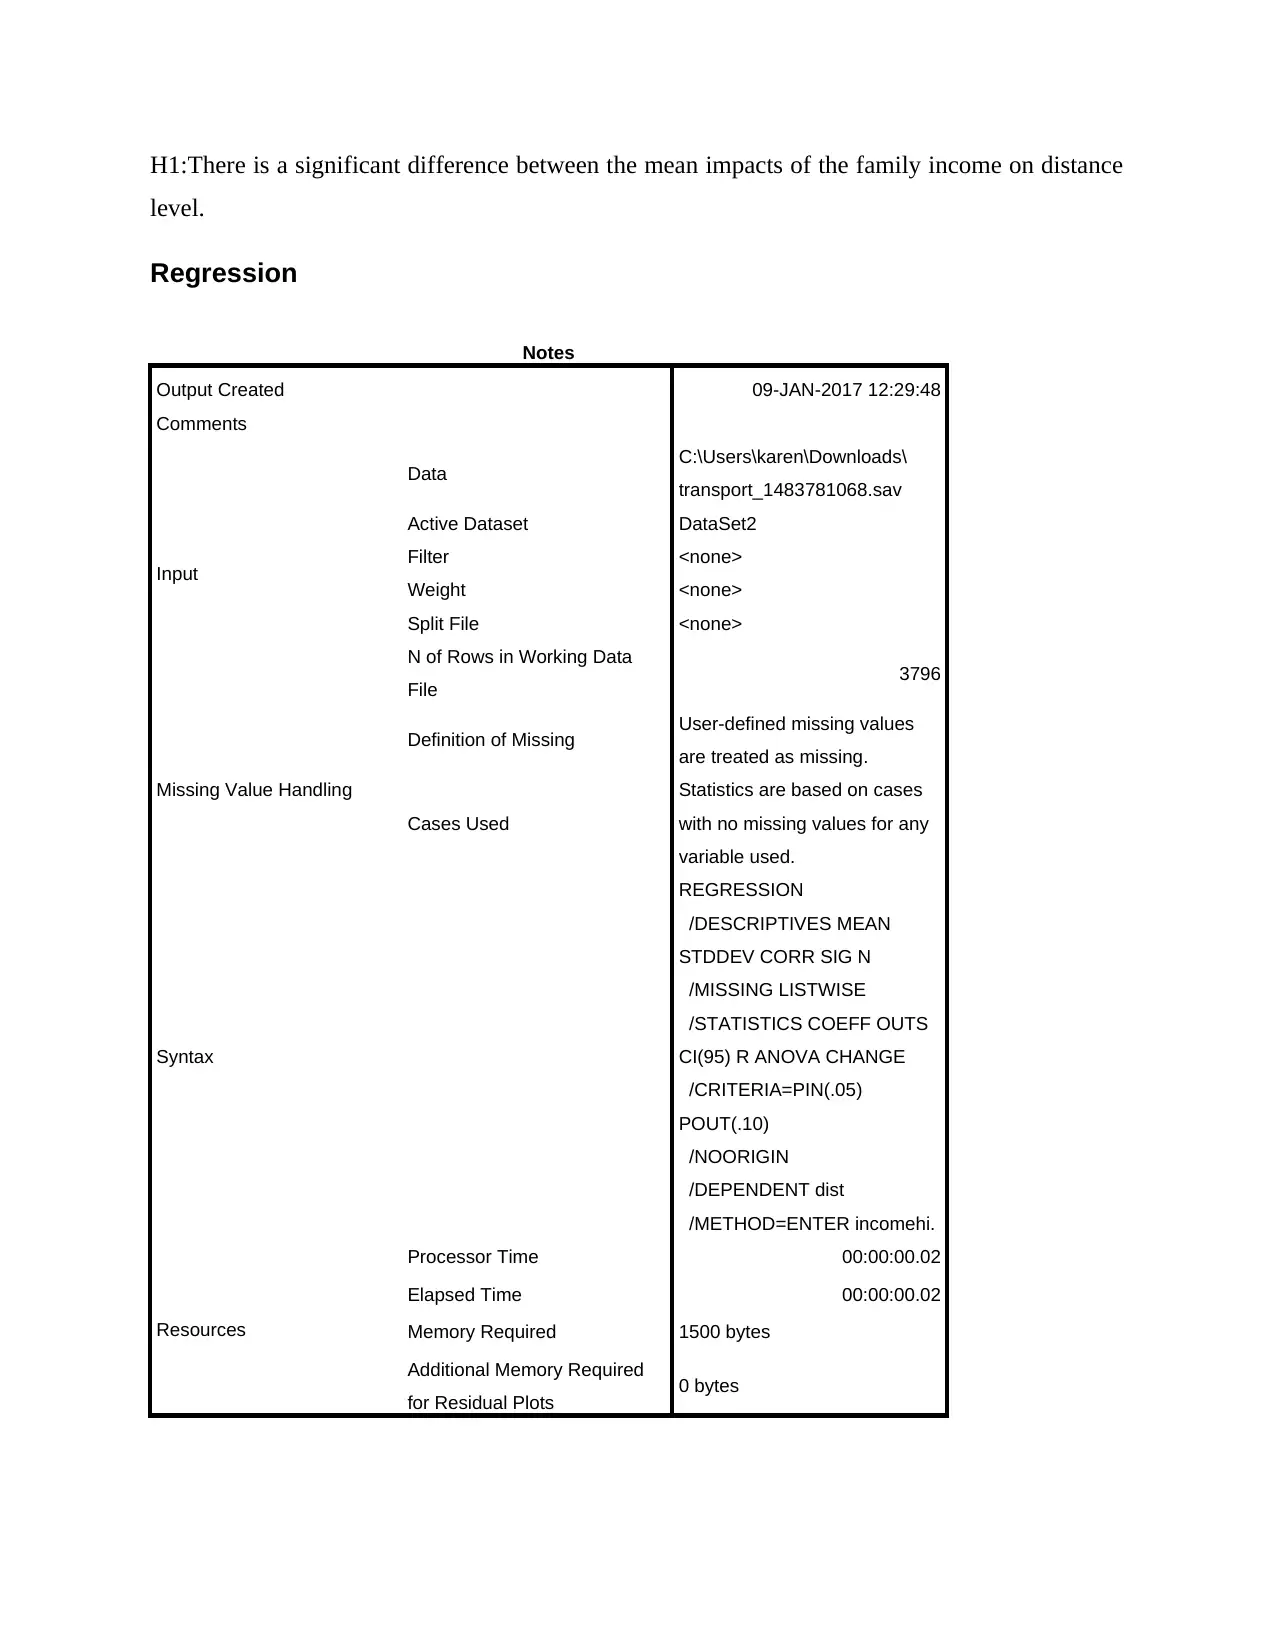
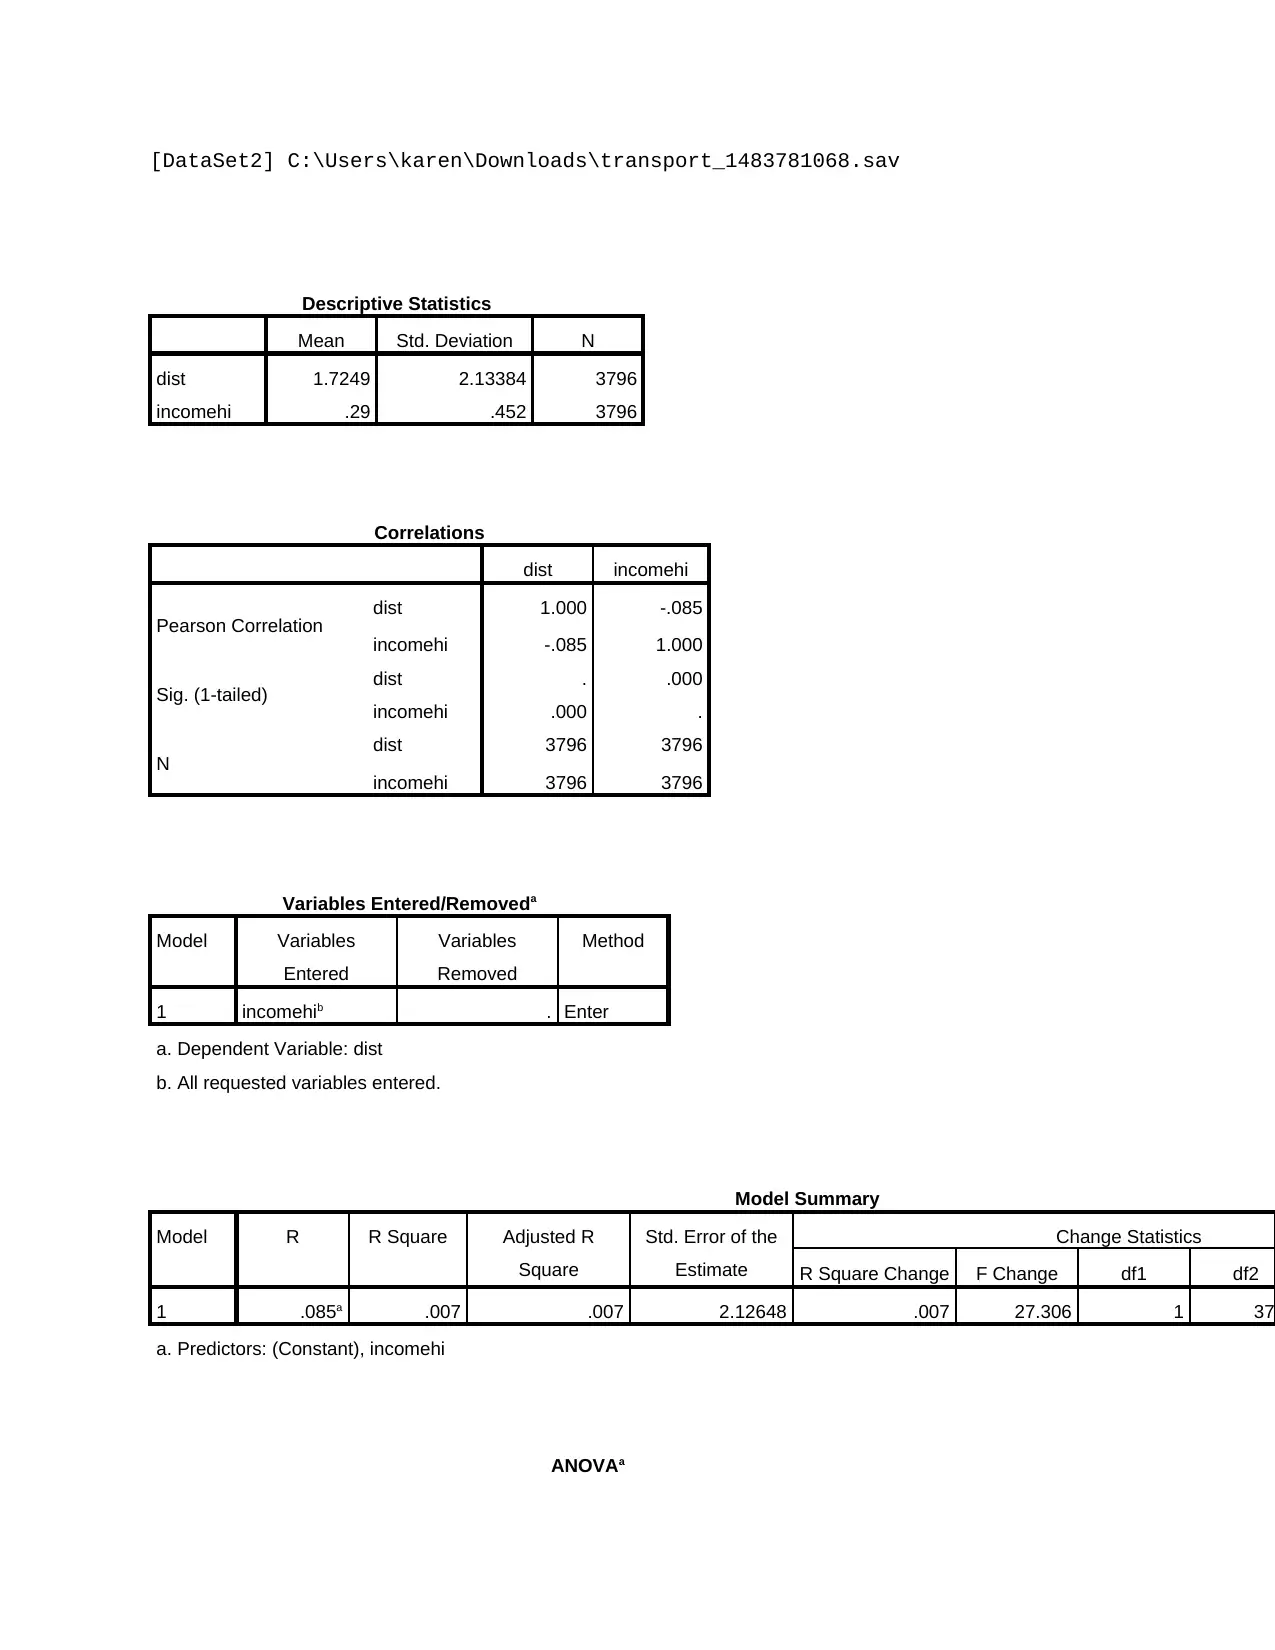
This report presents an SPSS analysis of student data to determine the impact of distance, race, and family income on years of education. The study, conducted for XYZ University, investigates the potential for transport subsidies to improve student access and outcomes. The analysis employs regression techniques to assess the relationship between distance and education, exploring how these effects might vary across racial groups. Further, the report examines the influence of family income on the level of distance students are willing or able to travel for education. The findings suggest that distance significantly impacts students who completed their studies, and that family income plays a crucial role in determining students' ability to afford education. The report also suggests the usage of regression models in the data analysis. The report concludes with recommendations for the university's management regarding transport subsidies and strategic planning to enhance student accessibility and institutional competitiveness.
Document Page
SPSS Programme
tabler-icon-diamond-filled.svg

Paraphrase This Document

Need a fresh take? Get an instant paraphrase of this document with our AI Paraphraser
Document Page
Table of Contents
INTRODUCTION...........................................................................................................................3
a. Presenting the estimated effect of distance on years of education...........................................3
b. Explaining the extent to which effect might differ according to the racial aspects.................5
3. Presenting the extent to whichfamily incomeinfluences the level of distance........................5
4. Identifying alternative technique which can be used for analyzing the data set......................6
CONCLUSION................................................................................................................................8
REFERENCES................................................................................................................................9
Table..............................................................................................................................................11
Document Page
INTRODUCTION
SPSS may be served as a data analysis technique which is undertaken by the researcher to
evaluate and analyze the quantitative facts and figures. It is the most effectual techniques which
in turn help in presenting the fair view and solution of issue to the large extent. The present
report is based on the case situation which presents that department of XYZ is planning to make
decision whether to offer the transport subsidies to the students or not. In this regard, the present
report will shed light on the action that higher management of university needs to undertake for
offering better facilities to the students.
a. Presenting the estimated effect of distance on years of education
H0: There is no significant difference between the effects of distance on the years of education.
H1: There is a significant difference between the effects of distance on the years of education.
Regression
Notes
Output Created 09-JAN-2017 11:58:19
Comments
Input
Data C:\Users\karen\Downloads\
transport_1483781068.sav
Active Dataset DataSet2
Filter <none>
Weight <none>
Split File <none>
N of Rows in Working Data File 3796
Missing Value Handling
Definition of Missing User-defined missing values are
treated as missing.
Cases Used
Statistics are based on cases
with no missing values for any
variable used.
Document Page
Syntax
REGRESSION
/DESCRIPTIVES MEAN
STDDEV CORR SIG N
/MISSING LISTWISE
/STATISTICS COEFF OUTS R
ANOVA CHANGE
/CRITERIA=PIN(.05)
POUT(.10)
/NOORIGIN
/DEPENDENT ed
/METHOD=ENTER dist.
Resources
Processor Time 00:00:00.02
Elapsed Time 00:00:00.59
Memory Required 1500 bytes
Additional Memory Required for
Residual Plots 0 bytes
[DataSet2] C:\Users\karen\Downloads\transport_1483781068.sav
Descriptive Statistics
Mean Std. Deviation N
ed 13.83 1.814 3796
dist 1.7249 2.13384 3796
Correlations
ed dist
Pearson Correlation ed 1.000 -.086
dist -.086 1.000
Sig. (1-tailed) ed . .000
dist .000 .
N
ed 3796 3796
dist 3796 3796
tabler-icon-diamond-filled.svg

Paraphrase This Document

Need a fresh take? Get an instant paraphrase of this document with our AI Paraphraser
Document Page
Variables Entered/Removeda
Model Variables Entered Variables
Removed
Method
1 distb . Enter
a. Dependent Variable: ed
b. All requested variables entered.
Model Summary
Model R R Square Adjusted R
Square
Std. Error of the
Estimate
Change Statistics
R Square Change F Change df1 df2
1 .086a .007 .007 1.807 .007 28.476 1 3
a. Predictors: (Constant), dist
ANOVAa
Model Sum of Squares df Mean Square F Sig.
1
Regression 93.026 1 93.026 28.476 .000b
Residual 12394.357 3794 3.267
Total 12487.383 3795
a. Dependent Variable: ed
b. Predictors: (Constant), dist
Coefficientsa
Model Unstandardized Coefficients Standardized
Coefficients
t Sig.
B Std. Error Beta
1 (Constant) 13.956 .038 369.945 .000
dist -.073 .014 -.086 -5.336 .000
a. Dependent Variable: ed
Document Page
Document Page
Findings and discussion
By doing investigation on 3796 young adults it has been assessed that mean value of
education years and distance is 13.83 &1.72 respectively. This aspect shows that average
distance level is 1.72sthathascompleted education in the year of14.Standard deviation of both
such variables is 1.81 &2.13. By considering this, it can be said that in the near future distance
level of the students will not deviate to the large extent. Along with this, R of education years
and distance level is0.08 which presents that there is no high level of relationship takes place
between such two variables. R square of both the variables is.007which entails that if changes
are taken place in the years of education then it does not place more impact on the students who
completed education by 2010.
tabler-icon-diamond-filled.svg

Paraphrase This Document

Need a fresh take? Get an instant paraphrase of this document with our AI Paraphraser
Document Page
Further, level of significance is 0.00 which is under the acceptable criteria. Thus, by
taking into account all such aspects it can be said that alternative hypothesis is accepted. On the
basis of this aspect, distance level had significantly impacted the students who completed study
by 2010.Hence, it is recommended to the higher management of XYZ University to offer
transport subsidies to the students. By doing this, college can attract the large number of students
and thereby maximizes the profitability aspects.
Descriptive Statistics
N Range Minimu
m
Maximu
m
Mean Std.
Deviatio
n
Varianc
e
Skewness Kurtosis
Statisti
c
Statisti
c
Statistic Statistic Statisti
c
Std.
Error
Statistic Statistic Statisti
c
Std.
Erro
r
Statisti
c
Std.
Erro
r
ed 3796 6 12 18 13.83 .029 1.814 3.290 .413 .040 -1.280 .079
female 3796 1 0 1 .55 .008 .498 .248 -.182 .040 -1.968 .079
bytest 3796 42.41 28.95 71.36 51.001
9
.1431
4 8.81925 77.779 -.055 .040 -.905 .079
dadcoll 3796 1 0 1 .20 .007 .402 .161 1.485 .040 .204 .079
momcoll 3796 1 0 1 .14 .006 .346 .120 2.084 .040 2.342 .079
tuition 3796 .97 .43 1.40 .9122 .0046
2 .28460 .081 -.167 .040 -.989 .079
incomeh
i 3796 1 0 1 .29 .007 .452 .204 .946 .040 -1.106 .079
dist 3796 16.00 .00 16.00 1.7249 .0346
3 2.13384 4.553 2.906 .040 12.499 .079
Valid N
(listwise
)
3796
By applying the tools of descriptive statistics, it has been assessed that most of the
respondents are female who have presented their views. Along with this, descriptive statics
results show that there is no university degree has taken by father and mothers of students.
Further, it has been assessed that there are large number of students whose family income is less
than $ 50000. It shows that there are several students who belong from the middle income level
Document Page
group. On the basis of this aspect, higher management of XYZ college institution needs to make
focus on offering transport subsidies to the student’s whose residential area is very far from
college. Moreover, due to the higher transportation charges sometimes it is not possible for
students to afford the services provided by XYZ institution.
b. Explaining the extent to which effect might differ according to the racial aspects
H0: There is no difference between the racial aspect and distance level.
H1: There is a difference between the racial aspect and distance level.
ANOVA
dist
Sum of Squares df Mean Square F Sig.
Between Groups 172.435 2 86.218 19.116 .000
Within Groups 17107.167 3793 4.510
Total 17279.602 3795
Post Hoc Tests
Multiple Comparisons
Dependent Variable: dist
Tukey HSD
(I) race (J) race Mean Difference
(I-J)
Std. Error Sig. 95% Confidence Interval
Lower Bound Upper Bound
1 2 -.00409 .09866 .999 -.2354 .2272
3 .53974* .08931 .000 .3303 .7491
2 1 .00409 .09866 .999 -.2272 .2354
3 .54383* .11873 .000 .2655 .8222
3 1 -.53974* .08931 .000 -.7491 -.3303
2 -.54383* .11873 .000 -.8222 -.2655
*. The mean difference is significant at the 0.05 level.
dist
Tukey HSD
race N Subset for alpha = 0.05
1 2
Document Page
3 731 1.2885
1 2496 1.8282
2 569 1.8323
Sig. 1.000 .999
Means for groups in homogeneous subsets are
displayed.
a. Uses Harmonic Mean Sample Size =
850.798.
b. The group sizes are unequal. The harmonic
mean of the group sizes is used. Type I error
levels are not guaranteed.
Findings and discussion
From quantitative investigation, it has been analyzed that significance value is 0.00 that is
less than 0.05. Thus, according to the standard criteria null hypothesis is rejected to the great
extent. By taking into consideration such aspect it can be said that distance level differs
according to the racial aspects. Further, outcome derived from Tukey test also presents that
distance level of white and Hispanic people insignificant differs from others. Along with this, in
1 and 2 level of combination significance value of black people is 0.00.From investigation, it has
been assessed that significance value of the combination between the Hispanic and black people
is .999. On the other side, significance outcome is .99 between the white and black people. Thus,
by taking into account all such aspects it can be said that effect of differ according to the racial
basis such as white, black and Hispanic. All these aspect can clearly be seen in the Post hoc test
table where different combination of racial aspects has been identified. By making thorough
analysis of secondary data it has been identified that institution can build its distinct image by
treating all the students equally. Thus, at the time of the formulation of competent strategic and
policy framework XYZ needs to consider such aspects which in turn help it in gaining
competitive edge over others.
3. Presenting the extent to which family income influences the level of distance
H0:There is no significant difference between the mean impacts of the family income on distance
level.
tabler-icon-diamond-filled.svg

Paraphrase This Document

Need a fresh take? Get an instant paraphrase of this document with our AI Paraphraser
Document Page
H1:There is a significant difference between the mean impacts of the family income on distance
level.
Regression
Notes
Output Created 09-JAN-2017 12:29:48
Comments
Input
Data C:\Users\karen\Downloads\
transport_1483781068.sav
Active Dataset DataSet2
Filter <none>
Weight <none>
Split File <none>
N of Rows in Working Data
File 3796
Missing Value Handling
Definition of Missing User-defined missing values
are treated as missing.
Cases Used
Statistics are based on cases
with no missing values for any
variable used.
Syntax
REGRESSION
/DESCRIPTIVES MEAN
STDDEV CORR SIG N
/MISSING LISTWISE
/STATISTICS COEFF OUTS
CI(95) R ANOVA CHANGE
/CRITERIA=PIN(.05)
POUT(.10)
/NOORIGIN
/DEPENDENT dist
/METHOD=ENTER incomehi.
Resources
Processor Time 00:00:00.02
Elapsed Time 00:00:00.02
Memory Required 1500 bytes
Additional Memory Required
for Residual Plots 0 bytes
Document Page
[DataSet2] C:\Users\karen\Downloads\transport_1483781068.sav
Descriptive Statistics
Mean Std. Deviation N
dist 1.7249 2.13384 3796
incomehi .29 .452 3796
Correlations
dist incomehi
Pearson Correlation dist 1.000 -.085
incomehi -.085 1.000
Sig. (1-tailed) dist . .000
incomehi .000 .
N dist 3796 3796
incomehi 3796 3796
Variables Entered/Removeda
Model Variables
Entered
Variables
Removed
Method
1 incomehib . Enter
a. Dependent Variable: dist
b. All requested variables entered.
Model Summary
Model R R Square Adjusted R
Square
Std. Error of the
Estimate
Change Statistics
R Square Change F Change df1 df2
1 .085a .007 .007 2.12648 .007 27.306 1 379
a. Predictors: (Constant), incomehi
ANOVAa
chevron_up_icon
1 out of 21
circle_padding
hide_on_mobile
zoom_out_icon