The Frequency Distribution of Demographics: 27 SPSS Statistics Psychology Author's note:
29 Pages8404 Words366 Views
Added on 2020-05-28
About This Document
This report is on "frequency distribution of demographics". A screening survey was utilized via “SurveyMonkey” for determining whether participants met the inclusion criteria. SPSS statistics generates many various tables in the one-way MANOVA multivariate analysis of variance analysis. In this section, we indicate the main tables needed for understanding the outcomes from one-way MANOVA and Tukey post-hoc tests. For, a complete explanation, we discuss MANOVA assumptions for having a valid result. The calculation of MANOVA is executed into three types of thresholds are 50%, 25%, and 10% as provided in the SPSS dataset.
The Frequency Distribution of Demographics: 27 SPSS Statistics Psychology Author's note:
Added on 2020-05-28
ShareRelated Documents
Running head: SPSS STATISTICS PSYCHOLOGY SPSS Statistics PsychologyName of the Student:Name of the University:Author’s note:
1SPSS STATISTICS PSYCHOLOGYTable of ContentsIntroduction:................................................................................................................................................................................................2Data Analysis:..............................................................................................................................................................................................250% Threshold.........................................................................................................................................................................................225% Threshold:........................................................................................................................................................................................710% Threshold:......................................................................................................................................................................................12Frequency distribution of demographics:..............................................................................................................................................16Frequency Distribution of Disgust People:............................................................................................................................................17Frequency Distribution of Contemptuous People:................................................................................................................................21Frequency Distribution of Happy People:.............................................................................................................................................24Conclusion:................................................................................................................................................................................................27Annotated Bibliography:...........................................................................................................................................................................28
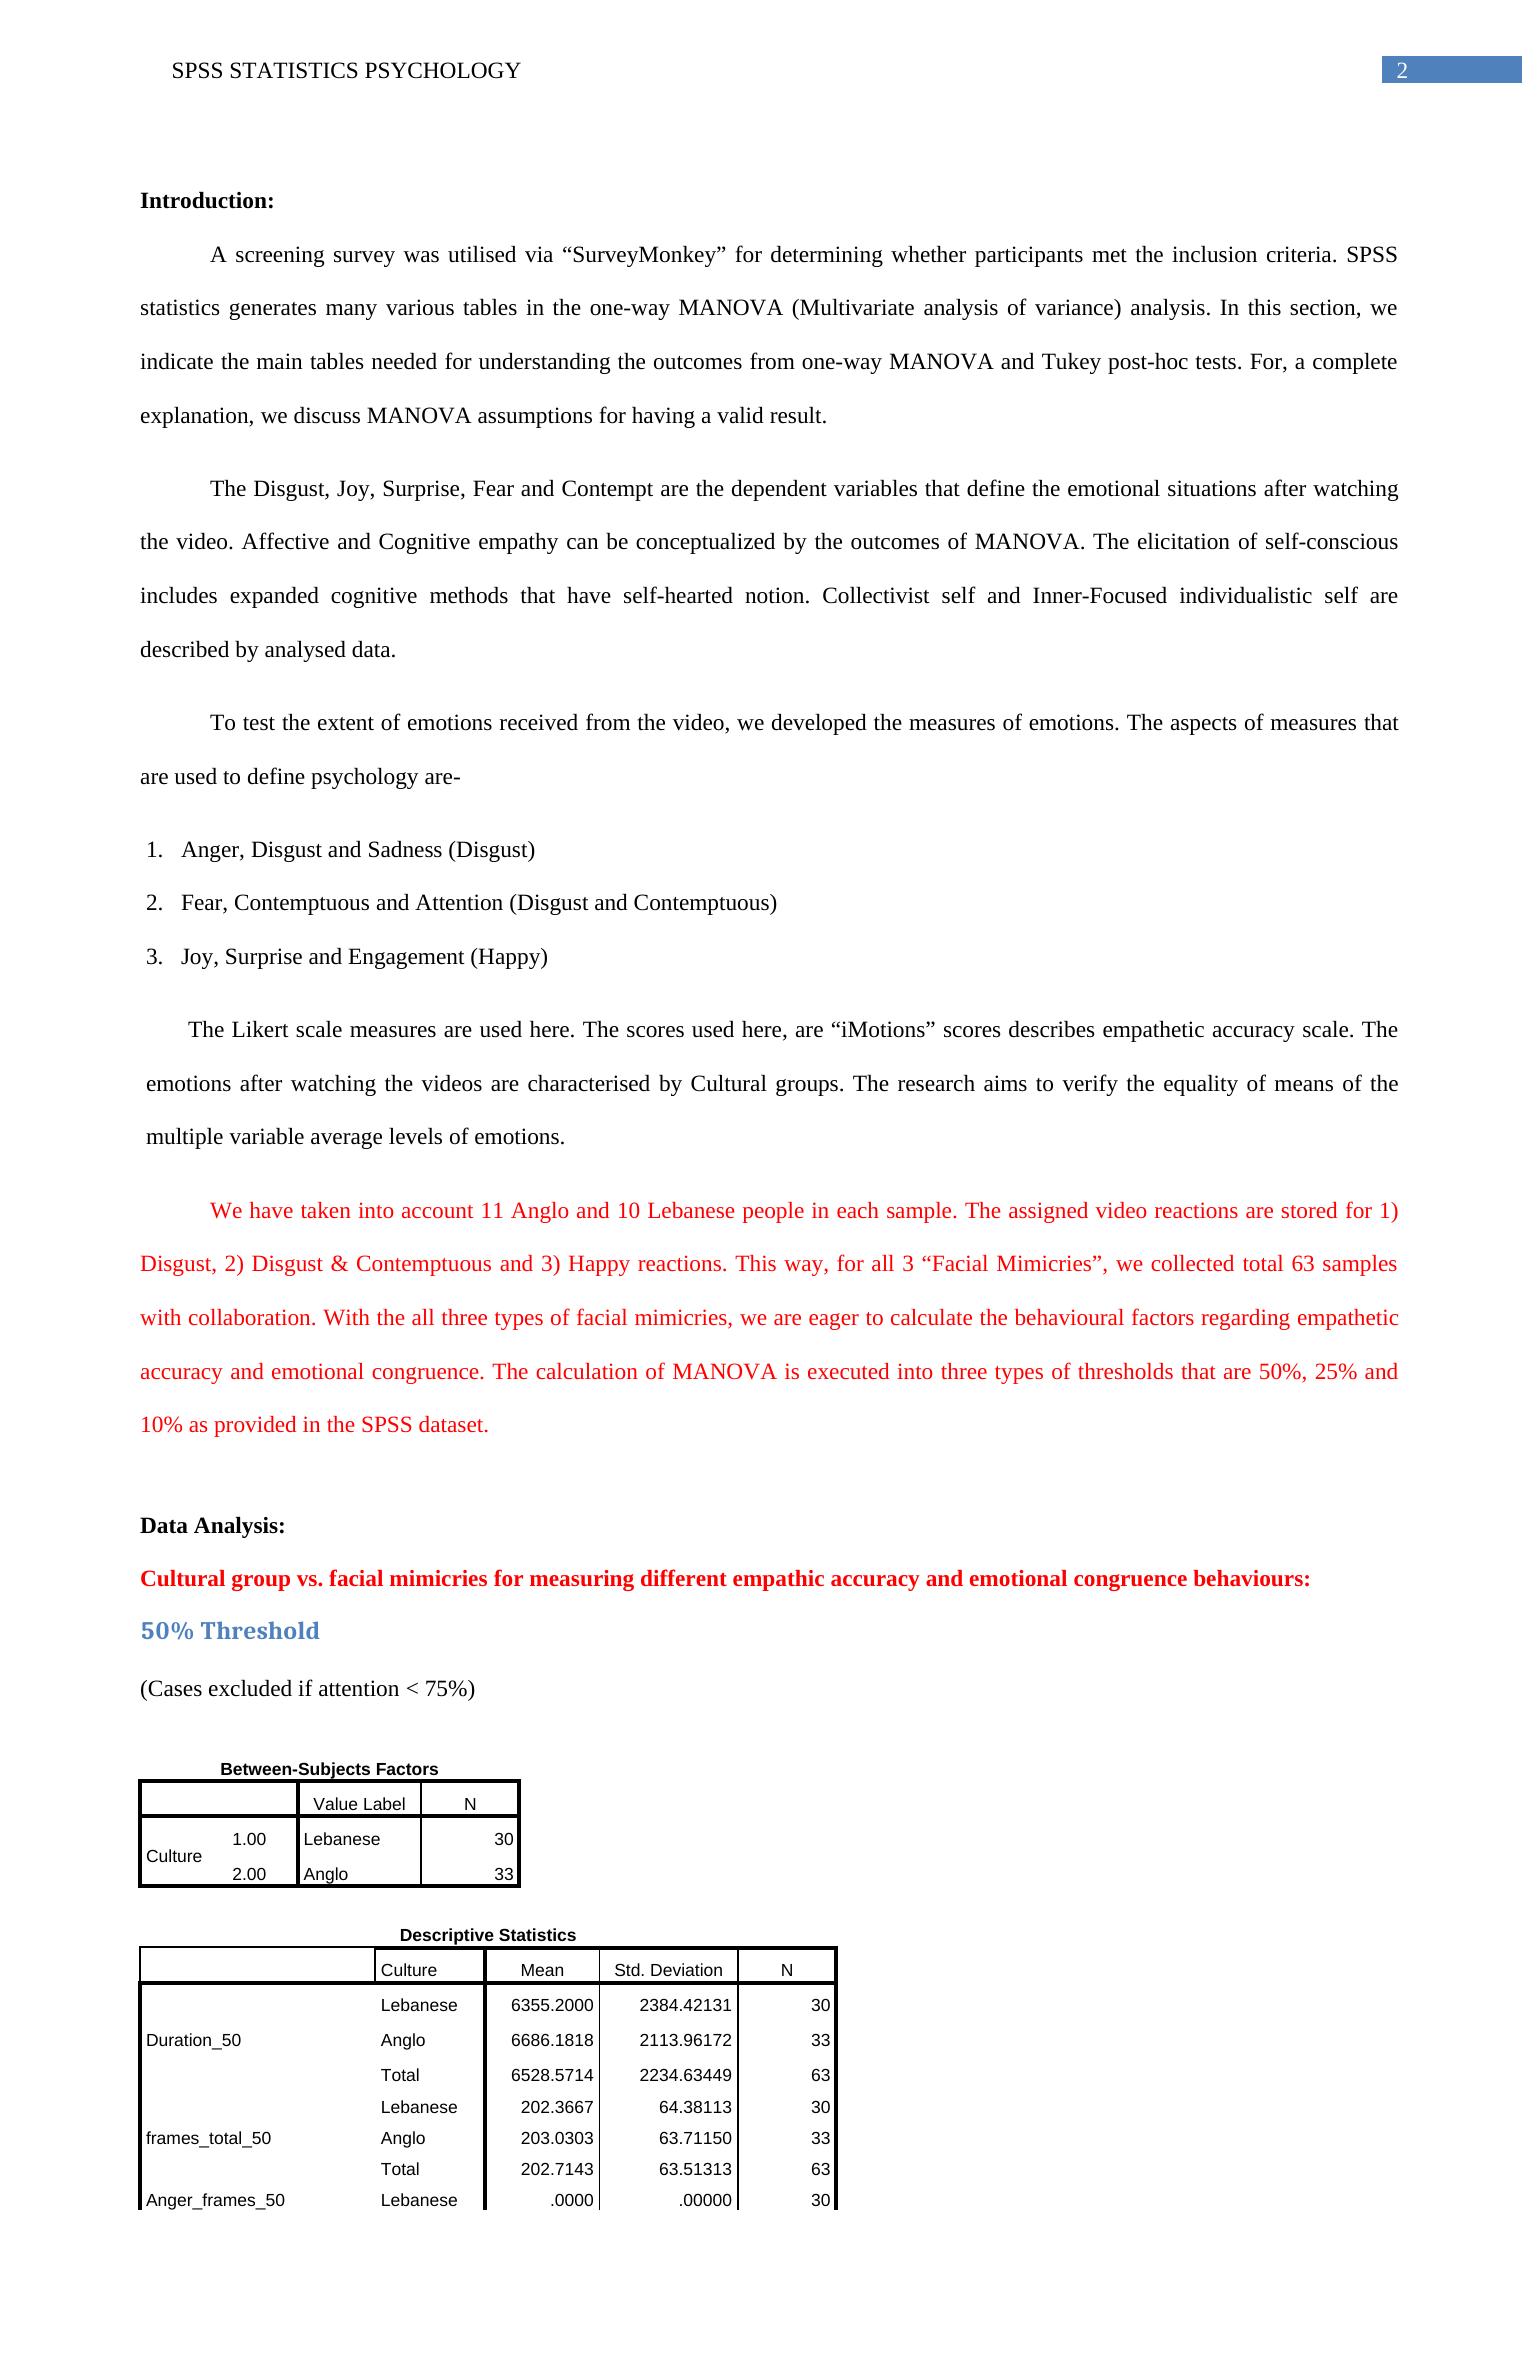
2SPSS STATISTICS PSYCHOLOGYIntroduction:Ascreening survey was utilised via “SurveyMonkey” for determining whether participants met the inclusion criteria. SPSSstatistics generates many various tables in the one-way MANOVA (Multivariate analysis of variance) analysis. In this section, weindicate the main tables needed for understanding the outcomes from one-way MANOVA and Tukey post-hoc tests. For, a completeexplanation, we discuss MANOVA assumptions for having a valid result. The Disgust, Joy, Surprise, Fear and Contempt are the dependent variables that define the emotional situations after watchingthe video. Affective and Cognitive empathy can be conceptualized by the outcomes of MANOVA. The elicitation of self-consciousincludes expanded cognitive methods that have self-hearted notion. Collectivist self and Inner-Focused individualistic self aredescribed by analysed data. To test the extent of emotions received from the video, we developed the measures of emotions. The aspects of measures thatare used to define psychology are-1.Anger, Disgust and Sadness (Disgust) 2.Fear, Contemptuous and Attention (Disgust and Contemptuous)3.Joy, Surprise and Engagement (Happy) The Likert scale measures are used here. The scores used here, are “iMotions” scores describes empathetic accuracy scale. Theemotions after watching the videos are characterised by Cultural groups. The research aims to verify the equality of means of themultiple variable average levels of emotions. We have taken into account 11 Anglo and 10 Lebanese people in each sample. The assigned video reactions are stored for 1)Disgust, 2) Disgust & Contemptuous and 3) Happy reactions. This way, for all 3 “Facial Mimicries”, we collected total 63 sampleswith collaboration. With the all three types of facial mimicries, we are eager to calculate the behavioural factors regarding empatheticaccuracy and emotional congruence. The calculation of MANOVA is executed into three types of thresholds that are 50%, 25% and10% as provided in the SPSS dataset.Data Analysis:Cultural group vs. facial mimicries for measuring different empathic accuracy and emotional congruence behaviours:50% Threshold(Cases excluded if attention < 75%)Between-Subjects FactorsValue LabelNCulture1.00Lebanese302.00Anglo33Descriptive StatisticsCultureMeanStd. DeviationNDuration_50Lebanese6355.20002384.4213130Anglo6686.18182113.9617233Total6528.57142234.6344963frames_total_50Lebanese202.366764.3811330Anglo203.030363.7115033Total202.714363.5131363Anger_frames_50Lebanese.0000.0000030
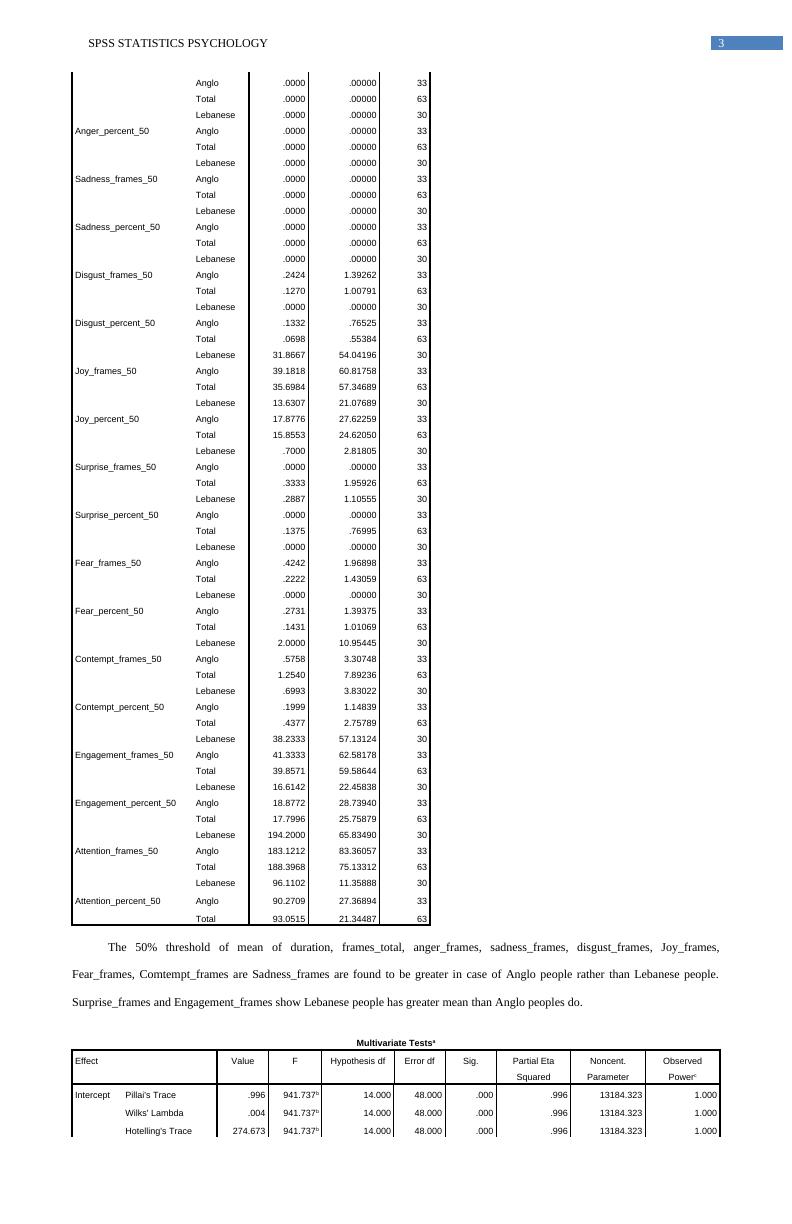
3SPSS STATISTICS PSYCHOLOGYAnglo.0000.0000033Total.0000.0000063Anger_percent_50Lebanese.0000.0000030Anglo.0000.0000033Total.0000.0000063Sadness_frames_50Lebanese.0000.0000030Anglo.0000.0000033Total.0000.0000063Sadness_percent_50Lebanese.0000.0000030Anglo.0000.0000033Total.0000.0000063Disgust_frames_50Lebanese.0000.0000030Anglo.24241.3926233Total.12701.0079163Disgust_percent_50Lebanese.0000.0000030Anglo.1332.7652533Total.0698.5538463Joy_frames_50Lebanese31.866754.0419630Anglo39.181860.8175833Total35.698457.3468963Joy_percent_50Lebanese13.630721.0768930Anglo17.877627.6225933Total15.855324.6205063Surprise_frames_50Lebanese.70002.8180530Anglo.0000.0000033Total.33331.9592663Surprise_percent_50Lebanese.28871.1055530Anglo.0000.0000033Total.1375.7699563Fear_frames_50Lebanese.0000.0000030Anglo.42421.9689833Total.22221.4305963Fear_percent_50Lebanese.0000.0000030Anglo.27311.3937533Total.14311.0106963Contempt_frames_50Lebanese2.000010.9544530Anglo.57583.3074833Total1.25407.8923663Contempt_percent_50Lebanese.69933.8302230Anglo.19991.1483933Total.43772.7578963Engagement_frames_50Lebanese38.233357.1312430Anglo41.333362.5817833Total39.857159.5864463Engagement_percent_50Lebanese16.614222.4583830Anglo18.877228.7394033Total17.799625.7587963Attention_frames_50Lebanese194.200065.8349030Anglo183.121283.3605733Total188.396875.1331263Attention_percent_50Lebanese96.110211.3588830Anglo90.270927.3689433Total93.051521.3448763The 50% threshold of mean of duration, frames_total, anger_frames, sadness_frames, disgust_frames, Joy_frames,Fear_frames, Comtempt_frames are Sadness_frames are found to be greater in case of Anglo people rather than Lebanese people.Surprise_frames and Engagement_frames show Lebanese people has greater mean than Anglo peoples do.Multivariate TestsaEffectValueFHypothesis dfError dfSig.Partial EtaSquaredNoncent.ParameterObservedPowercInterceptPillai's Trace.996941.737b14.00048.000.000.99613184.3231.000Wilks' Lambda.004941.737b14.00048.000.000.99613184.3231.000Hotelling's Trace274.673941.737b14.00048.000.000.99613184.3231.000
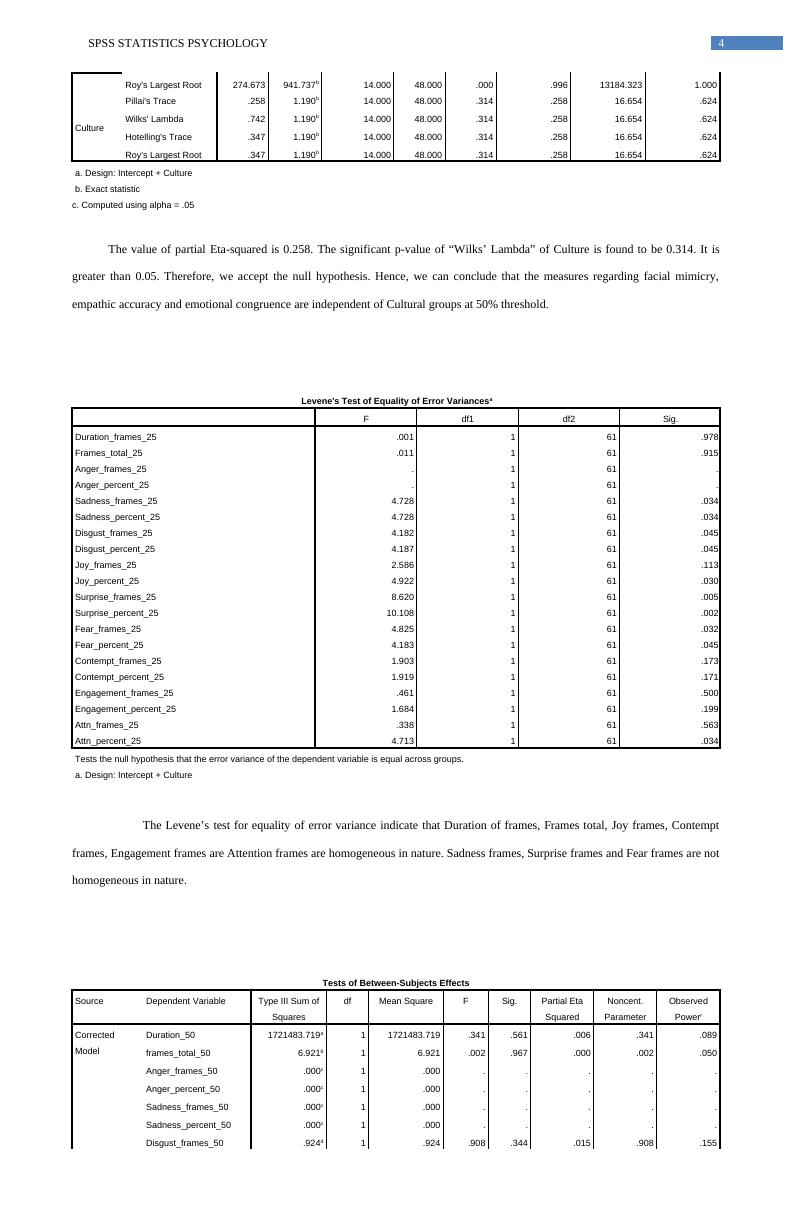
4SPSS STATISTICS PSYCHOLOGYRoy's Largest Root274.673941.737b14.00048.000.000.99613184.3231.000CulturePillai's Trace.2581.190b14.00048.000.314.25816.654.624Wilks' Lambda.7421.190b14.00048.000.314.25816.654.624Hotelling's Trace.3471.190b14.00048.000.314.25816.654.624Roy's Largest Root.3471.190b14.00048.000.314.25816.654.624a. Design: Intercept + Cultureb. Exact statisticc. Computed using alpha = .05 The value of partial Eta-squared is 0.258. The significant p-value of “Wilks’ Lambda” of Culture is found to be 0.314. It isgreater than 0.05. Therefore, we accept the null hypothesis. Hence, we can conclude that the measures regarding facial mimicry,empathic accuracy and emotional congruence are independent of Cultural groups at 50% threshold. Levene's Test of Equality of Error VariancesaFdf1df2Sig.Duration_frames_25.001161.978Frames_total_25.011161.915Anger_frames_25.161.Anger_percent_25.161.Sadness_frames_254.728161.034Sadness_percent_254.728161.034Disgust_frames_254.182161.045Disgust_percent_254.187161.045Joy_frames_252.586161.113Joy_percent_254.922161.030Surprise_frames_258.620161.005Surprise_percent_2510.108161.002Fear_frames_254.825161.032Fear_percent_254.183161.045Contempt_frames_251.903161.173Contempt_percent_251.919161.171Engagement_frames_25.461161.500Engagement_percent_251.684161.199Attn_frames_25.338161.563Attn_percent_254.713161.034Tests the null hypothesis that the error variance of the dependent variable is equal across groups.a. Design: Intercept + Culture The Levene’s test for equality of error variance indicate that Duration of frames, Frames total, Joy frames, Contemptframes, Engagement frames are Attention frames are homogeneous in nature. Sadness frames, Surprise frames and Fear frames are nothomogeneous in nature.Tests of Between-Subjects EffectsSourceDependent VariableType III Sum ofSquaresdfMean SquareFSig.Partial EtaSquaredNoncent.ParameterObservedPowerrCorrected ModelDuration_501721483.719a11721483.719.341.561.006.341.089frames_total_506.921b16.921.002.967.000.002.050Anger_frames_50.000c1.000.....Anger_percent_50.000c1.000.....Sadness_frames_50.000c1.000.....Sadness_percent_50.000c1.000.....Disgust_frames_50.924d1.924.908.344.015.908.155
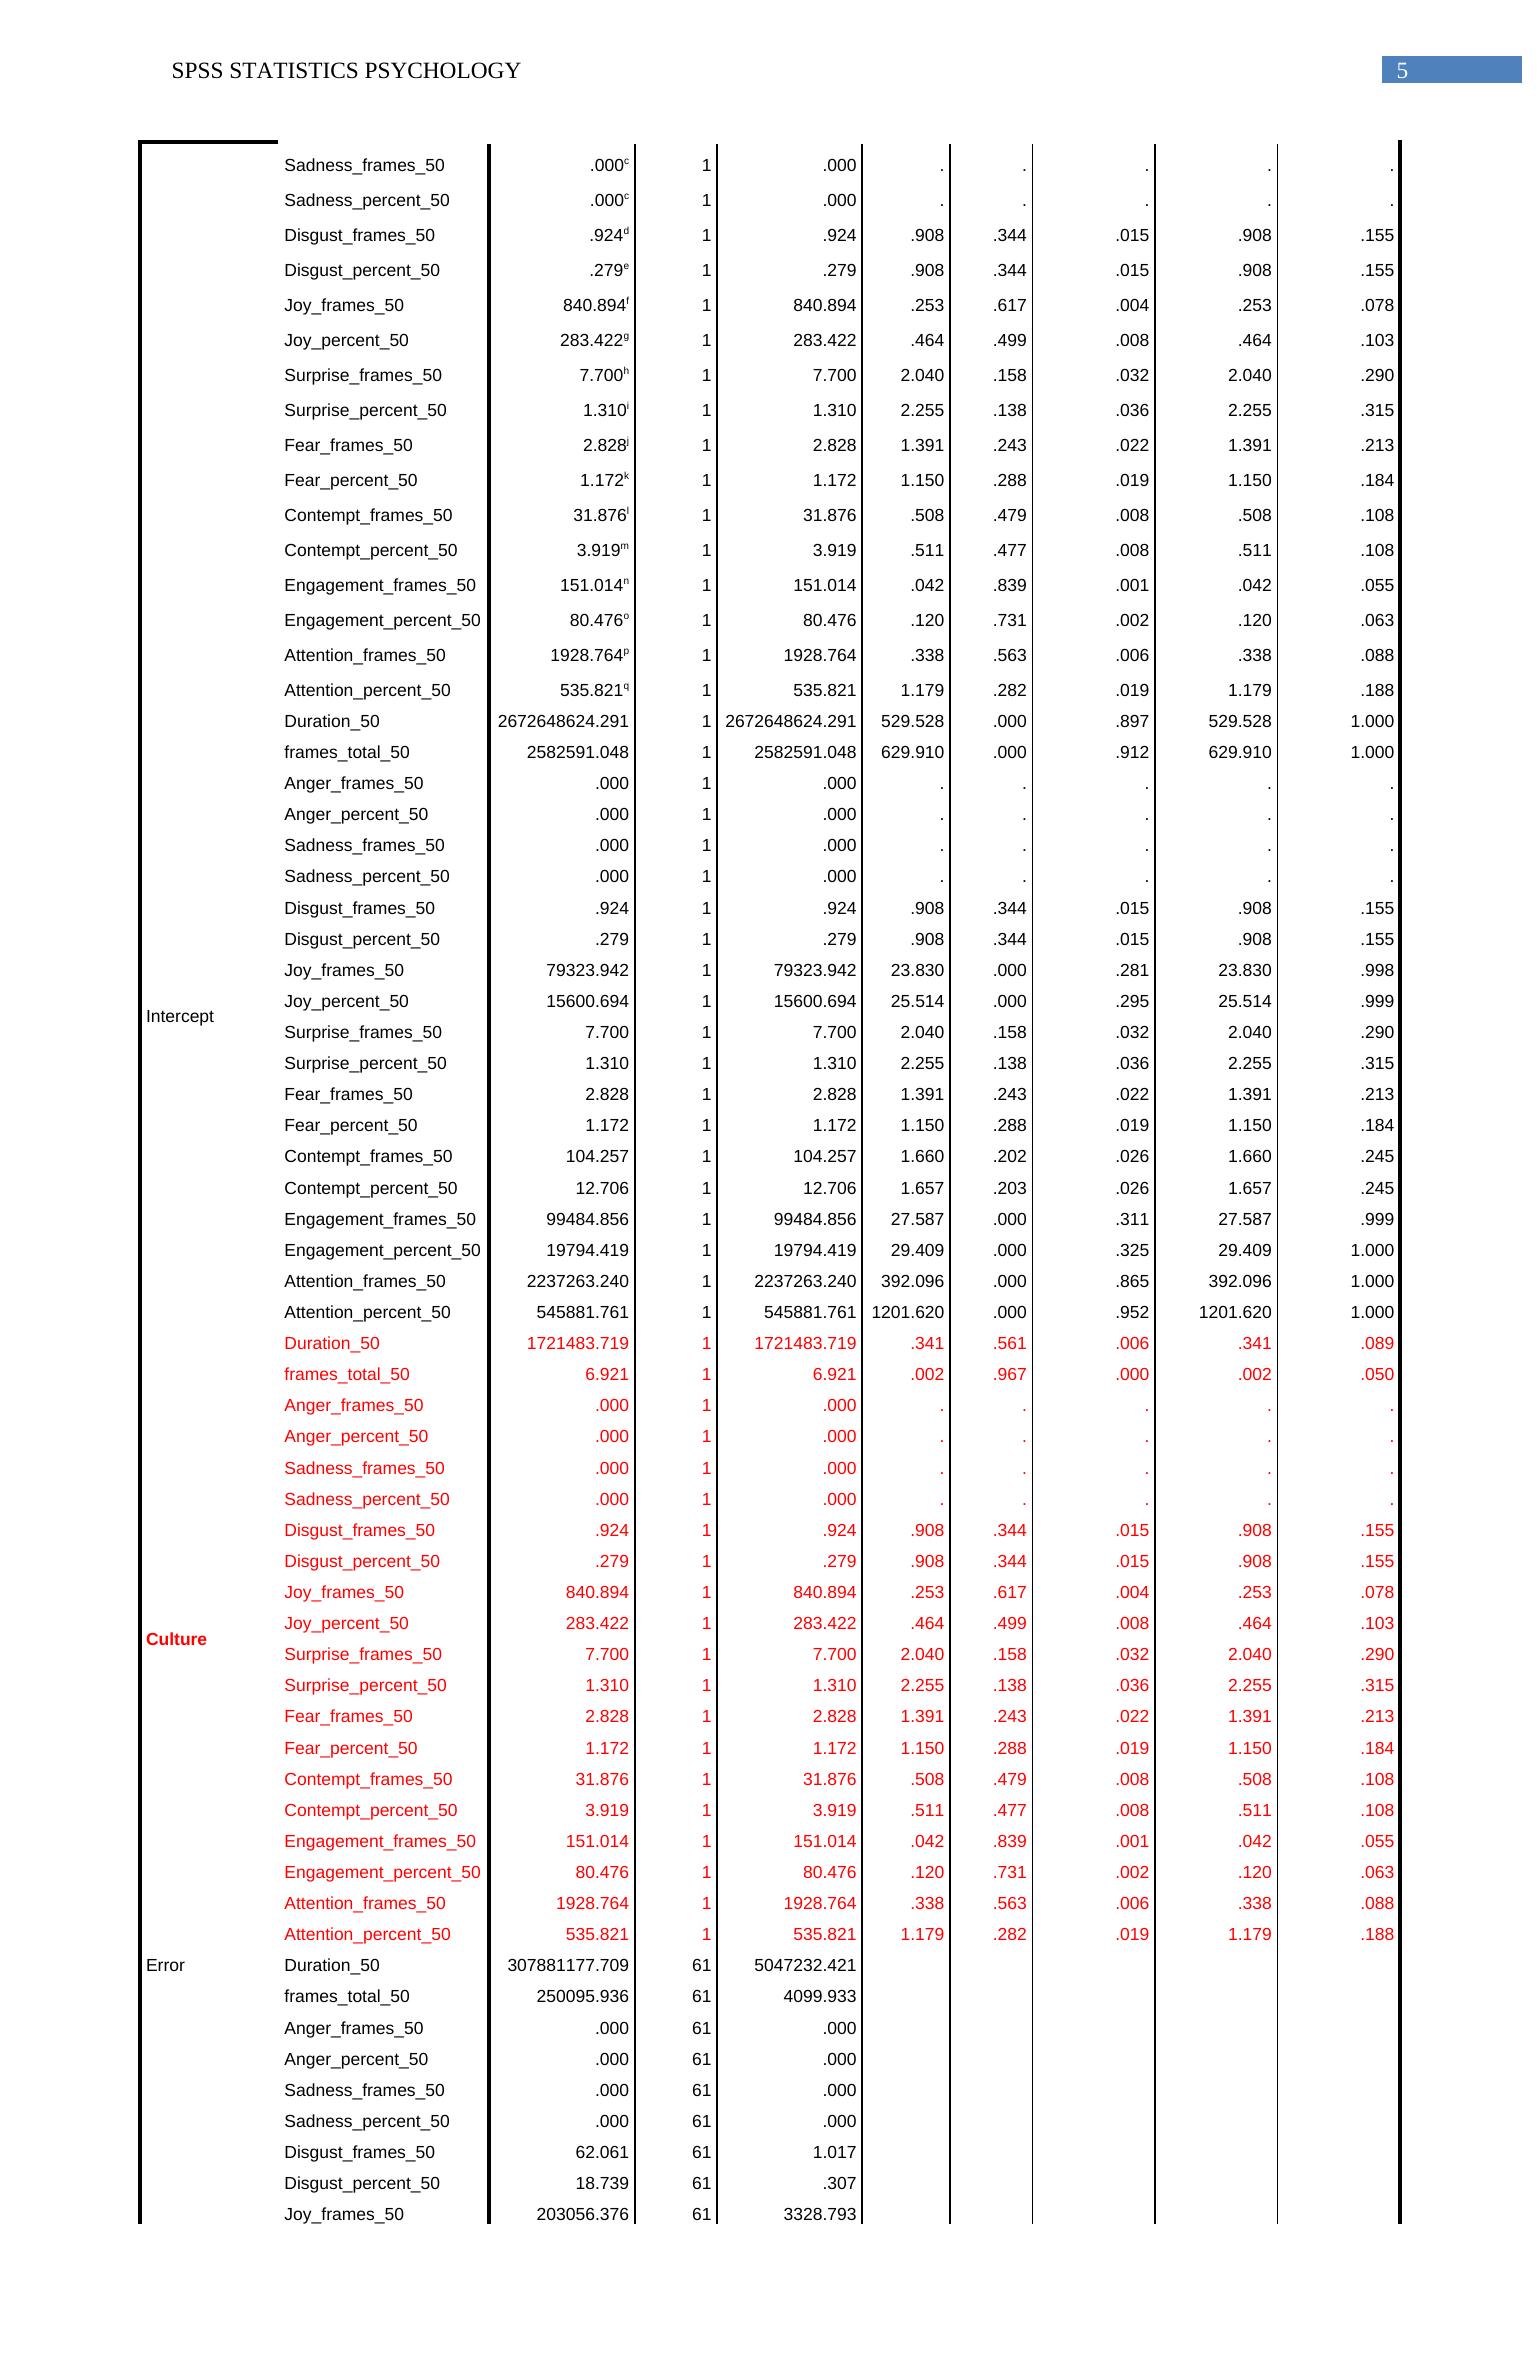
5SPSS STATISTICS PSYCHOLOGYDisgust_percent_50.279e1.279.908.344.015.908.155Joy_frames_50840.894f1840.894.253.617.004.253.078Joy_percent_50283.422g1283.422.464.499.008.464.103Surprise_frames_507.700h17.7002.040.158.0322.040.290Surprise_percent_501.310i11.3102.255.138.0362.255.315Fear_frames_502.828j12.8281.391.243.0221.391.213Fear_percent_501.172k11.1721.150.288.0191.150.184Contempt_frames_5031.876l131.876.508.479.008.508.108Contempt_percent_503.919m13.919.511.477.008.511.108Engagement_frames_50151.014n1151.014.042.839.001.042.055Engagement_percent_5080.476o180.476.120.731.002.120.063Attention_frames_501928.764p11928.764.338.563.006.338.088Attention_percent_50535.821q1535.8211.179.282.0191.179.188InterceptDuration_502672648624.29112672648624.291529.528.000.897529.5281.000frames_total_502582591.04812582591.048629.910.000.912629.9101.000Anger_frames_50.0001.000.....Anger_percent_50.0001.000.....Sadness_frames_50.0001.000.....Sadness_percent_50.0001.000.....Disgust_frames_50.9241.924.908.344.015.908.155Disgust_percent_50.2791.279.908.344.015.908.155Joy_frames_5079323.942179323.94223.830.000.28123.830.998Joy_percent_5015600.694115600.69425.514.000.29525.514.999Surprise_frames_507.70017.7002.040.158.0322.040.290Surprise_percent_501.31011.3102.255.138.0362.255.315Fear_frames_502.82812.8281.391.243.0221.391.213Fear_percent_501.17211.1721.150.288.0191.150.184Contempt_frames_50104.2571104.2571.660.202.0261.660.245Contempt_percent_5012.706112.7061.657.203.0261.657.245Engagement_frames_5099484.856199484.85627.587.000.31127.587.999Engagement_percent_5019794.419119794.41929.409.000.32529.4091.000Attention_frames_502237263.24012237263.240392.096.000.865392.0961.000Attention_percent_50545881.7611545881.7611201.620.000.9521201.6201.000CultureDuration_501721483.71911721483.719.341.561.006.341.089frames_total_506.92116.921.002.967.000.002.050Anger_frames_50.0001.000.....Anger_percent_50.0001.000.....Sadness_frames_50.0001.000.....Sadness_percent_50.0001.000.....Disgust_frames_50.9241.924.908.344.015.908.155Disgust_percent_50.2791.279.908.344.015.908.155Joy_frames_50840.8941840.894.253.617.004.253.078Joy_percent_50283.4221283.422.464.499.008.464.103Surprise_frames_507.70017.7002.040.158.0322.040.290Surprise_percent_501.31011.3102.255.138.0362.255.315Fear_frames_502.82812.8281.391.243.0221.391.213Fear_percent_501.17211.1721.150.288.0191.150.184Contempt_frames_5031.876131.876.508.479.008.508.108Contempt_percent_503.91913.919.511.477.008.511.108Engagement_frames_50151.0141151.014.042.839.001.042.055Engagement_percent_5080.476180.476.120.731.002.120.063Attention_frames_501928.76411928.764.338.563.006.338.088Attention_percent_50535.8211535.8211.179.282.0191.179.188ErrorDuration_50307881177.709615047232.421frames_total_50250095.936614099.933Anger_frames_50.00061.000Anger_percent_50.00061.000Sadness_frames_50.00061.000Sadness_percent_50.00061.000Disgust_frames_5062.061611.017Disgust_percent_5018.73961.307Joy_frames_50203056.376613328.793Joy_percent_5037299.05561611.460Surprise_frames_50230.300613.775Surprise_percent_5035.44561.581
End of preview
Want to access all the pages? Upload your documents or become a member.