STA101: Statistics for Business - Quiz Scores, Confidence Interval, Regression Analysis and Hypothesis Testing
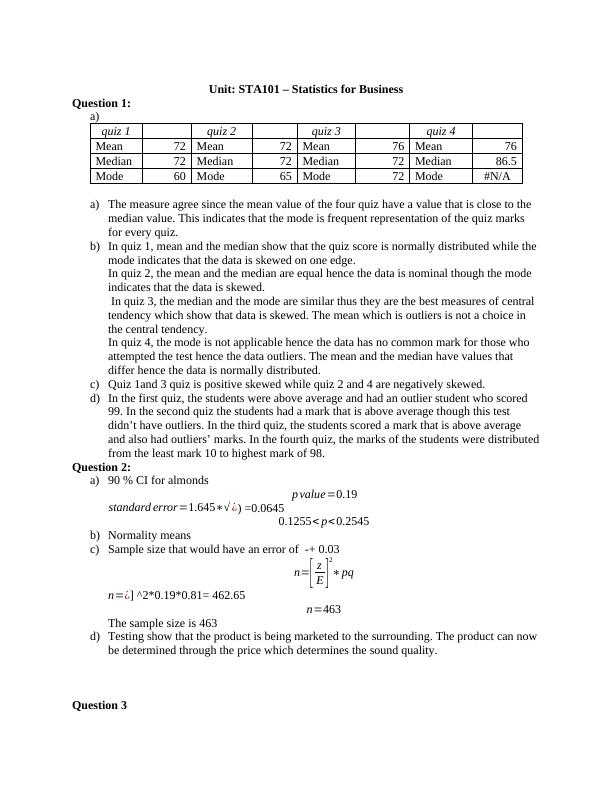
Answering questions related to mean, median, mode, and symmetry of data sets.
2 Pages734 Words311 Views
Added on 2023-06-11
About This Document
This article covers topics related to Statistics for Business including quiz scores, confidence interval, regression analysis and hypothesis testing. It includes measures of central tendency, normality, sample size calculation, coefficient significance, R-squared value, hypothesis testing and error types.
STA101: Statistics for Business - Quiz Scores, Confidence Interval, Regression Analysis and Hypothesis Testing
Answering questions related to mean, median, mode, and symmetry of data sets.
Added on 2023-06-11
ShareRelated Documents
End of preview
Want to access all the pages? Upload your documents or become a member.
STA101 : Statistics for Business
|6
|1040
|78
Analysis of Mean, Median, Mode and Confidence Interval in Statistics
|3
|743
|260
Statistics for Business Decision - Assignment
|5
|867
|36
Sample Assignment on Statistics
|8
|1033
|94
Statistics: Measures of Centers, Confidence Interval, Regression and Hypothesis Testing
|9
|1219
|281
Assignment on Statistics Questions
|9
|1235
|173