Stakeholder Theory and Carbon Emissions: An Analysis of USA Companies
VerifiedAdded on 2023/06/05
|25
|6070
|415
AI Summary
This research paper analyzes the impact of stakeholder theory on carbon emissions by USA companies. It evaluates the changes in carbon emissions by companies providing incentives to management and those that do not. The paper includes a conceptual model, hypotheses, and descriptive data analysis.
Contribute Materials
Your contribution can guide someone’s learning journey. Share your
documents today.
MGT723 Research Project
Semester X 20XX
Assessment Task 3: Report
Student Name: XXXXX
Title: XXXXX
Submission Date: XXXXX
(Note that the submission is due by 5:00pm via SafeAssign)
Acknowledgement:
I certify that I have carefully reviewed the university’s academic misconduct policy. I understand
that the source of ideas must be referenced and that quotation marks and a reference are required
when directly quoting anyone else’s words.
Secure Best Marks with AI Grader
Need help grading? Try our AI Grader for instant feedback on your assignments.
Introduction: (Not assessed)
Carbon emissions are one of the major problems in the environment today globally.
Emissions of carbon have been affecting the industries greatly. In this research, the stakeholder
theory will be discussed with effect to the carbon emissions. There are certain theoretical as well
as practical motivations to this concept of carbon emissions in accordance with the stakeholder
theory. The research is mainly aimed at evaluating the changes in the emissions of carbon by the
companies.
Literature Review: (Not assessed)
In view of dependence on carbon-based utilities, our atmosphere is changing quickly and
it's a remediable issue of the present corporate world. Organizations convey and discharge a huge
measure of carbon in the earth in perspective of their radiation of taking care of plant abuse in
pointless aggregate and a section of the ruinous fabricated blends utilized as a bit of storing up of
the thing. Nowadays the organizations also end up being extremely aware of the need to make a
move on environmental change.
The Stakeholder got a huge influence on the organization. According to Donaldsom and
Preston (1995), “Stakeholder theory has been used to describe (a) the nature of the firm (Brenner
and Cochran, 1991), (b) the way managers think about managing (Brenner and Molander, 1977),
(c) how board members think about the interests of corporate con stridencies (Wang and
Dewhirst, 1992), and (d) how some corporations are actually managed (Clarkson, 1995; Halal,
1990; Kreiner and Bhambri, 1991)”. There is not much disagreement on what kind of entity can
be a stakeholder. Persons, groups, neighborhoods, organizations, institutions, societies, and even
the natural environment are generally thought to qualify as actual or potential stakeholders
(Mitchell and Agle, 1997). One investor's advantage is to expand the benefits and lessen the
useless exercises from the business in here and now, yet the primary focus of association ought
to be to deal with the prerequisites and meet the desires for Stakeholder (George, 2003). The
primary individuals who ring a bell while considering who holds the stakes at an association are
the Shareholder and the government. Other than the undeniable, Stakeholder consolidates each
one of those exercises and responsibilities affects association execution, like laborers, customers,
and business accomplices (Bridoux and Stoelhorst, 2014).
Analyses have also shown that the associations in the USA transmit a massive proportion
of carbon into the air. 23 – 24 % of the carbon Dioxide transmitted by the corporate firms
wherever all through the world start with the USA associations. The USA uses oil-based goods
to make essentialness and subsequently, the surge of carbon in the atmosphere by the USA firms
are high (Jones and Wicks, 1999). This examination paper is thusly away to work up the
capabilities in the rate changes in the arrival of carbon by the relationship in the context of USA
as for the presentation of jolts that a few affiliations accommodate the association and some
others don't. The adjustments in the arrival of carbon dioxidehave been assessed in a rating scale
from the year 2012 to 2013. The choice of the relationship in the spread of carbon dioxide is all
things considered in the context of the impact the accessories play on the affiliations.
Considering the choice of the accessories, the affiliations will pick whether to give influencing
forces to the association or not.
Conceptual Model: (Not Assessed)
IndependentvariableUSAcompaniesprovidingincentivestControlveribleLocationofthecompany(UDependentveriablePercentagechangesincarbon
Hypotheses: (Not assessed)
1) H01: No significant difference exists between the company provide incentive in 2012
with the companies do not provide incentive in 2012 on percentage changes in carbon
emissions.(Null)
H11: There is statistically significant difference that exists between the companies who
provide incentive in 2012 and the companies who do not provide incentive in 2012 on
percentage changes in carbon emissions. (Alternative)
2) H02: No significant difference exists between the company provide incentive in 2013
with the companies do not provide incentive in 2013 on percentage changes in carbon
emissions. (Null)
H12: There is statistically significant difference that exists between the companies who
provide incentive in 2013 and the companies who do not provide incentive in 2013 on
percentage changes in carbon emissions. (Alternative)
3) H03: No significant difference exists between the company provide incentive in 2012
and the companies who provide incentive in 2013 on percentage changes in carbon
emissions. (Null)
H13: There is statistically significant difference that exists between the companies who
provide incentive in 2012 and the companies who provide incentive in 2013 on
percentage changes in carbon emissions. (Alternative)
4) H04: No significant difference exists between the company who do not provide
incentive in 2013 and the companies who do not provide incentive in 2013 on percentage
changes in carbon emissions. (Null)
H14: There is statistically significant difference that exists between the companies who
do not provide incentive in 2013 and the companies who do not provide incentive in 2013
on percentage changes in carbon emissions. (Alternative)
Secure Best Marks with AI Grader
Need help grading? Try our AI Grader for instant feedback on your assignments.
5) H05: No significant difference exists between the company provide incentive in 2012
and the companies who do not provide incentive in 2013 on percentage changes in carbon
emissions. (Null)
H15: There is statistically significant difference that exists between the companies who
provide incentive in 2012 and the companies who do not provide incentive in 2013 on
percentage changes in carbon emissions. (Alternative)
6) H06: No significant difference exists between the company who do not provide
incentive in 2012 and the companies who do not provide incentive in 2013 on percentage
changes in carbon emissions. (Null)
H16: There is statistically significant difference that exists between the companies who
do not provide incentive in 2012 and the companies who do not provide incentive in 2013
on percentage changes in carbon emissions. (Alternative)
Data Analysis – Descriptive (Not assessed)
Trend Analysis
-600
-500
-400
-300
-200
-100
0
100
Company provide incentives for the management
of climate change issue including the attainment,
of targets in and2012 2013.
2012
2013
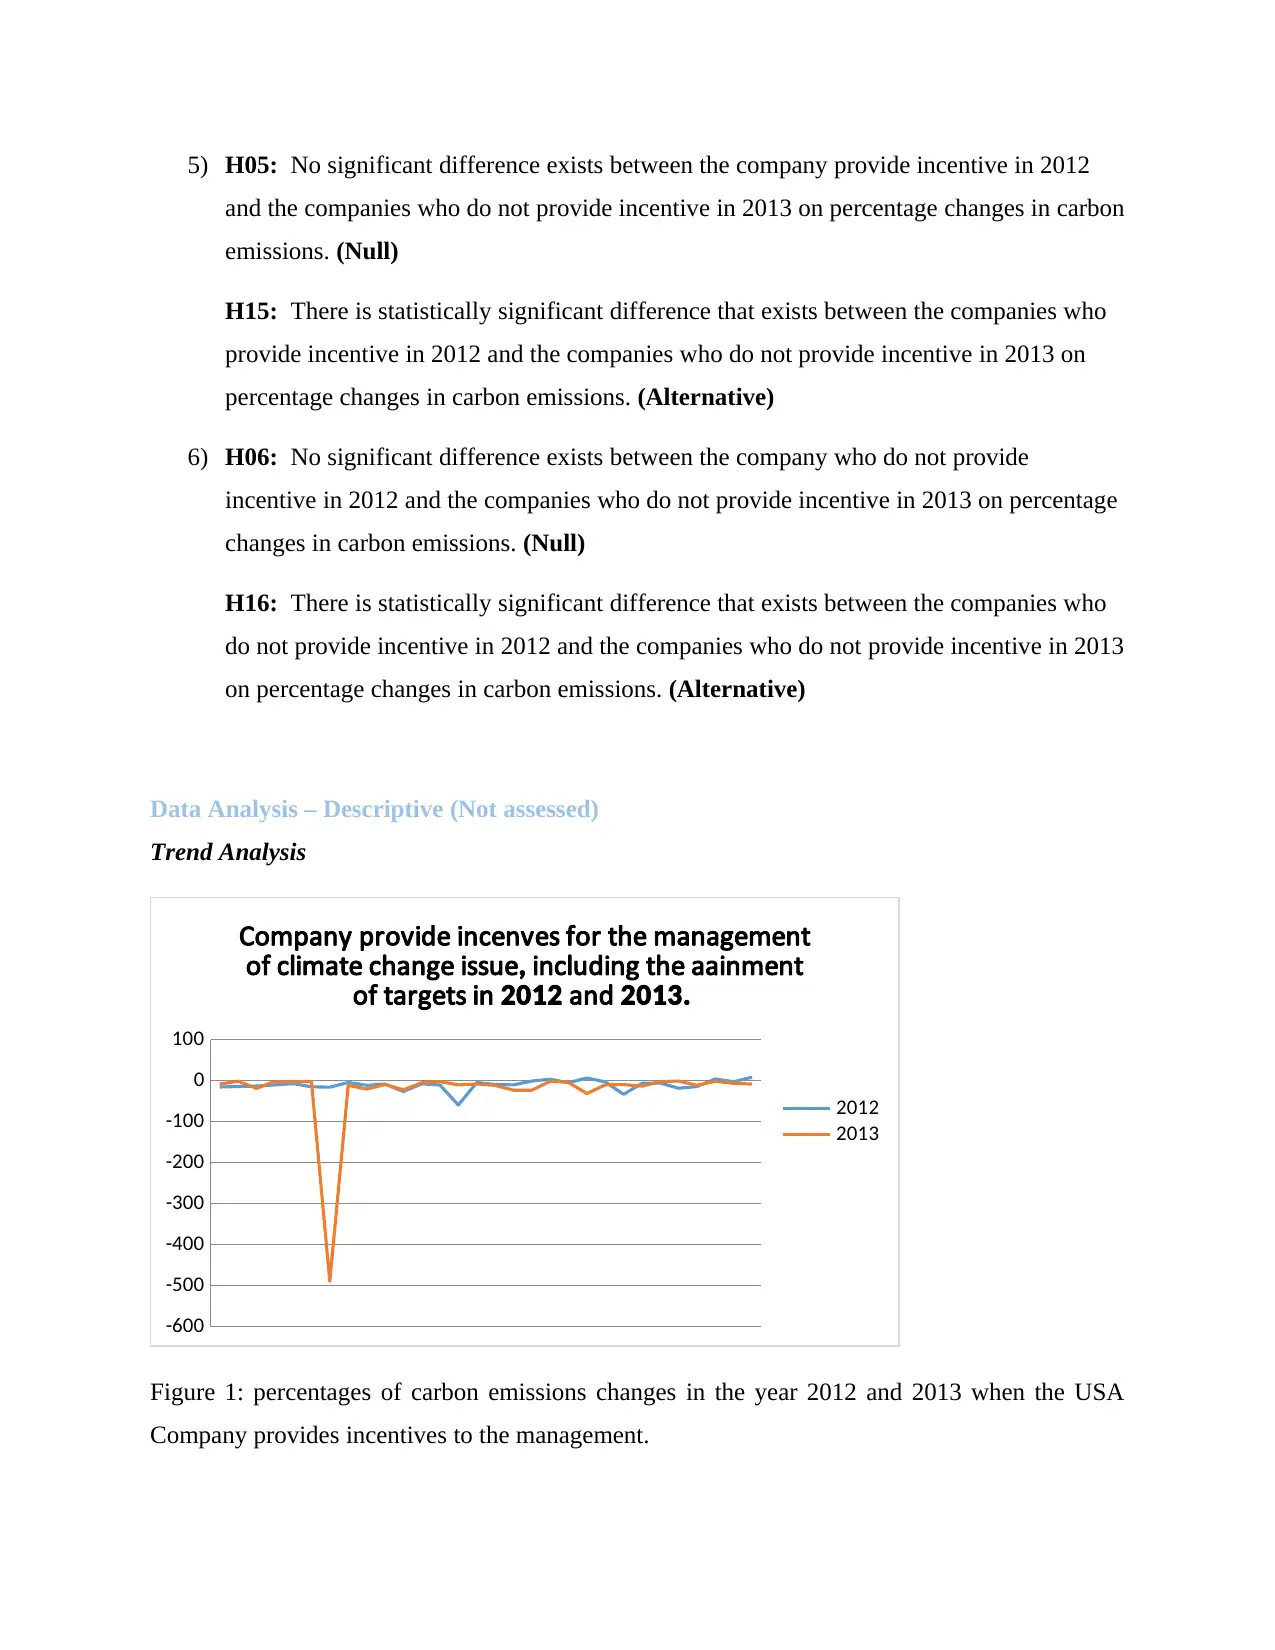
Figure 1: percentages of carbon emissions changes in the year 2012 and 2013 when the USA
Company provides incentives to the management.
and the companies who do not provide incentive in 2013 on percentage changes in carbon
emissions. (Null)
H15: There is statistically significant difference that exists between the companies who
provide incentive in 2012 and the companies who do not provide incentive in 2013 on
percentage changes in carbon emissions. (Alternative)
6) H06: No significant difference exists between the company who do not provide
incentive in 2012 and the companies who do not provide incentive in 2013 on percentage
changes in carbon emissions. (Null)
H16: There is statistically significant difference that exists between the companies who
do not provide incentive in 2012 and the companies who do not provide incentive in 2013
on percentage changes in carbon emissions. (Alternative)
Data Analysis – Descriptive (Not assessed)
Trend Analysis
-600
-500
-400
-300
-200
-100
0
100
Company provide incentives for the management
of climate change issue including the attainment,
of targets in and2012 2013.
2012
2013
Figure 1: percentages of carbon emissions changes in the year 2012 and 2013 when the USA
Company provides incentives to the management.
The trend in 2012 and 2013 can be seen to be almost similar to one of the companies had an
impressive change in the percentages of carbon emissions of -489.04 and which is considered as
outliers.
-100
-80
-60
-40
-20
0
20
40
Company does not provide incentives for the
management of climate change issue including,
the attainment of targets in and2012 2013.
2012 2013
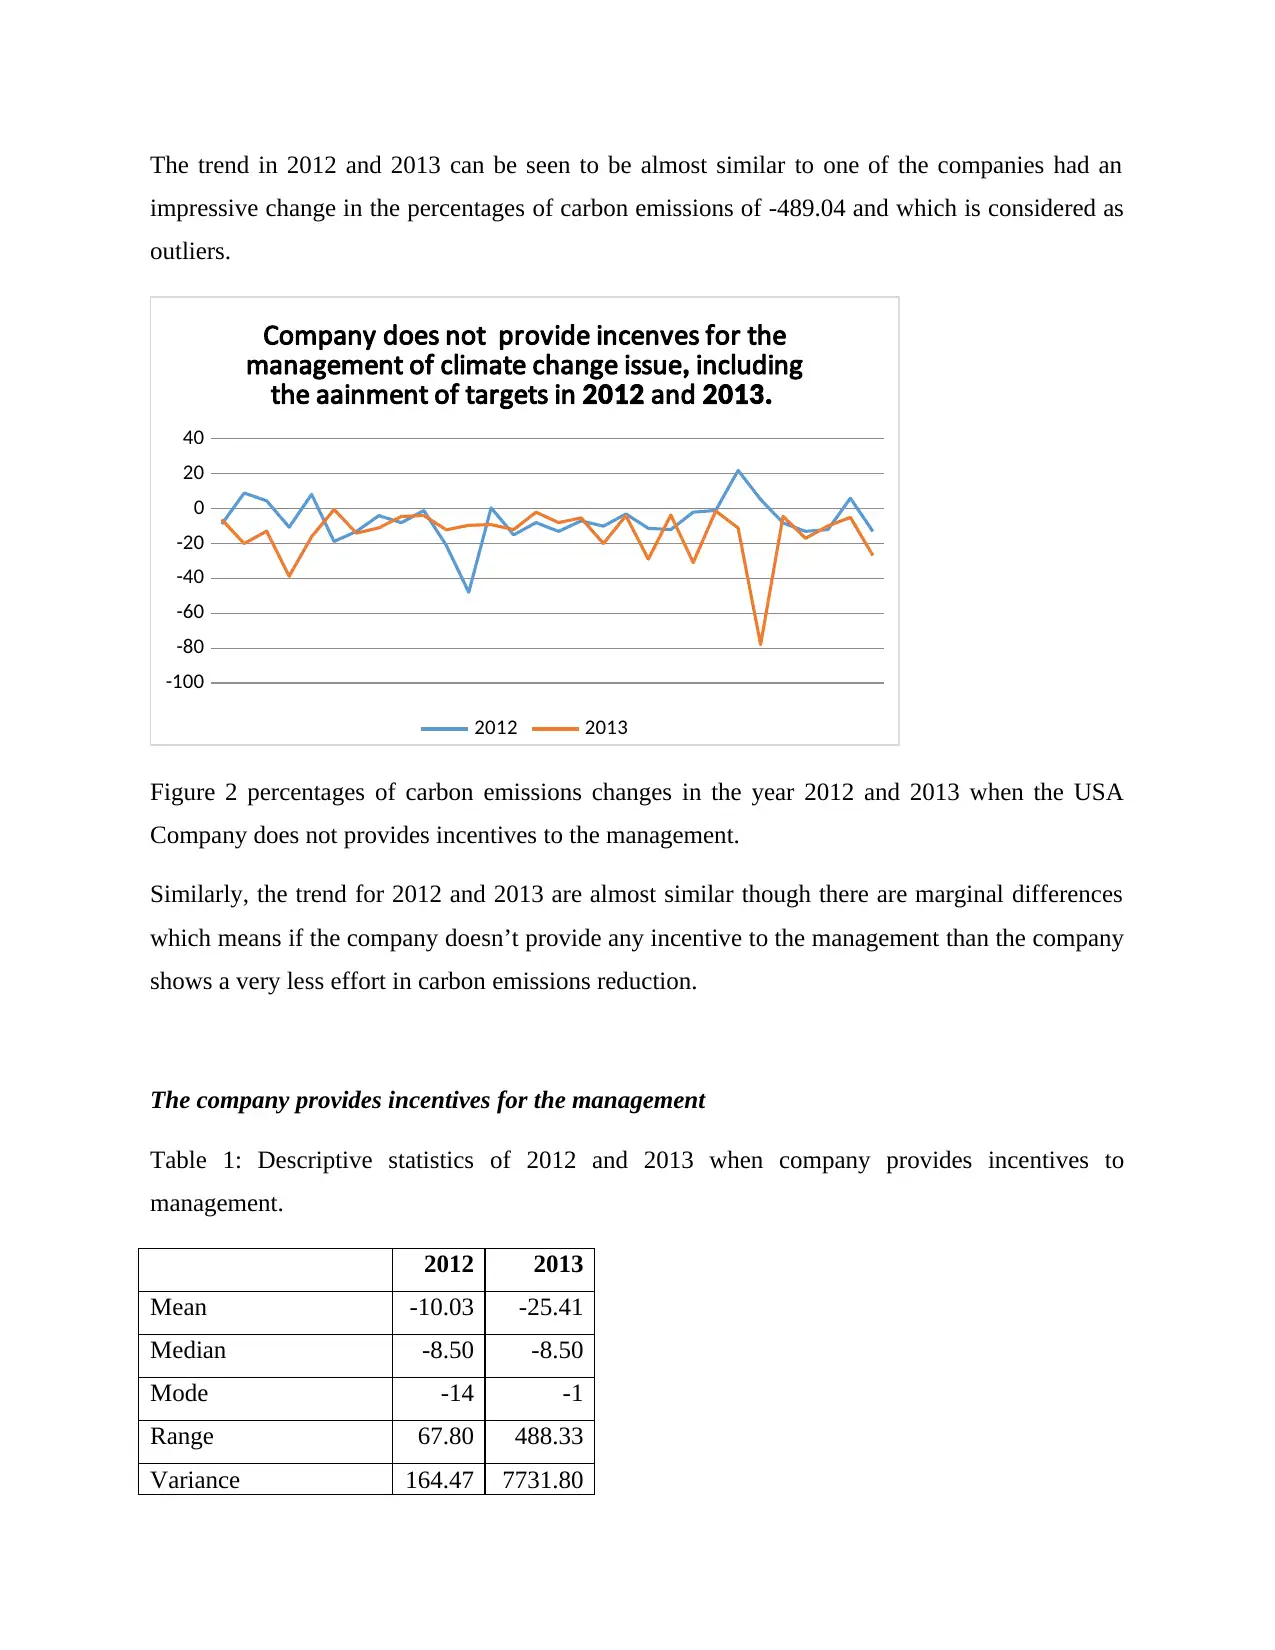
Figure 2 percentages of carbon emissions changes in the year 2012 and 2013 when the USA
Company does not provides incentives to the management.
Similarly, the trend for 2012 and 2013 are almost similar though there are marginal differences
which means if the company doesn’t provide any incentive to the management than the company
shows a very less effort in carbon emissions reduction.
The company provides incentives for the management
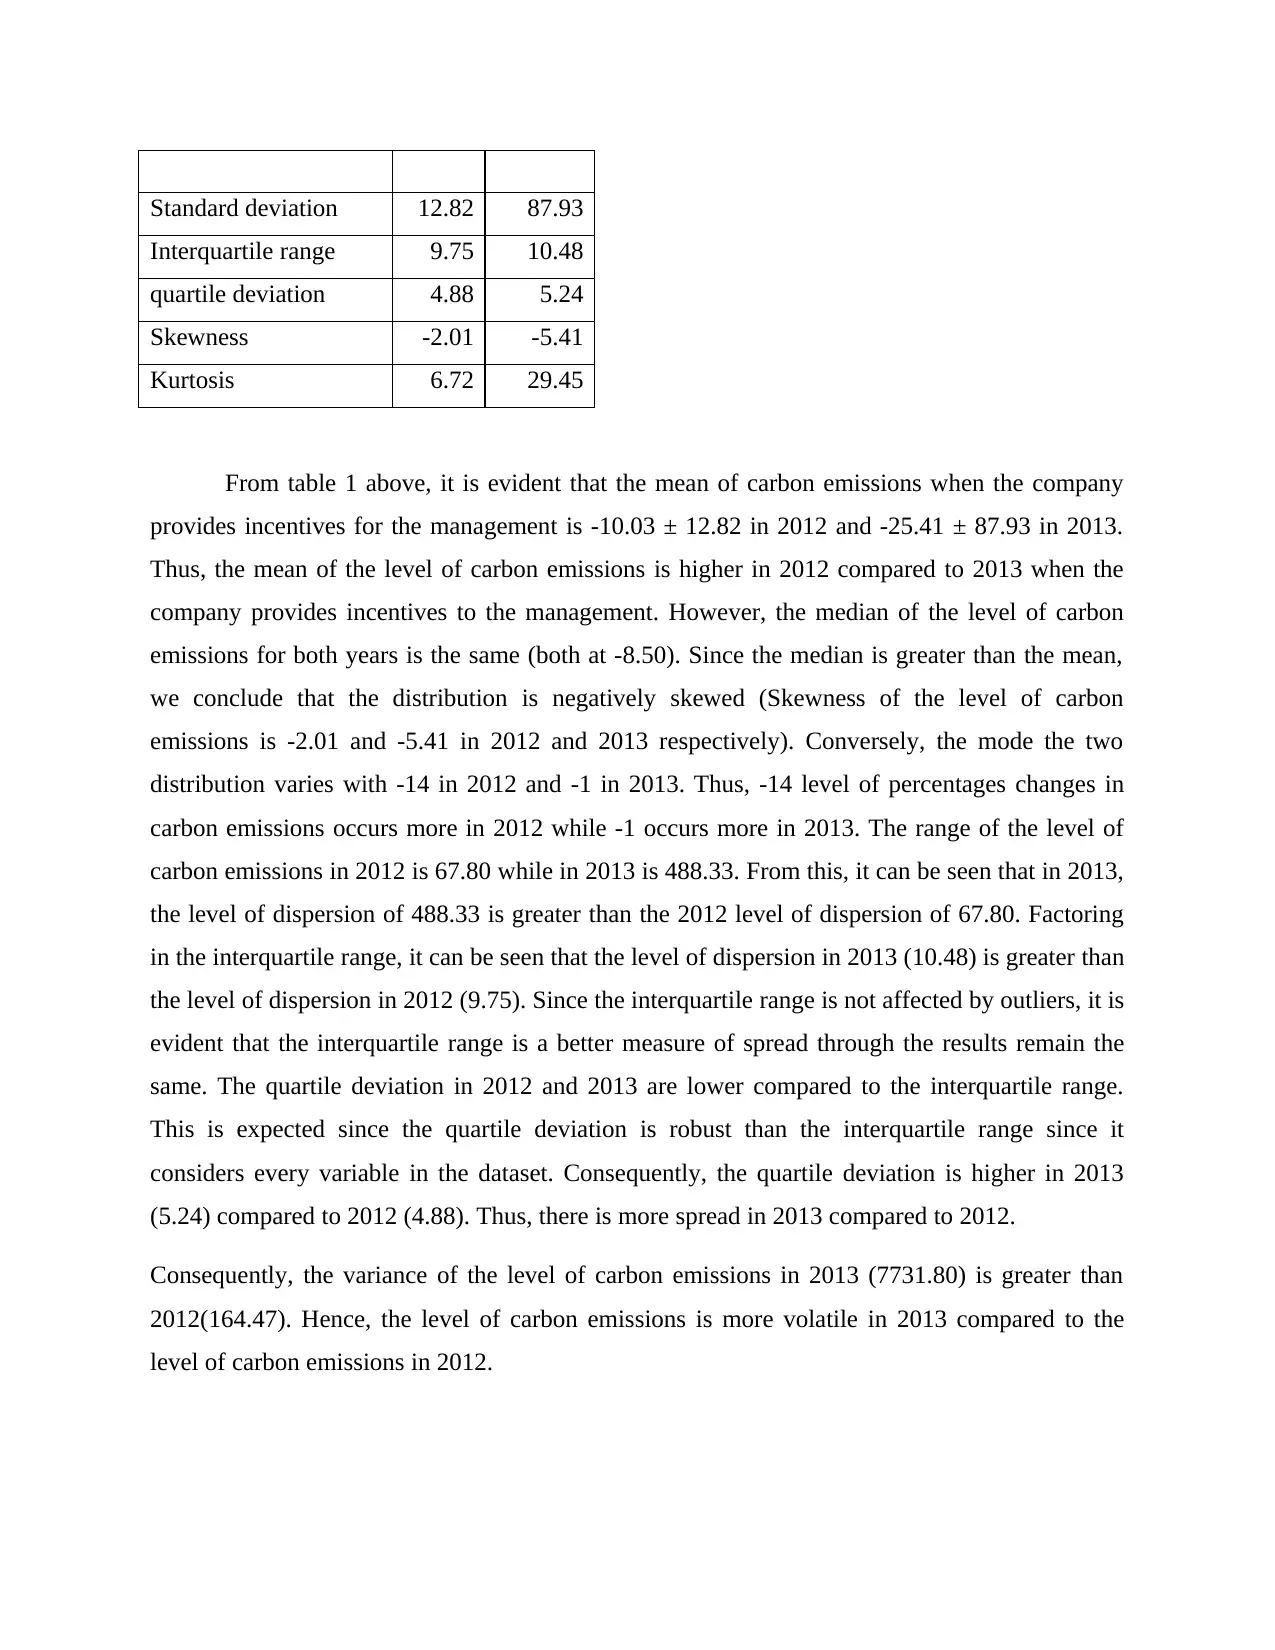
Table 1: Descriptive statistics of 2012 and 2013 when company provides incentives to
management.
2012 2013
Mean -10.03 -25.41
Median -8.50 -8.50
Mode -14 -1
Range 67.80 488.33
Variance 164.47 7731.80
impressive change in the percentages of carbon emissions of -489.04 and which is considered as
outliers.
-100
-80
-60
-40
-20
0
20
40
Company does not provide incentives for the
management of climate change issue including,
the attainment of targets in and2012 2013.
2012 2013
Figure 2 percentages of carbon emissions changes in the year 2012 and 2013 when the USA
Company does not provides incentives to the management.
Similarly, the trend for 2012 and 2013 are almost similar though there are marginal differences
which means if the company doesn’t provide any incentive to the management than the company
shows a very less effort in carbon emissions reduction.
The company provides incentives for the management
Table 1: Descriptive statistics of 2012 and 2013 when company provides incentives to
management.
2012 2013
Mean -10.03 -25.41
Median -8.50 -8.50
Mode -14 -1
Range 67.80 488.33
Variance 164.47 7731.80
Standard deviation 12.82 87.93
Interquartile range 9.75 10.48
quartile deviation 4.88 5.24
Skewness -2.01 -5.41
Kurtosis 6.72 29.45
From table 1 above, it is evident that the mean of carbon emissions when the company
provides incentives for the management is -10.03 ± 12.82 in 2012 and -25.41 ± 87.93 in 2013.
Thus, the mean of the level of carbon emissions is higher in 2012 compared to 2013 when the
company provides incentives to the management. However, the median of the level of carbon
emissions for both years is the same (both at -8.50). Since the median is greater than the mean,
we conclude that the distribution is negatively skewed (Skewness of the level of carbon
emissions is -2.01 and -5.41 in 2012 and 2013 respectively). Conversely, the mode the two
distribution varies with -14 in 2012 and -1 in 2013. Thus, -14 level of percentages changes in
carbon emissions occurs more in 2012 while -1 occurs more in 2013. The range of the level of
carbon emissions in 2012 is 67.80 while in 2013 is 488.33. From this, it can be seen that in 2013,
the level of dispersion of 488.33 is greater than the 2012 level of dispersion of 67.80. Factoring
in the interquartile range, it can be seen that the level of dispersion in 2013 (10.48) is greater than
the level of dispersion in 2012 (9.75). Since the interquartile range is not affected by outliers, it is
evident that the interquartile range is a better measure of spread through the results remain the
same. The quartile deviation in 2012 and 2013 are lower compared to the interquartile range.
This is expected since the quartile deviation is robust than the interquartile range since it
considers every variable in the dataset. Consequently, the quartile deviation is higher in 2013
(5.24) compared to 2012 (4.88). Thus, there is more spread in 2013 compared to 2012.
Consequently, the variance of the level of carbon emissions in 2013 (7731.80) is greater than
2012(164.47). Hence, the level of carbon emissions is more volatile in 2013 compared to the
level of carbon emissions in 2012.
Paraphrase This Document
Need a fresh take? Get an instant paraphrase of this document with our AI Paraphraser
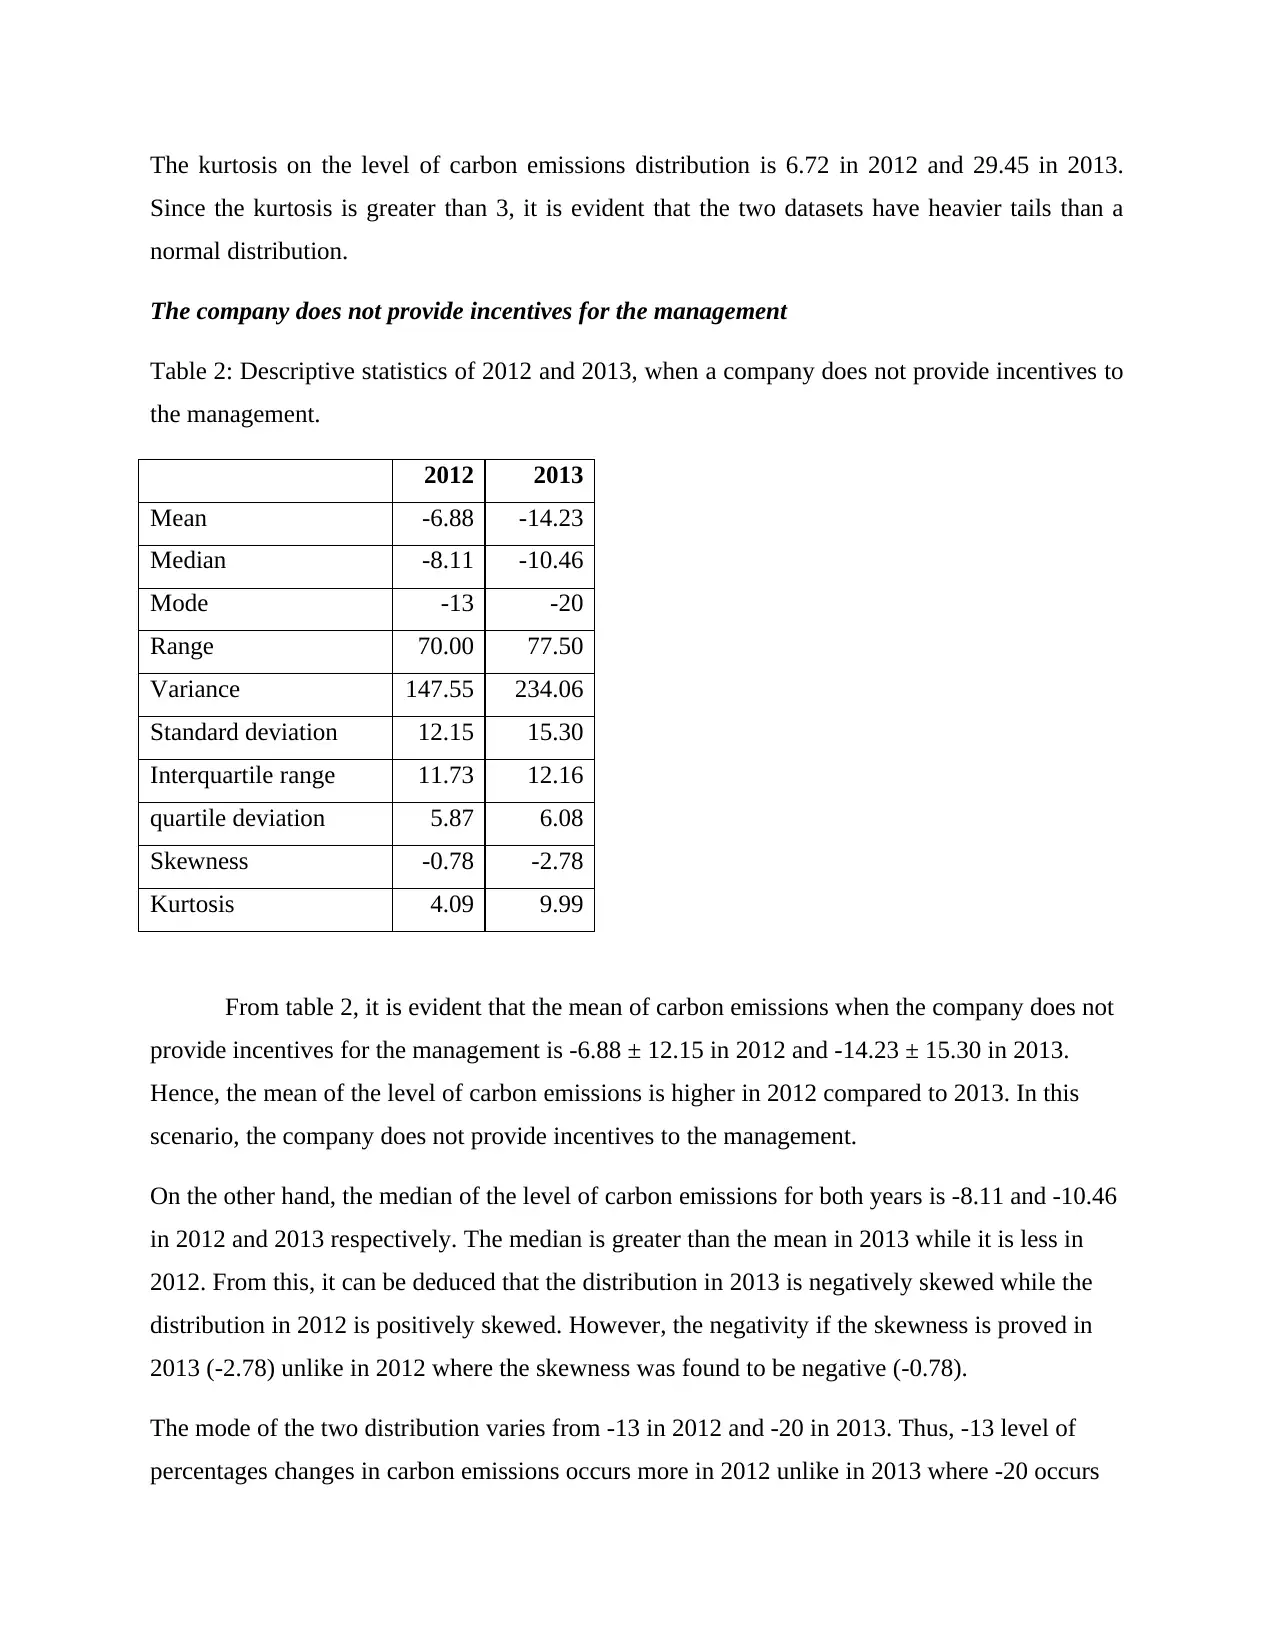
The kurtosis on the level of carbon emissions distribution is 6.72 in 2012 and 29.45 in 2013.
Since the kurtosis is greater than 3, it is evident that the two datasets have heavier tails than a
normal distribution.
The company does not provide incentives for the management
Table 2: Descriptive statistics of 2012 and 2013, when a company does not provide incentives to
the management.
2012 2013
Mean -6.88 -14.23
Median -8.11 -10.46
Mode -13 -20
Range 70.00 77.50
Variance 147.55 234.06
Standard deviation 12.15 15.30
Interquartile range 11.73 12.16
quartile deviation 5.87 6.08
Skewness -0.78 -2.78
Kurtosis 4.09 9.99
From table 2, it is evident that the mean of carbon emissions when the company does not
provide incentives for the management is -6.88 ± 12.15 in 2012 and -14.23 ± 15.30 in 2013.
Hence, the mean of the level of carbon emissions is higher in 2012 compared to 2013. In this
scenario, the company does not provide incentives to the management.
On the other hand, the median of the level of carbon emissions for both years is -8.11 and -10.46
in 2012 and 2013 respectively. The median is greater than the mean in 2013 while it is less in
2012. From this, it can be deduced that the distribution in 2013 is negatively skewed while the
distribution in 2012 is positively skewed. However, the negativity if the skewness is proved in
2013 (-2.78) unlike in 2012 where the skewness was found to be negative (-0.78).
The mode of the two distribution varies from -13 in 2012 and -20 in 2013. Thus, -13 level of
percentages changes in carbon emissions occurs more in 2012 unlike in 2013 where -20 occurs
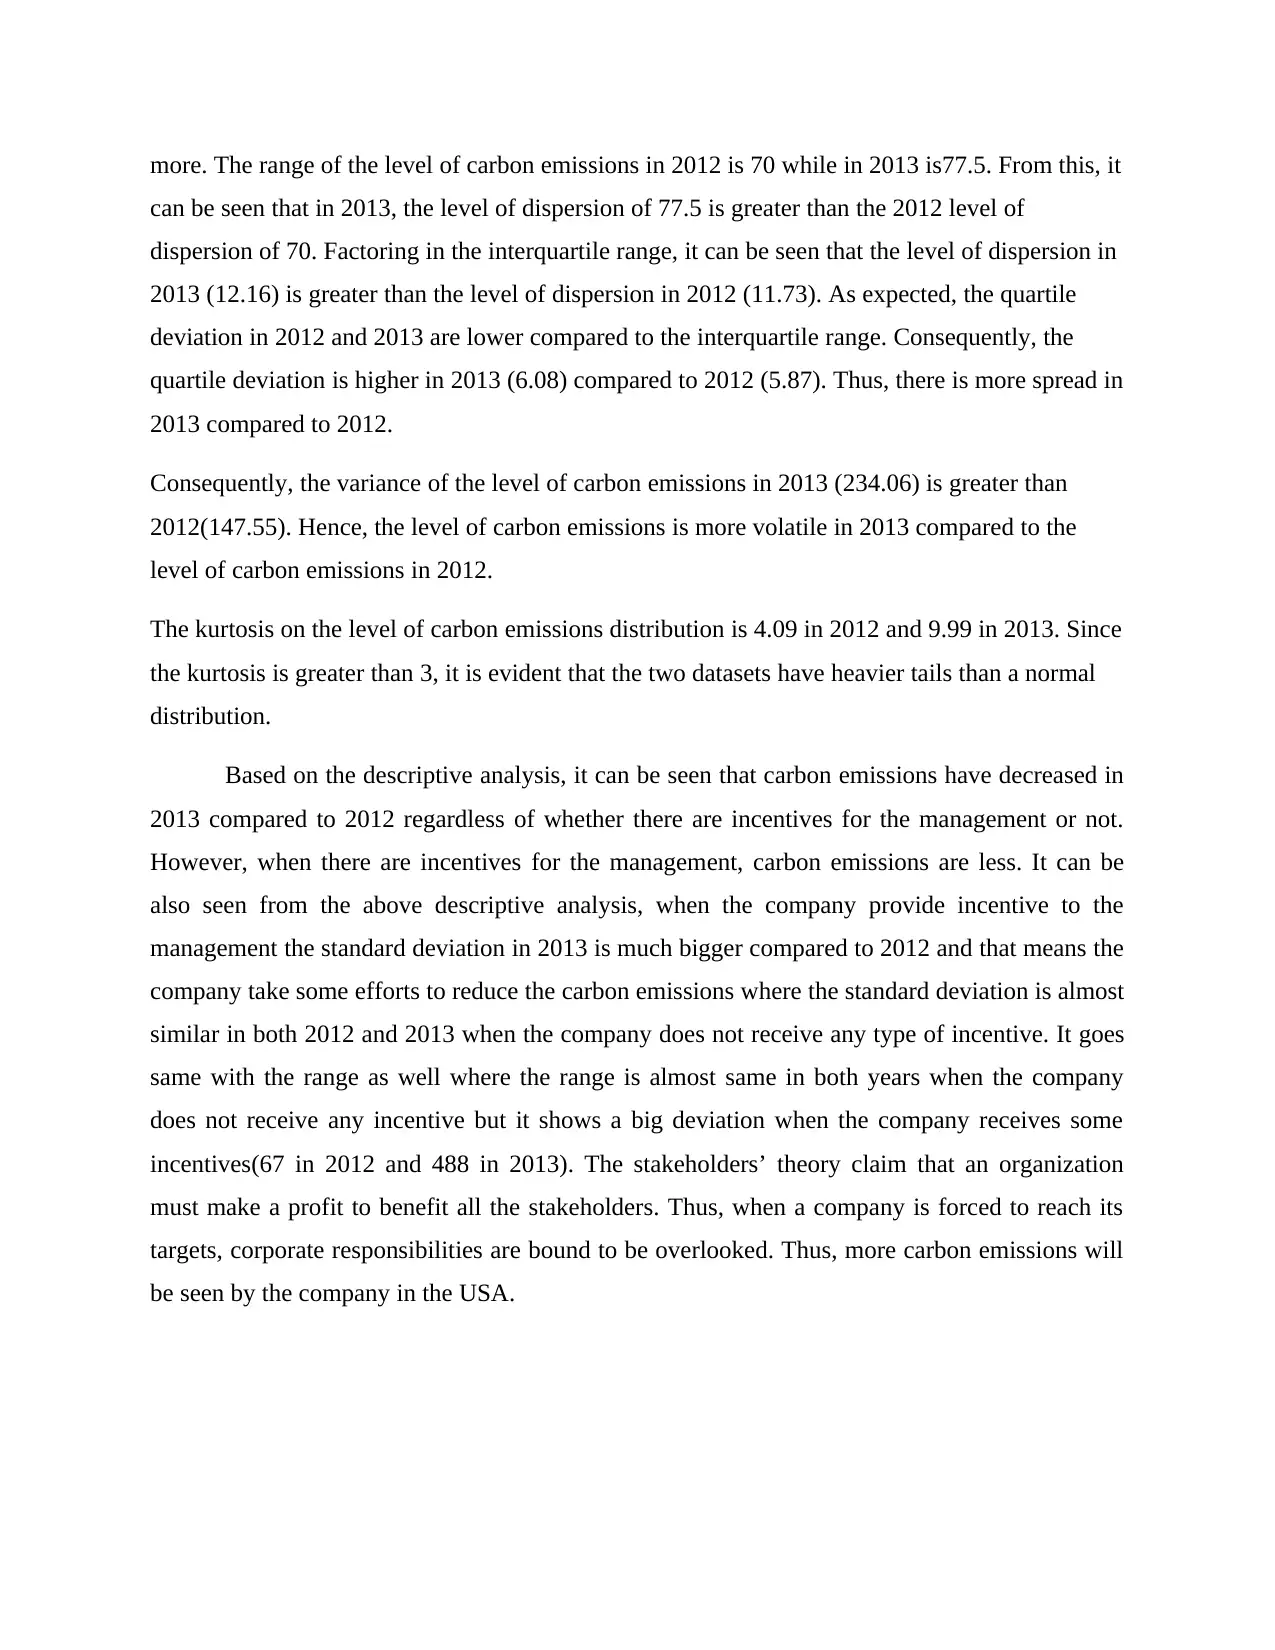
more. The range of the level of carbon emissions in 2012 is 70 while in 2013 is77.5. From this, it
can be seen that in 2013, the level of dispersion of 77.5 is greater than the 2012 level of
dispersion of 70. Factoring in the interquartile range, it can be seen that the level of dispersion in
2013 (12.16) is greater than the level of dispersion in 2012 (11.73). As expected, the quartile
deviation in 2012 and 2013 are lower compared to the interquartile range. Consequently, the
quartile deviation is higher in 2013 (6.08) compared to 2012 (5.87). Thus, there is more spread in
2013 compared to 2012.
Consequently, the variance of the level of carbon emissions in 2013 (234.06) is greater than
2012(147.55). Hence, the level of carbon emissions is more volatile in 2013 compared to the
level of carbon emissions in 2012.
The kurtosis on the level of carbon emissions distribution is 4.09 in 2012 and 9.99 in 2013. Since
the kurtosis is greater than 3, it is evident that the two datasets have heavier tails than a normal
distribution.
Based on the descriptive analysis, it can be seen that carbon emissions have decreased in
2013 compared to 2012 regardless of whether there are incentives for the management or not.
However, when there are incentives for the management, carbon emissions are less. It can be
also seen from the above descriptive analysis, when the company provide incentive to the
management the standard deviation in 2013 is much bigger compared to 2012 and that means the
company take some efforts to reduce the carbon emissions where the standard deviation is almost
similar in both 2012 and 2013 when the company does not receive any type of incentive. It goes
same with the range as well where the range is almost same in both years when the company
does not receive any incentive but it shows a big deviation when the company receives some
incentives(67 in 2012 and 488 in 2013). The stakeholders’ theory claim that an organization
must make a profit to benefit all the stakeholders. Thus, when a company is forced to reach its
targets, corporate responsibilities are bound to be overlooked. Thus, more carbon emissions will
be seen by the company in the USA.
Data Analysis – Inferential (ASSESSED)(20%)
The results of the descriptive statistical analysis only provides an exploratory idea about
the impact of incentives being included into the company business strategy and offered to the
management to influence the company to reduce its carbon emissions. Although the descriptive
analysis reveals a general decrease in carbon emissions from 2012 to 2013 among the sample,
regardless of the fact that a company has such an incentive plan in place or not, it cannot be
asserted to be true for the population of companies that exist or not. The statistical validity of the
conjecture that inclusion of such incentives to influence a core stakeholder group, that is the
management, could go on to significantly impact and hence reduce the emission levels is hence
still not established on the sole of the descriptive measures. In order to come to an evidence
based conclusion regarding the impact of incentives, inferential analysis is then employed to
approach the problem.
Inferential statistics is a tool that allows for the researcher to arrive at conclusions about
the whole population on the basis of the given representative sample, with some degree of
controlled error. The two errors associated with the methodology are type I error or the
probability that the true null hypothesis is rejected. This is also equivalent to the level of
significance of the test. Type II error or the probability that the false alternative will be accepted.
Then naturally, decreasing one error would imply the increase in the other. The following
methodology set the type I error as 0.05 and the type II error was minimized to arrive at the
conclusion. This means that the null is rejected whenever the p-value is found to be less than
0.05, at 5% level of significance. The difference in the percentage change of the companies who
give incentives between 2012 and 2013 was then tested for using the paired t-tests. The
difference between the two groups of companies, namely, those who give incentives and those
who do not, in terms of percentage emission in 2012 and in 2013 was tested for using two
independent sample t-tests. The same was employed for the difference between the companies
who offered incentives in 2012 and those which did not offer incentives in 2013 and those which
did not offer incentives in 2012 and those which did offer incentives in 2013.
The first assumption for both paired t-tests and independent sample t-tests is that the data
is free from outliers. This is primarily due to the fact that the test statistics are based on the mean
Secure Best Marks with AI Grader
Need help grading? Try our AI Grader for instant feedback on your assignments.
which is highly susceptible to presence of outliers. Thus presence of extreme values in the data
could potentially lead to erroneous results.The two sets of data to be compared for the paired t-
tests must be on the same attribute but dependent on each other, such that they may be from the
same individual or object in different time or scenarios, that is, should be observations on the
same variable at different scenarios but related to the same unit. The assumption for independent
t-tests however is that the data samples are on the same variable but drawn independently from
each other. Again, another assumption is that the data samples are underlined by some normal
distribution.
The data is therefore first explored for the presence of outliers. The following boxplots
show the presence of values that lie beyond the Interquartile range and those that may be
regarded as extremes. The observations numbered, 7, 11, 14 and 25 were identified as outliers
and hence removed from the dataset before commencing with the tests for the six specified
hypothesis.
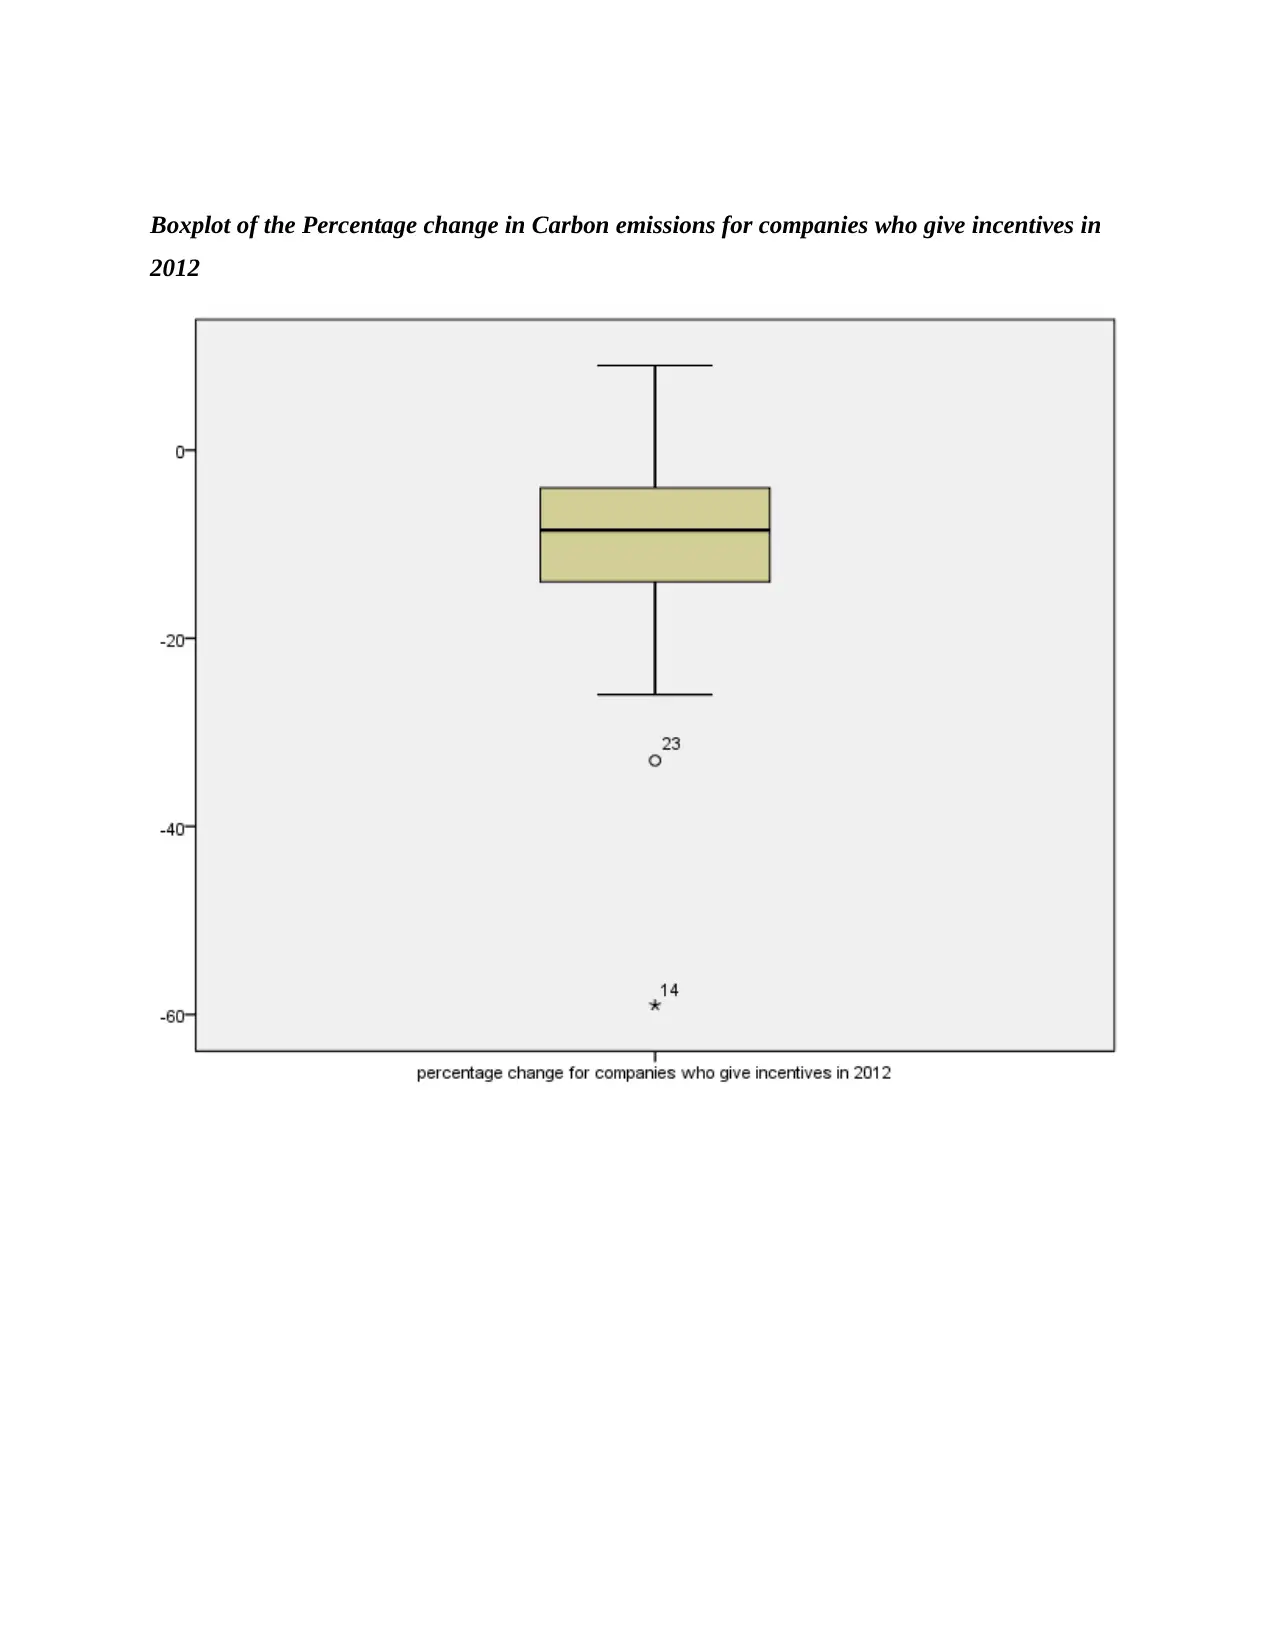
Boxplot of the Percentage change in Carbon emissions for companies who give incentives in
2012
2012
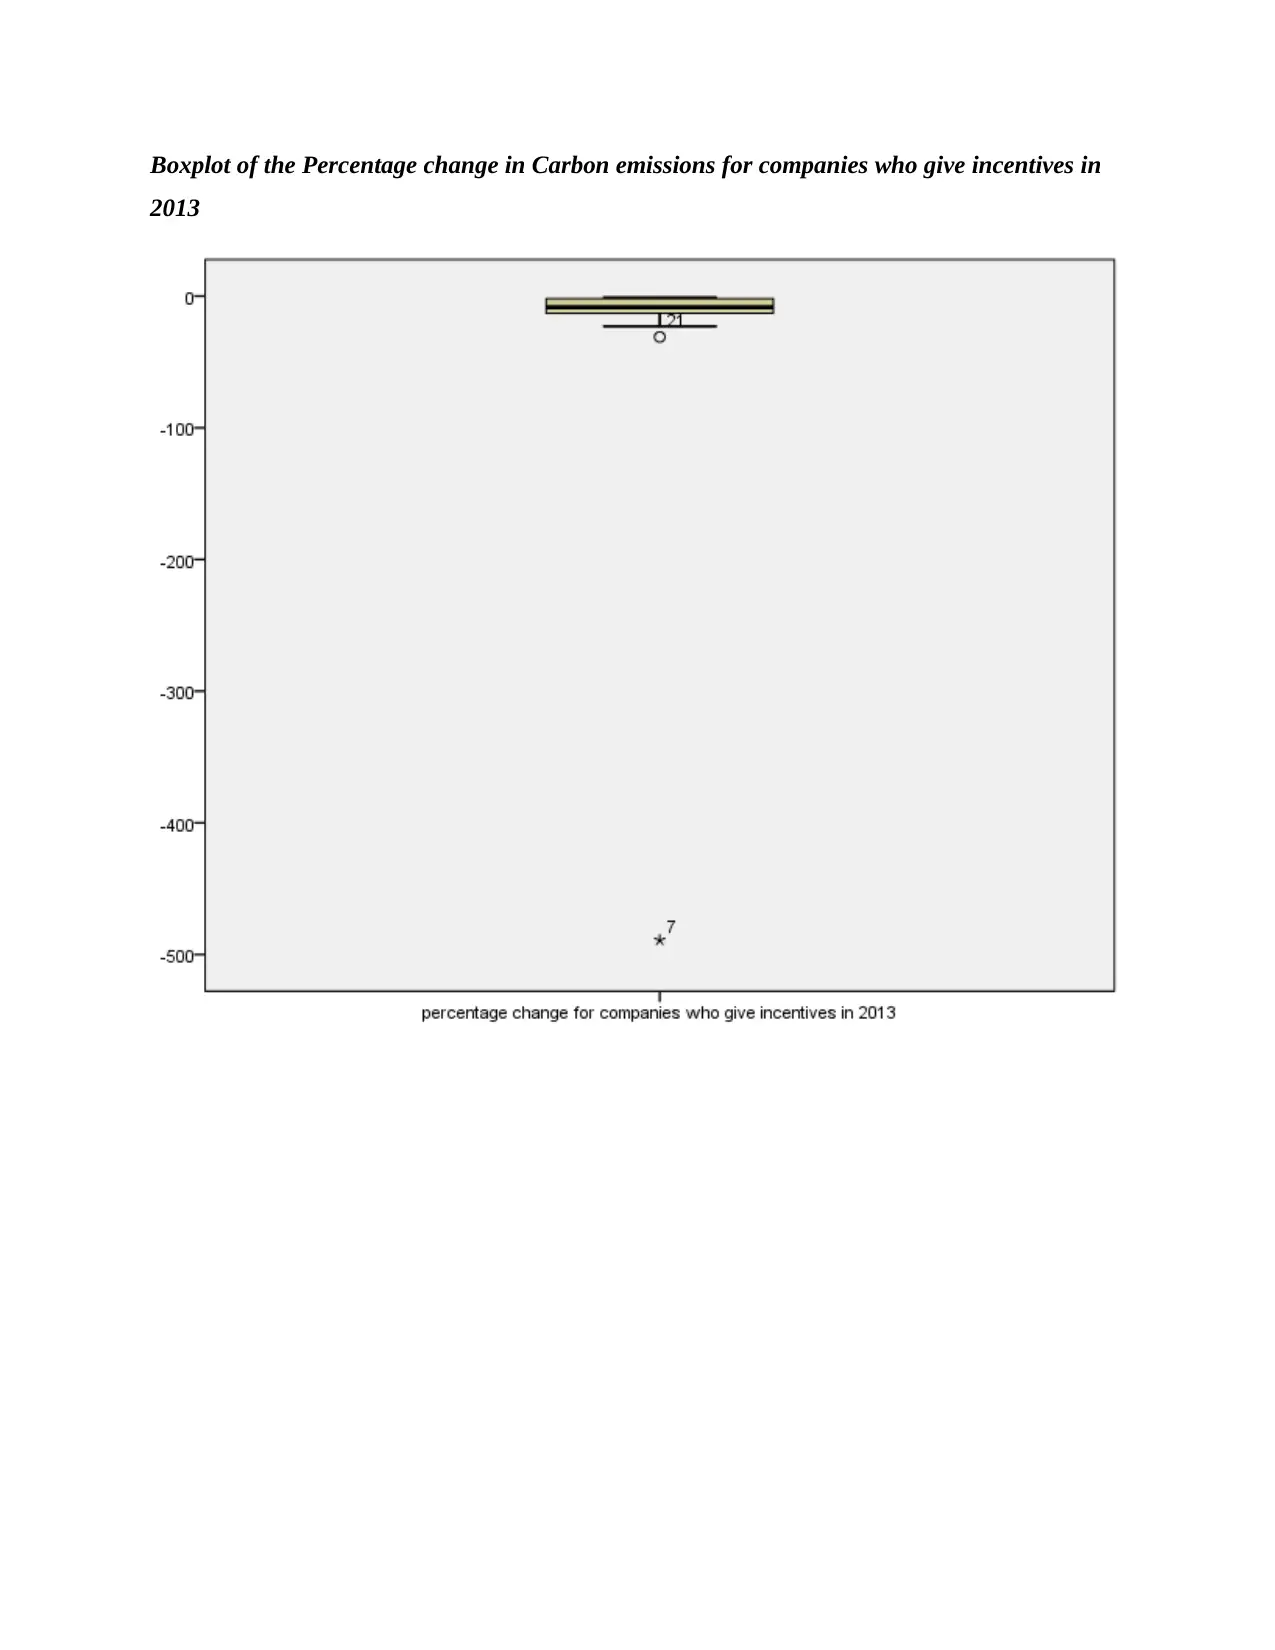
Boxplot of the Percentage change in Carbon emissions for companies who give incentives in
2013
2013
Paraphrase This Document
Need a fresh take? Get an instant paraphrase of this document with our AI Paraphraser
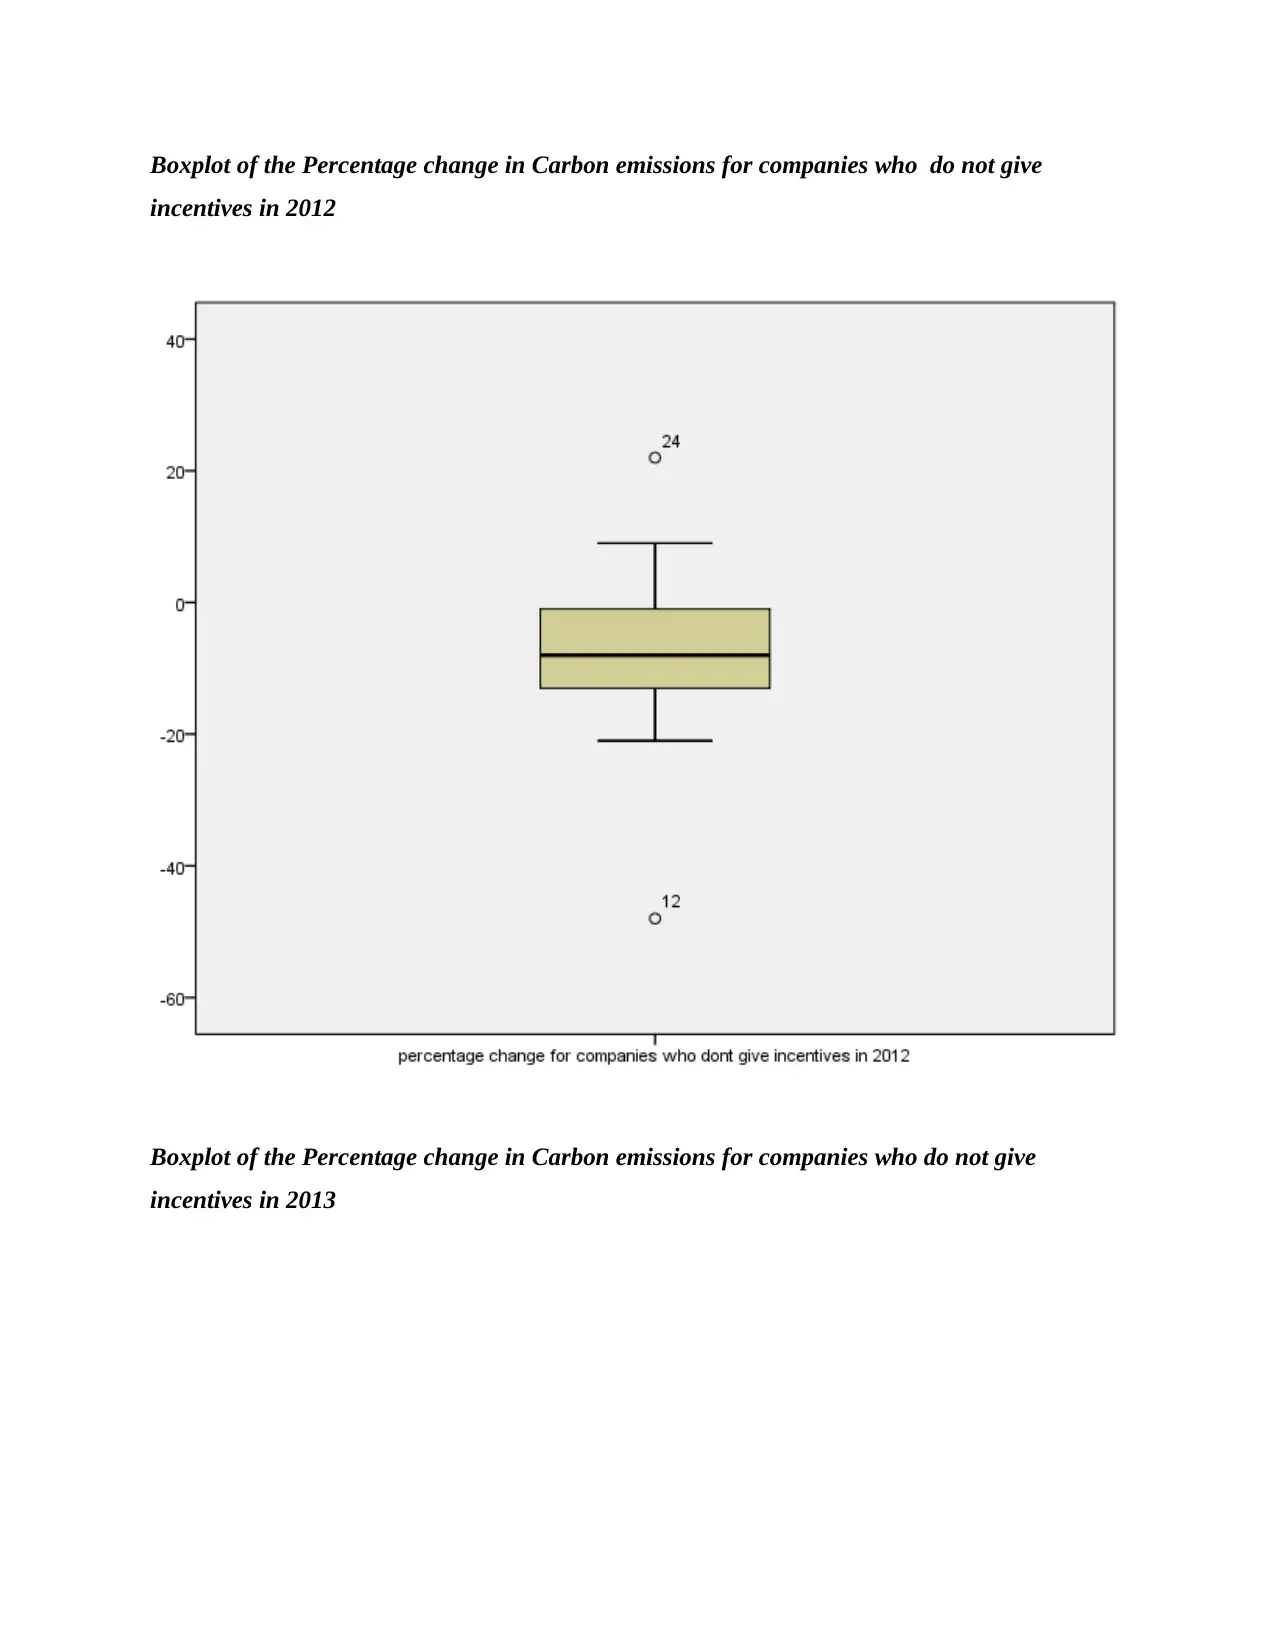
Boxplot of the Percentage change in Carbon emissions for companies who do not give
incentives in 2012
Boxplot of the Percentage change in Carbon emissions for companies who do not give
incentives in 2013
incentives in 2012
Boxplot of the Percentage change in Carbon emissions for companies who do not give
incentives in 2013
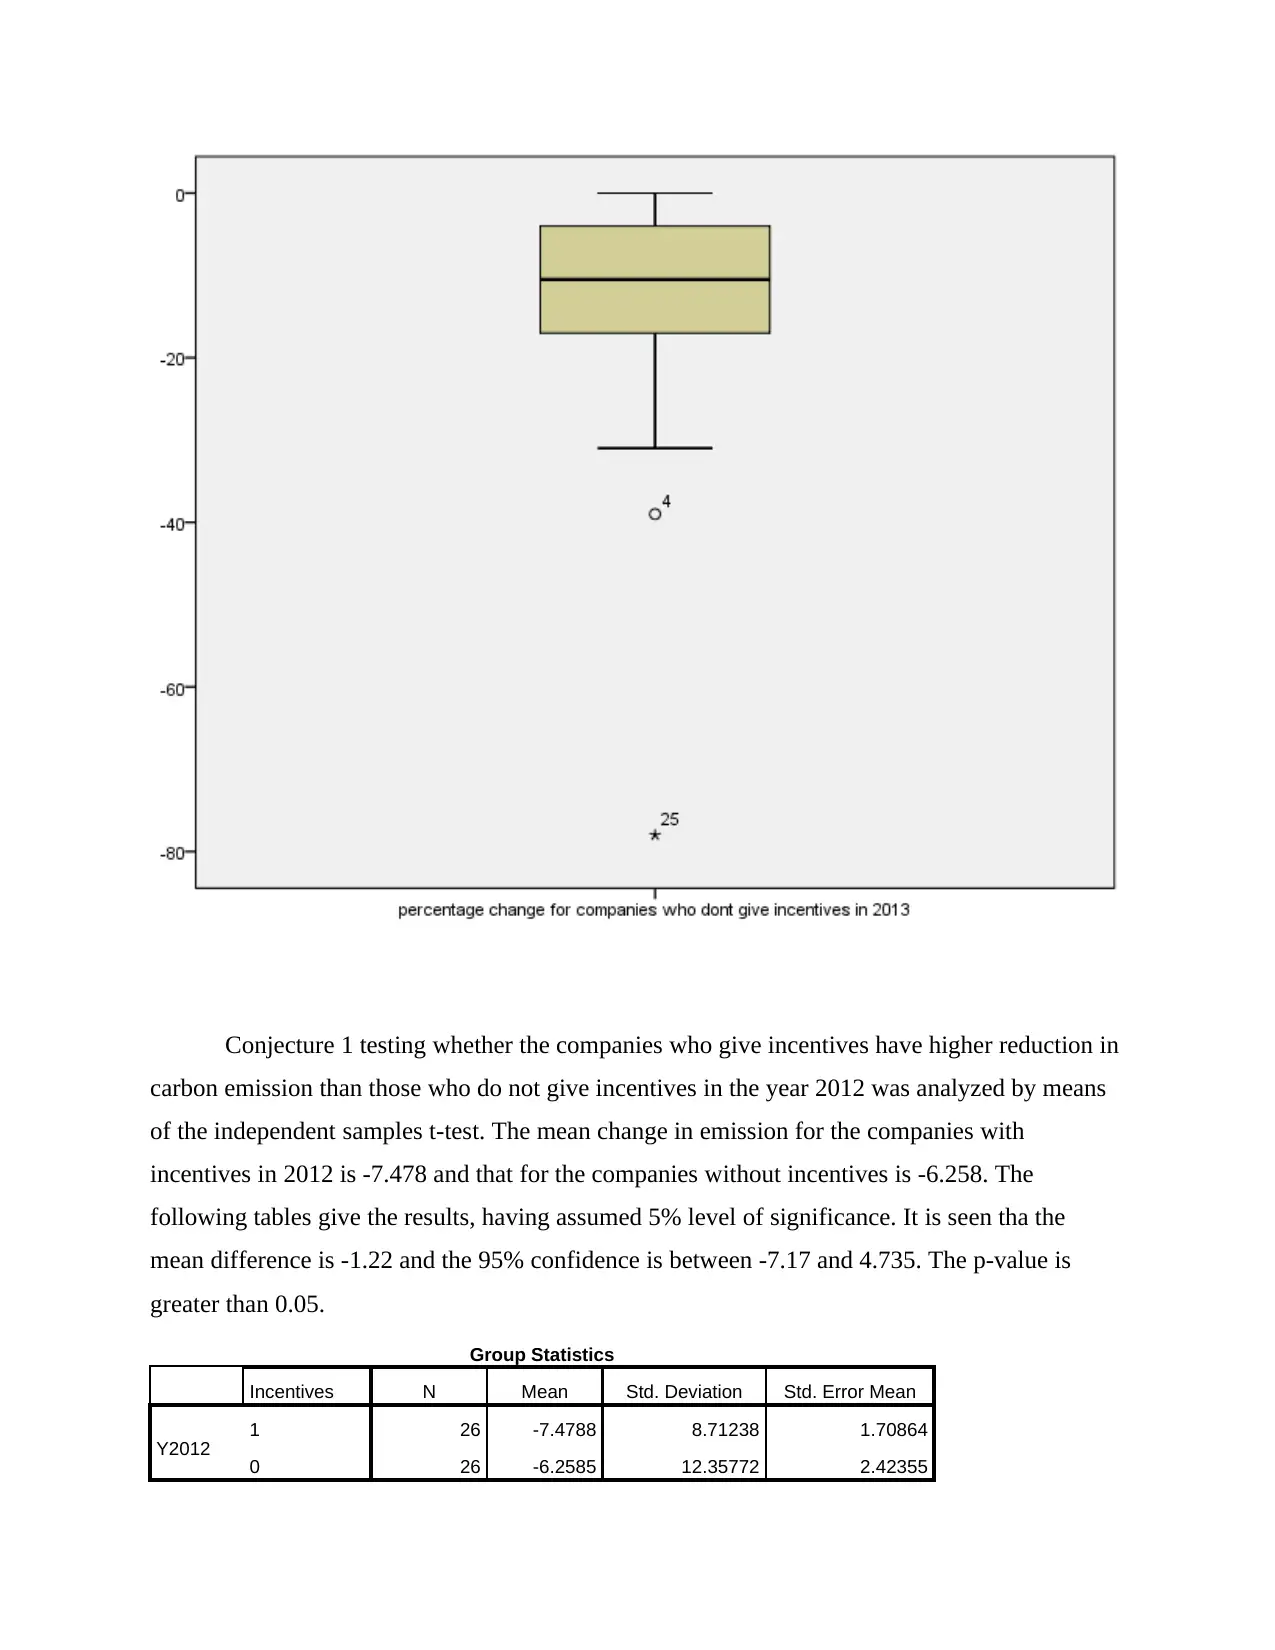
Conjecture 1 testing whether the companies who give incentives have higher reduction in
carbon emission than those who do not give incentives in the year 2012 was analyzed by means
of the independent samples t-test. The mean change in emission for the companies with
incentives in 2012 is -7.478 and that for the companies without incentives is -6.258. The
following tables give the results, having assumed 5% level of significance. It is seen tha the
mean difference is -1.22 and the 95% confidence is between -7.17 and 4.735. The p-value is
greater than 0.05.
Group Statistics
Incentives N Mean Std. Deviation Std. Error Mean
Y2012 1 26 -7.4788 8.71238 1.70864
0 26 -6.2585 12.35772 2.42355
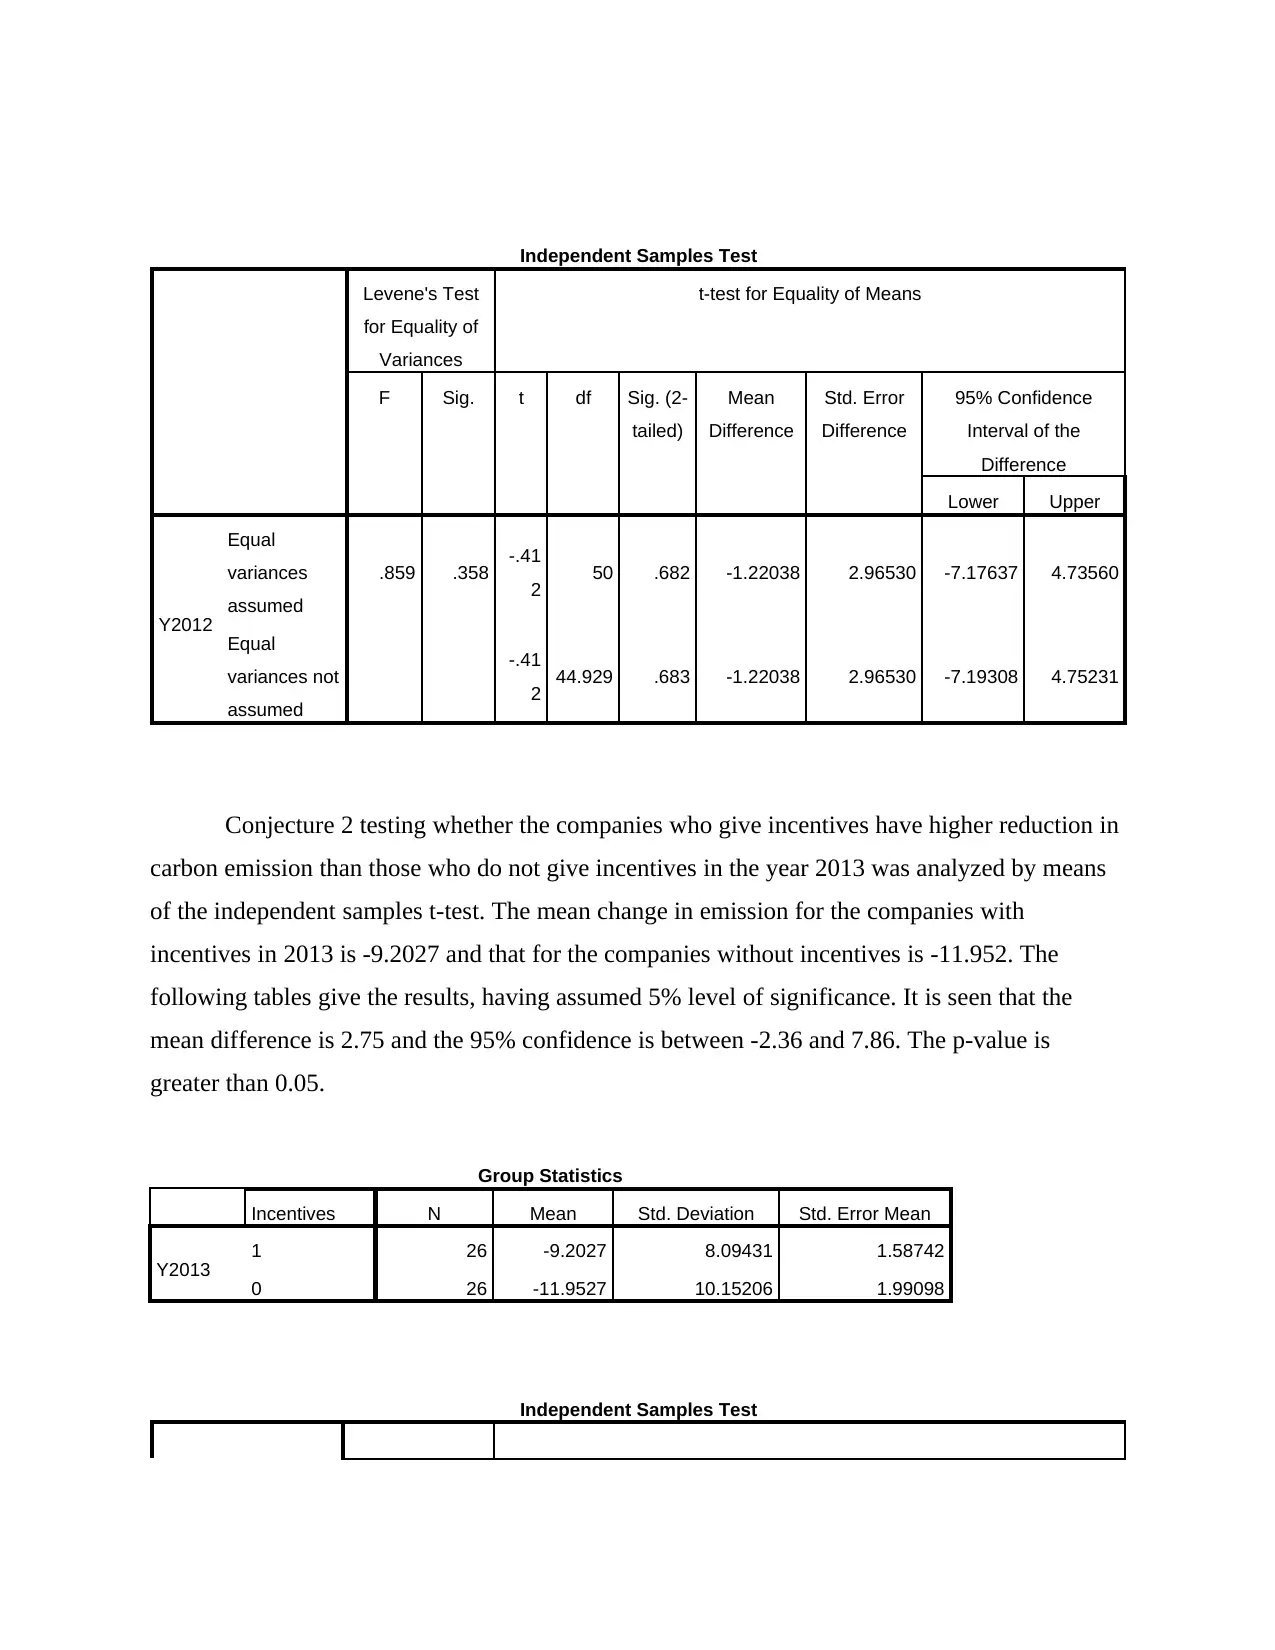
Independent Samples Test
Levene's Test
for Equality of
Variances
t-test for Equality of Means
F Sig. t df Sig. (2-
tailed)
Mean
Difference
Std. Error
Difference
95% Confidence
Interval of the
Difference
Lower Upper
Y2012
Equal
variances
assumed
.859 .358 -.41
2 50 .682 -1.22038 2.96530 -7.17637 4.73560
Equal
variances not
assumed
-.41
2 44.929 .683 -1.22038 2.96530 -7.19308 4.75231
Conjecture 2 testing whether the companies who give incentives have higher reduction in
carbon emission than those who do not give incentives in the year 2013 was analyzed by means
of the independent samples t-test. The mean change in emission for the companies with
incentives in 2013 is -9.2027 and that for the companies without incentives is -11.952. The
following tables give the results, having assumed 5% level of significance. It is seen that the
mean difference is 2.75 and the 95% confidence is between -2.36 and 7.86. The p-value is
greater than 0.05.
Group Statistics
Incentives N Mean Std. Deviation Std. Error Mean
Y2013 1 26 -9.2027 8.09431 1.58742
0 26 -11.9527 10.15206 1.99098
Independent Samples Test
Secure Best Marks with AI Grader
Need help grading? Try our AI Grader for instant feedback on your assignments.
Levene's Test
for Equality of
Variances
t-test for Equality of Means
F Sig. t df Sig. (2-
tailed)
Mean
Difference
Std. Error
Difference
95% Confidence
Interval of the
Difference
Lower Upper
Y2013
Equal
variances
assumed
1.446 .235 1.080 50 .285 2.75000 2.54636 -2.36451 7.86451
Equal
variances
not assumed
1.080 47.637 .286 2.75000 2.54636 -2.37080 7.87080
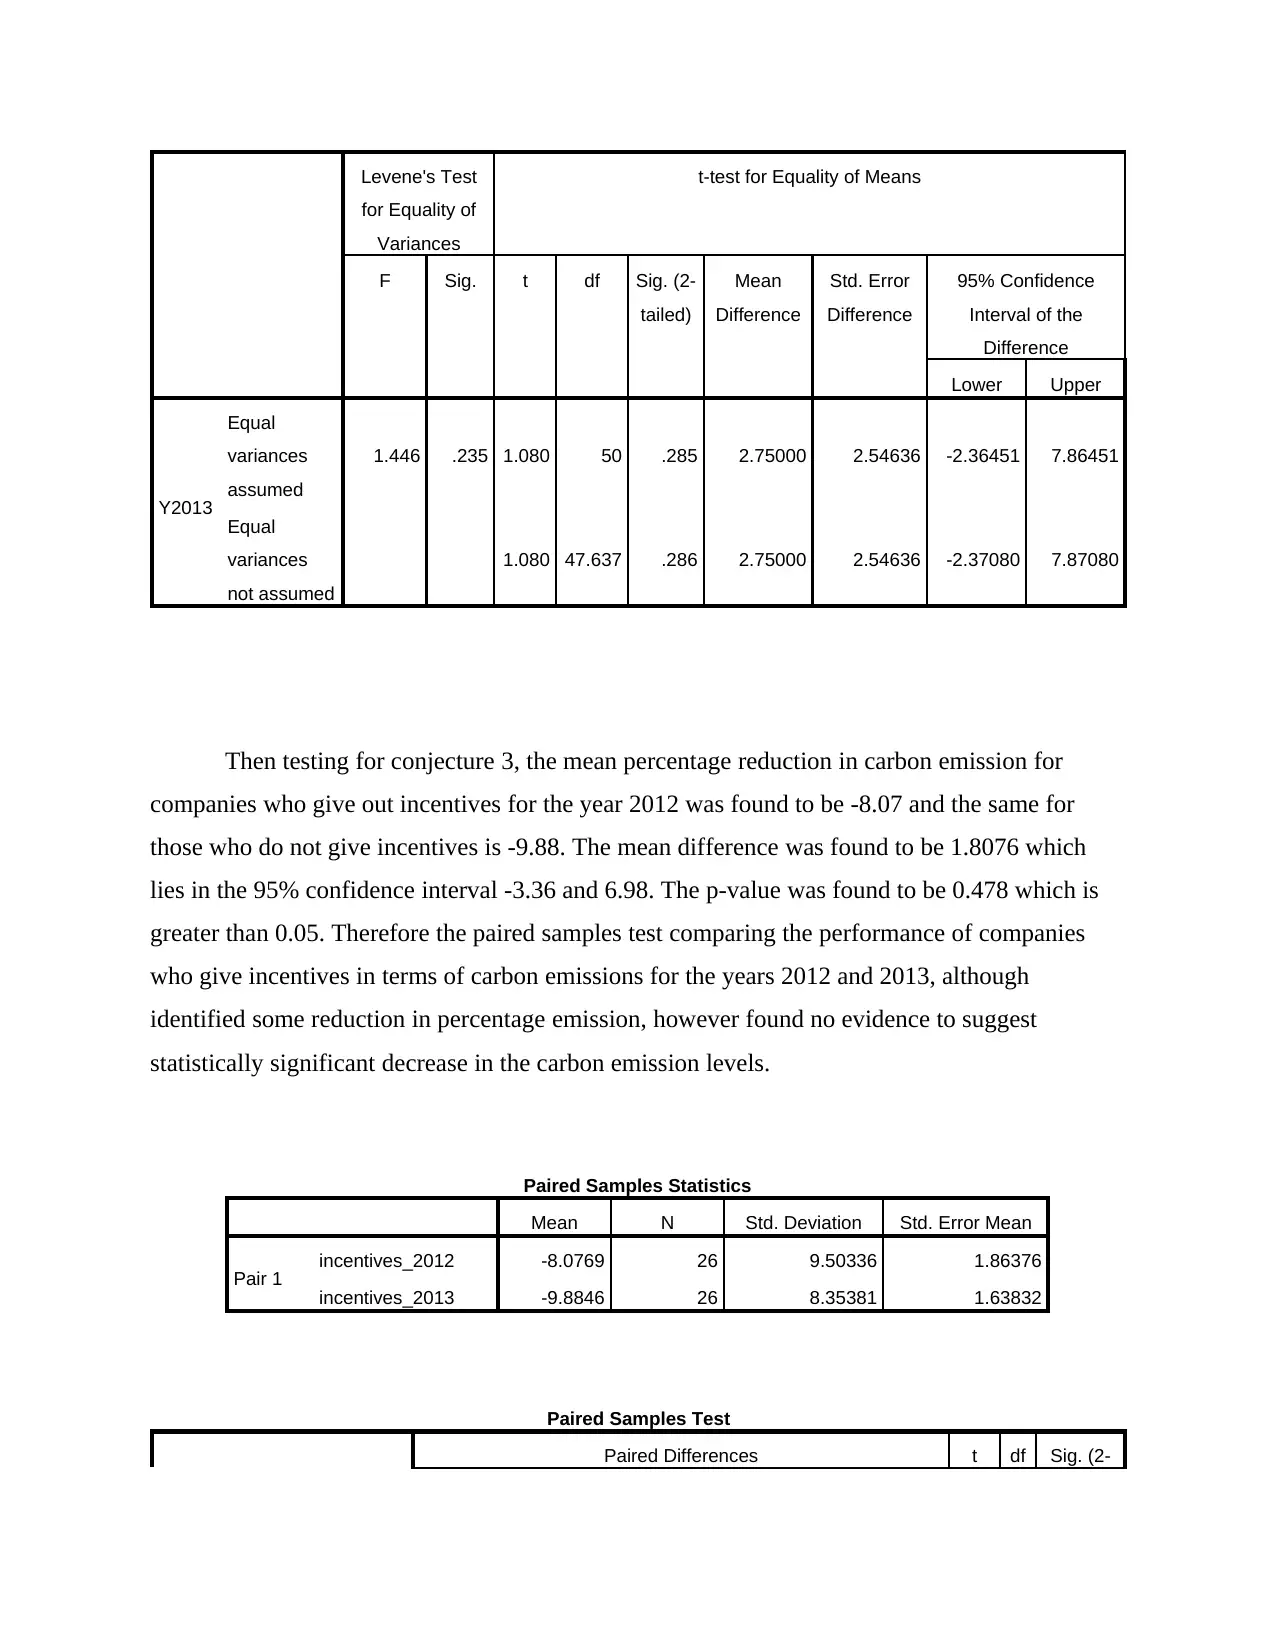
Then testing for conjecture 3, the mean percentage reduction in carbon emission for
companies who give out incentives for the year 2012 was found to be -8.07 and the same for
those who do not give incentives is -9.88. The mean difference was found to be 1.8076 which
lies in the 95% confidence interval -3.36 and 6.98. The p-value was found to be 0.478 which is
greater than 0.05. Therefore the paired samples test comparing the performance of companies
who give incentives in terms of carbon emissions for the years 2012 and 2013, although
identified some reduction in percentage emission, however found no evidence to suggest
statistically significant decrease in the carbon emission levels.
Paired Samples Statistics
Mean N Std. Deviation Std. Error Mean
Pair 1 incentives_2012 -8.0769 26 9.50336 1.86376
incentives_2013 -9.8846 26 8.35381 1.63832
Paired Samples Test
Paired Differences t df Sig. (2-
for Equality of
Variances
t-test for Equality of Means
F Sig. t df Sig. (2-
tailed)
Mean
Difference
Std. Error
Difference
95% Confidence
Interval of the
Difference
Lower Upper
Y2013
Equal
variances
assumed
1.446 .235 1.080 50 .285 2.75000 2.54636 -2.36451 7.86451
Equal
variances
not assumed
1.080 47.637 .286 2.75000 2.54636 -2.37080 7.87080
Then testing for conjecture 3, the mean percentage reduction in carbon emission for
companies who give out incentives for the year 2012 was found to be -8.07 and the same for
those who do not give incentives is -9.88. The mean difference was found to be 1.8076 which
lies in the 95% confidence interval -3.36 and 6.98. The p-value was found to be 0.478 which is
greater than 0.05. Therefore the paired samples test comparing the performance of companies
who give incentives in terms of carbon emissions for the years 2012 and 2013, although
identified some reduction in percentage emission, however found no evidence to suggest
statistically significant decrease in the carbon emission levels.
Paired Samples Statistics
Mean N Std. Deviation Std. Error Mean
Pair 1 incentives_2012 -8.0769 26 9.50336 1.86376
incentives_2013 -9.8846 26 8.35381 1.63832
Paired Samples Test
Paired Differences t df Sig. (2-
tailed)Mean Std.
Deviation
Std. Error
Mean
95% Confidence Interval of
the Difference
Lower Upper
Pair
1
incentives_2012 -
incentives_2013 1.80769 12.80943 2.51214 -3.36615 6.98153 .720 25 .478
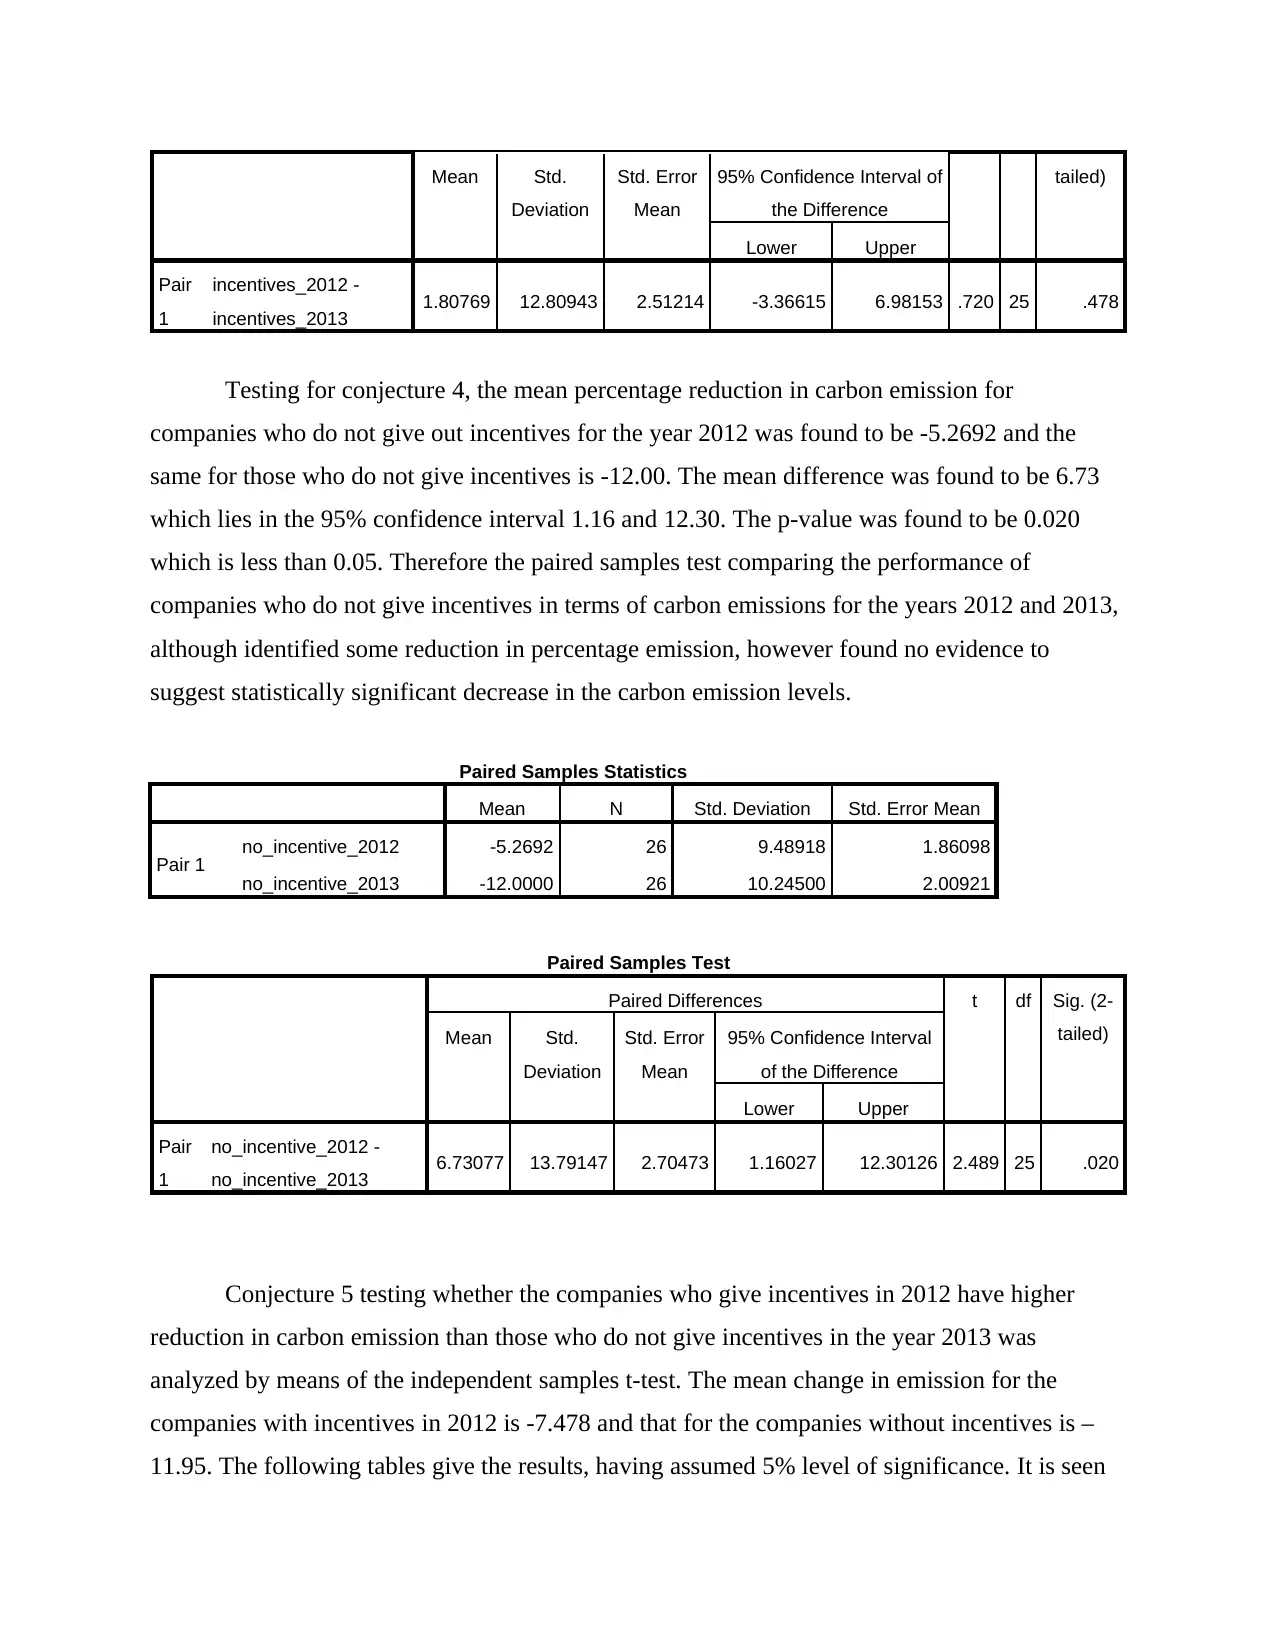
Testing for conjecture 4, the mean percentage reduction in carbon emission for
companies who do not give out incentives for the year 2012 was found to be -5.2692 and the
same for those who do not give incentives is -12.00. The mean difference was found to be 6.73
which lies in the 95% confidence interval 1.16 and 12.30. The p-value was found to be 0.020
which is less than 0.05. Therefore the paired samples test comparing the performance of
companies who do not give incentives in terms of carbon emissions for the years 2012 and 2013,
although identified some reduction in percentage emission, however found no evidence to
suggest statistically significant decrease in the carbon emission levels.
Paired Samples Statistics
Mean N Std. Deviation Std. Error Mean
Pair 1 no_incentive_2012 -5.2692 26 9.48918 1.86098
no_incentive_2013 -12.0000 26 10.24500 2.00921
Paired Samples Test
Paired Differences t df Sig. (2-
tailed)Mean Std.
Deviation
Std. Error
Mean
95% Confidence Interval
of the Difference
Lower Upper
Pair
1
no_incentive_2012 -
no_incentive_2013 6.73077 13.79147 2.70473 1.16027 12.30126 2.489 25 .020
Conjecture 5 testing whether the companies who give incentives in 2012 have higher
reduction in carbon emission than those who do not give incentives in the year 2013 was
analyzed by means of the independent samples t-test. The mean change in emission for the
companies with incentives in 2012 is -7.478 and that for the companies without incentives is –
11.95. The following tables give the results, having assumed 5% level of significance. It is seen
Deviation
Std. Error
Mean
95% Confidence Interval of
the Difference
Lower Upper
Pair
1
incentives_2012 -
incentives_2013 1.80769 12.80943 2.51214 -3.36615 6.98153 .720 25 .478
Testing for conjecture 4, the mean percentage reduction in carbon emission for
companies who do not give out incentives for the year 2012 was found to be -5.2692 and the
same for those who do not give incentives is -12.00. The mean difference was found to be 6.73
which lies in the 95% confidence interval 1.16 and 12.30. The p-value was found to be 0.020
which is less than 0.05. Therefore the paired samples test comparing the performance of
companies who do not give incentives in terms of carbon emissions for the years 2012 and 2013,
although identified some reduction in percentage emission, however found no evidence to
suggest statistically significant decrease in the carbon emission levels.
Paired Samples Statistics
Mean N Std. Deviation Std. Error Mean
Pair 1 no_incentive_2012 -5.2692 26 9.48918 1.86098
no_incentive_2013 -12.0000 26 10.24500 2.00921
Paired Samples Test
Paired Differences t df Sig. (2-
tailed)Mean Std.
Deviation
Std. Error
Mean
95% Confidence Interval
of the Difference
Lower Upper
Pair
1
no_incentive_2012 -
no_incentive_2013 6.73077 13.79147 2.70473 1.16027 12.30126 2.489 25 .020
Conjecture 5 testing whether the companies who give incentives in 2012 have higher
reduction in carbon emission than those who do not give incentives in the year 2013 was
analyzed by means of the independent samples t-test. The mean change in emission for the
companies with incentives in 2012 is -7.478 and that for the companies without incentives is –
11.95. The following tables give the results, having assumed 5% level of significance. It is seen
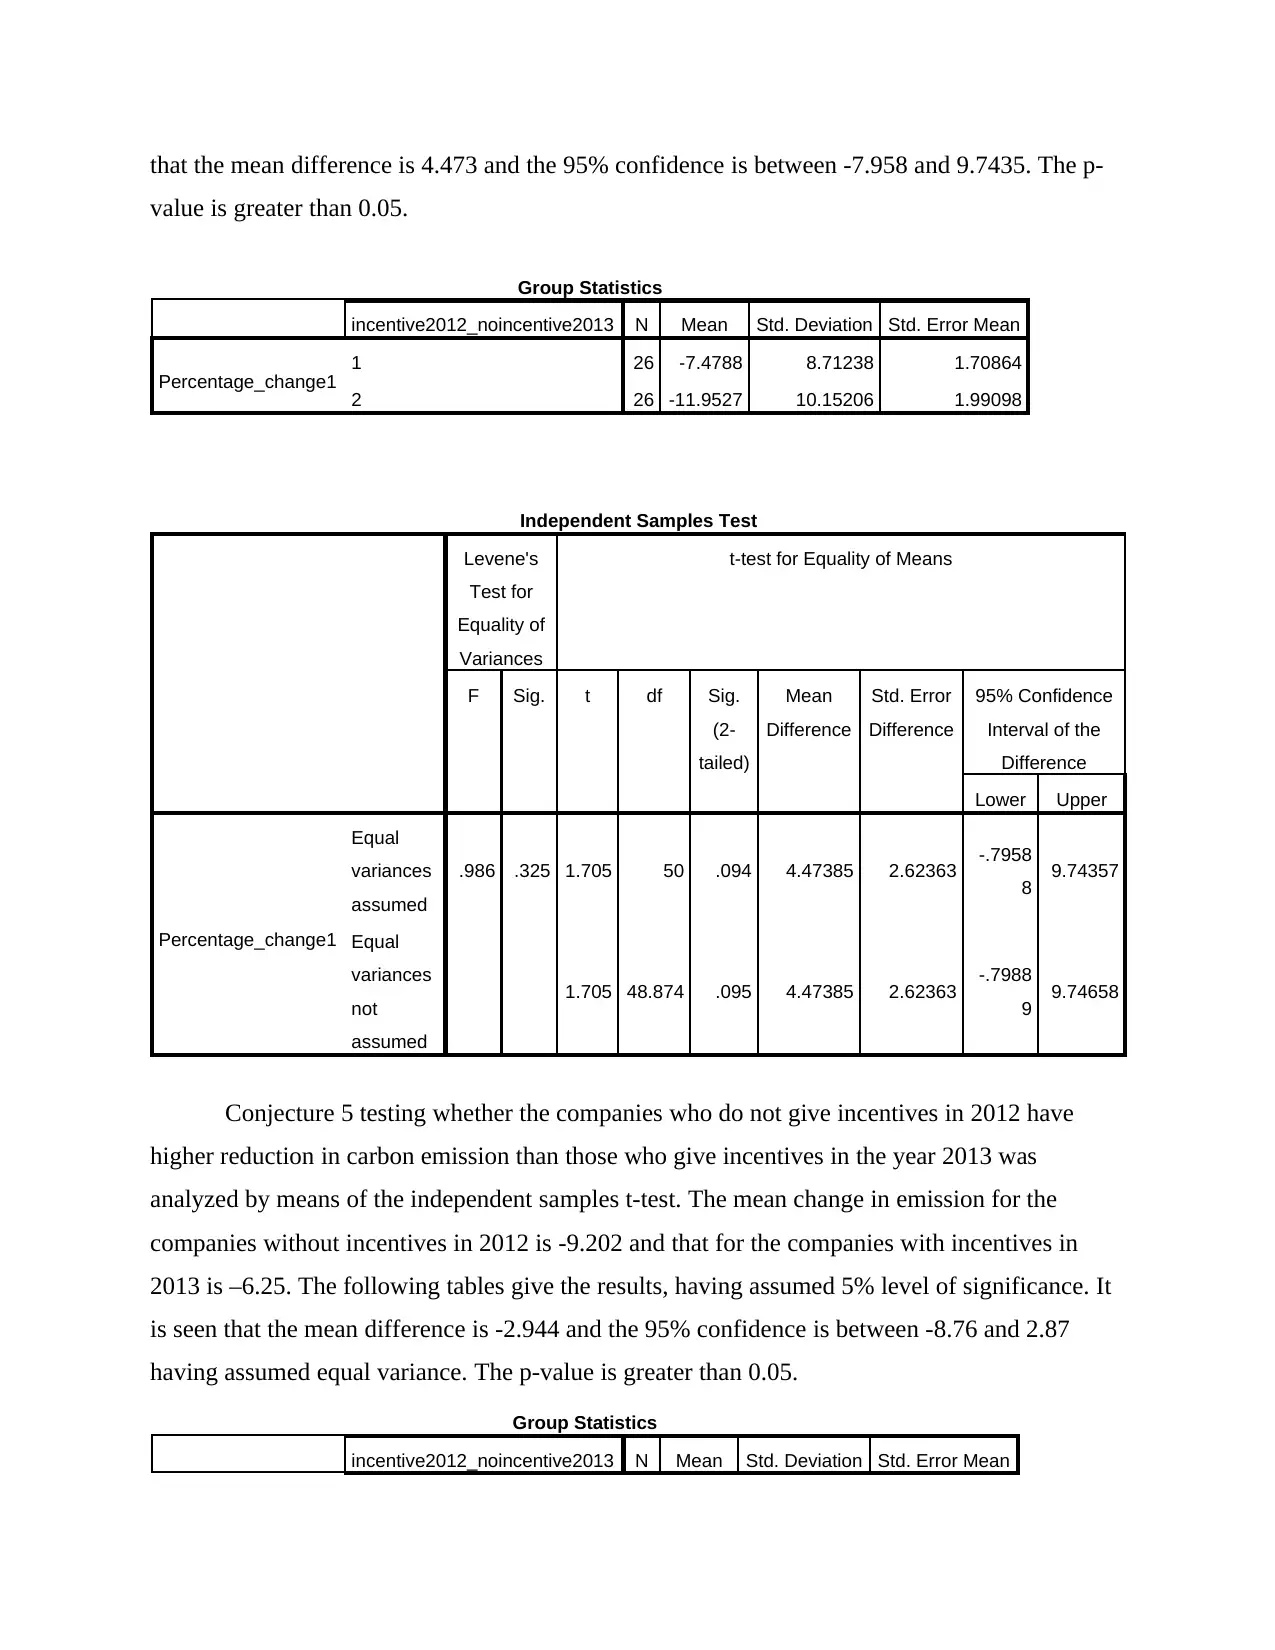
that the mean difference is 4.473 and the 95% confidence is between -7.958 and 9.7435. The p-
value is greater than 0.05.
Group Statistics
incentive2012_noincentive2013 N Mean Std. Deviation Std. Error Mean
Percentage_change1 1 26 -7.4788 8.71238 1.70864
2 26 -11.9527 10.15206 1.99098
Independent Samples Test
Levene's
Test for
Equality of
Variances
t-test for Equality of Means
F Sig. t df Sig.
(2-
tailed)
Mean
Difference
Std. Error
Difference
95% Confidence
Interval of the
Difference
Lower Upper
Percentage_change1
Equal
variances
assumed
.986 .325 1.705 50 .094 4.47385 2.62363 -.7958
8 9.74357
Equal
variances
not
assumed
1.705 48.874 .095 4.47385 2.62363 -.7988
9 9.74658
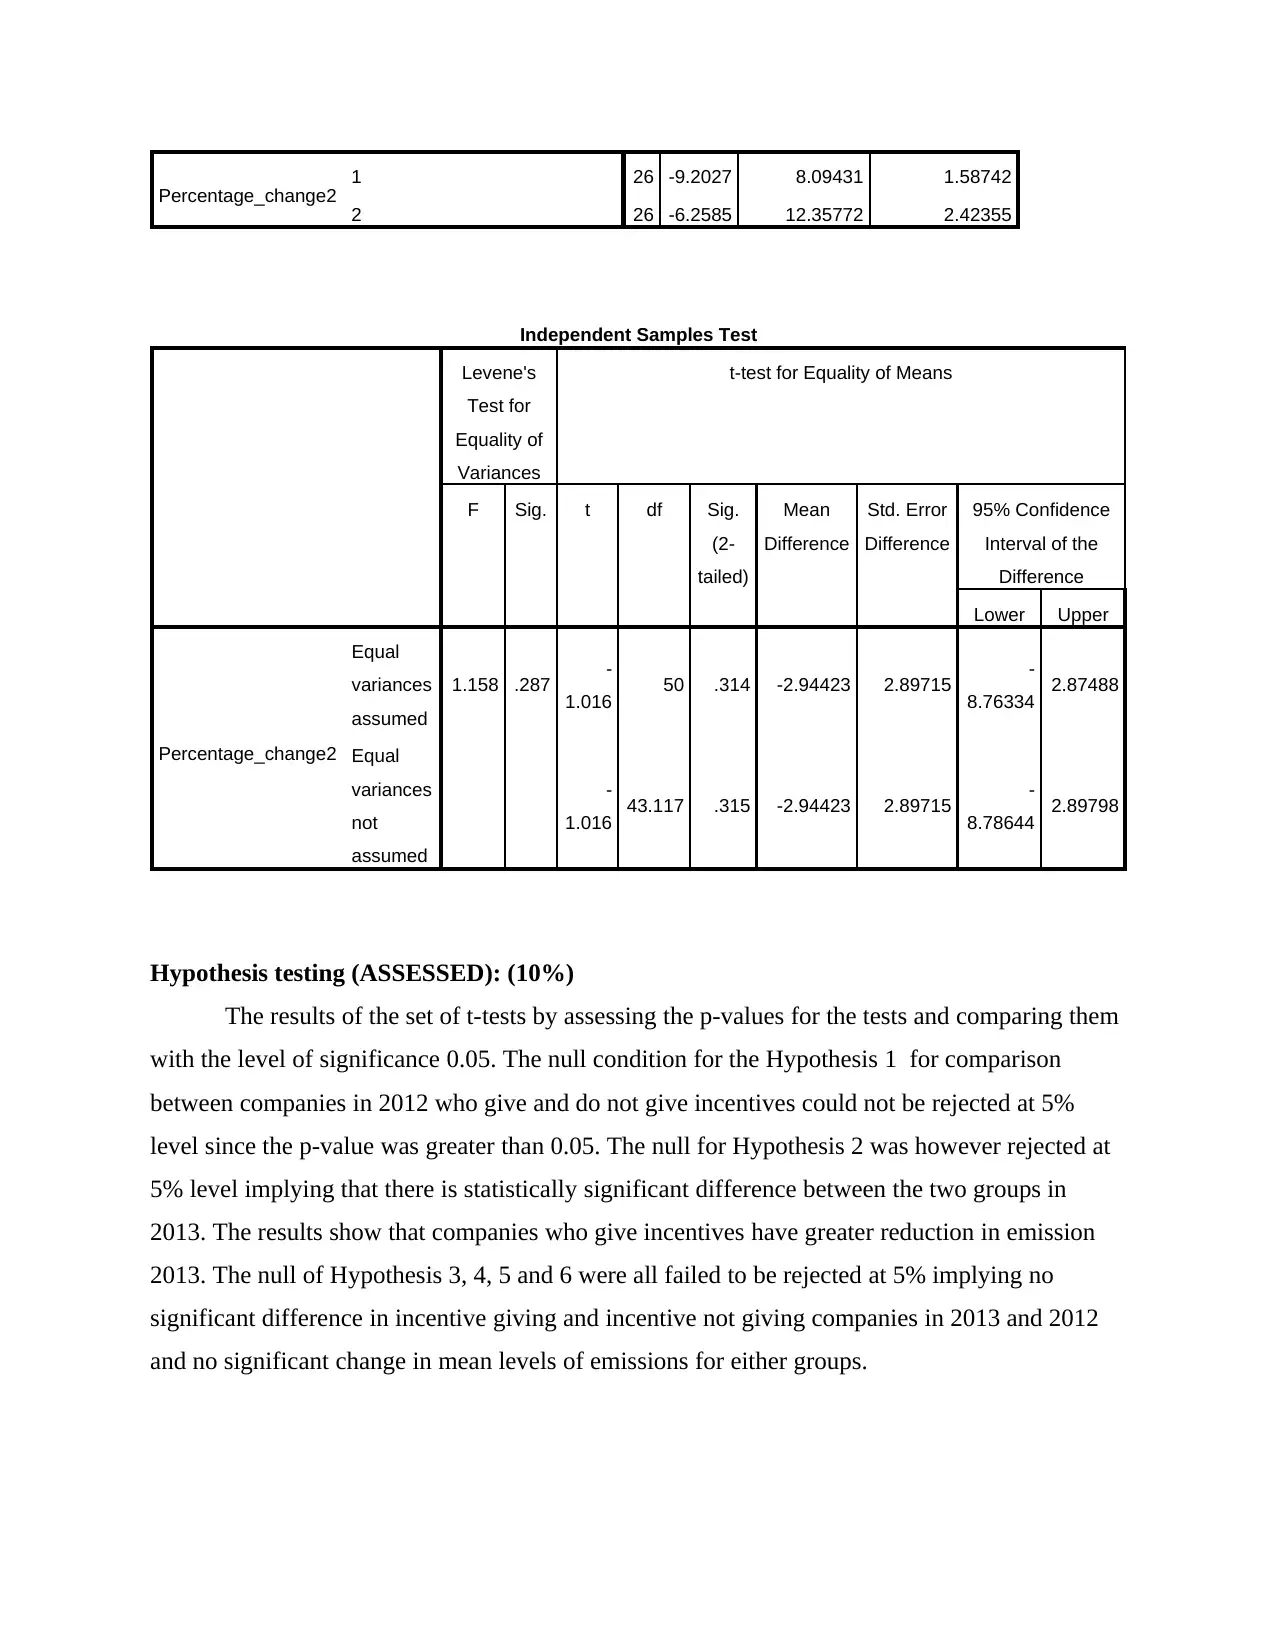
Conjecture 5 testing whether the companies who do not give incentives in 2012 have
higher reduction in carbon emission than those who give incentives in the year 2013 was
analyzed by means of the independent samples t-test. The mean change in emission for the
companies without incentives in 2012 is -9.202 and that for the companies with incentives in
2013 is –6.25. The following tables give the results, having assumed 5% level of significance. It
is seen that the mean difference is -2.944 and the 95% confidence is between -8.76 and 2.87
having assumed equal variance. The p-value is greater than 0.05.
Group Statistics
incentive2012_noincentive2013 N Mean Std. Deviation Std. Error Mean
value is greater than 0.05.
Group Statistics
incentive2012_noincentive2013 N Mean Std. Deviation Std. Error Mean
Percentage_change1 1 26 -7.4788 8.71238 1.70864
2 26 -11.9527 10.15206 1.99098
Independent Samples Test
Levene's
Test for
Equality of
Variances
t-test for Equality of Means
F Sig. t df Sig.
(2-
tailed)
Mean
Difference
Std. Error
Difference
95% Confidence
Interval of the
Difference
Lower Upper
Percentage_change1
Equal
variances
assumed
.986 .325 1.705 50 .094 4.47385 2.62363 -.7958
8 9.74357
Equal
variances
not
assumed
1.705 48.874 .095 4.47385 2.62363 -.7988
9 9.74658
Conjecture 5 testing whether the companies who do not give incentives in 2012 have
higher reduction in carbon emission than those who give incentives in the year 2013 was
analyzed by means of the independent samples t-test. The mean change in emission for the
companies without incentives in 2012 is -9.202 and that for the companies with incentives in
2013 is –6.25. The following tables give the results, having assumed 5% level of significance. It
is seen that the mean difference is -2.944 and the 95% confidence is between -8.76 and 2.87
having assumed equal variance. The p-value is greater than 0.05.
Group Statistics
incentive2012_noincentive2013 N Mean Std. Deviation Std. Error Mean
Paraphrase This Document
Need a fresh take? Get an instant paraphrase of this document with our AI Paraphraser
Percentage_change2 1 26 -9.2027 8.09431 1.58742
2 26 -6.2585 12.35772 2.42355
Independent Samples Test
Levene's
Test for
Equality of
Variances
t-test for Equality of Means
F Sig. t df Sig.
(2-
tailed)
Mean
Difference
Std. Error
Difference
95% Confidence
Interval of the
Difference
Lower Upper
Percentage_change2
Equal
variances
assumed
1.158 .287 -
1.016 50 .314 -2.94423 2.89715 -
8.76334 2.87488
Equal
variances
not
assumed
-
1.016 43.117 .315 -2.94423 2.89715 -
8.78644 2.89798
Hypothesis testing (ASSESSED): (10%)
The results of the set of t-tests by assessing the p-values for the tests and comparing them
with the level of significance 0.05. The null condition for the Hypothesis 1 for comparison
between companies in 2012 who give and do not give incentives could not be rejected at 5%
level since the p-value was greater than 0.05. The null for Hypothesis 2 was however rejected at
5% level implying that there is statistically significant difference between the two groups in
2013. The results show that companies who give incentives have greater reduction in emission
2013. The null of Hypothesis 3, 4, 5 and 6 were all failed to be rejected at 5% implying no
significant difference in incentive giving and incentive not giving companies in 2013 and 2012
and no significant change in mean levels of emissions for either groups.
Discussion (ASSESSED): (30%)
Stakeholder theory talks about the role of the various stakeholder groups in influencing
business decision of corporations and organizations. As per the literature explored, stakeholders
are individuals who have some kind of direct or indirect relationship with the organization, such
that their actions are either aligned with the interest of the organization or vice versa. The may be
categorized into groups of varying degrees of influence. These people would hence act in
accordance to the wellbeing of the organization and vice versa. Thus it is expected that their
position on certain issues could very well influence the position and mission, vision and business
strategy of the organization itself.Stakeholder thus have been a key point of interest and
contention in management studies and those involved in environmental awareness campaigns
have also the approach of stakeholders to combat industrial policies which lead to eco-logical
stress and environmental harm.
It was noted that those in the upper management levels who are at the helm of decision
making could be accounted for as key players in the endeavour to reduce industrial carbon
emissions.Knopff et al. (2010), in their paper discussing the ways organization could be made to
transition to a low carbon emission model, they identified introduction of incentive policies to
incorporate newer technologies which lead to lower emissions for the management level. The
literature reviewed for the purpose of research had isolated the industries in US as major
contributors to global carbon emissions, especially due to their dealing sin oil related businesses
and hence the study took those as representatives to study the phenomenon and effectiveness of
incentive policies in reducing carbon emissions among them (Jones and Wicks, 1999). Keeping
all this in mind, using the management employees as the key stakeholders and therefore tools of
effecting environmentally conscious change in the organizations leading up to policy making that
reduces carbon emissions, it is seen that for the most part the success in reducing carbon
emission is slowly manifesting as the levels can be seen to decrease from 2012 to 2013. The
impact of the management as stakeholders however was not found to be statistically significant
in 2012. This however could be seen to have overturned in 2013 where companies with policies
to incentivize the management for opting policies to reduce emissions was found to have greater
percentage change in carbon emissions. The paper carried out six t-tests to explore the tentative
relationship of the management as a stakeholder and the impact on emission output measured by
percentage change in emissions.Even though the difference could not be found to be significant
for the same group in subsequent years, it is seen that some impact can be identified.
Consequently the study finds that incentive policies have for the most part not been as
successful so as to usher in drastic change in policy within the companies who have adopted
them and even so have not been able to effect immediate significant change between 2012 and
2013. It is not clear whether the policies would have significant impact on a long term basis.
However in 2013 some marginal change in the positive direction as far as reduction in emission
is concerned indicates that some positive impact may be a possibility. However further in depth
and persistent inquiry shall be required to come to any decisive conclusion regarding the
effectiveness of incentivizing the stakeholder group of management level employees to curb
carbon based emissions in the United States at least.
Limitations (ASSESSED): (10%)
The sample used for the study is less than size 50. The sample again had outliers which
led to the usable sample size to be 26. This is too small to amount to any robust result for the
inferential test. The minimum sample size to ensure 95% confidence and 0.05 level of margin of
error is about 250 to 300 which is much higher than the size considered. The t-test also has the
assumption of normality which is never verified given the small size of the sample. The study
therefore is limited in representation. The data also considered only 2 consecutive years to
explore any significant change exists or not. Naturally it is not practical to assume that a
company would be willing to effect such drastic change in policy, endangering its business
process at one go. Thus the scope of the study ought to be more diversified both in terms of
sample size as well as the time. Another limitation is that the study only focussed on companies
which are based in the United States. However many multinational companies of significant
impact in terms of carbon emissions are from outside the US. In fact Asia and South Asia is a
significant player when it comes to carbon emissions, indicating that companies relating to and
based in the regions should also be considered.
Secure Best Marks with AI Grader
Need help grading? Try our AI Grader for instant feedback on your assignments.
Further Research (ASSESSED): (10%)
The study first of all should aim to increase more companies spread out across various
sectors over a longer period of time. The data would then take the structure of a longitudinal
data. The study could include more stakeholders such as the customers as well as the
governments and their policies in their area of operations in addition to the management. The
study would then be required to expand its scope to primary data analysis by collecting opinions
via interviews and surveys of the various stakeholders. The study should also aim to take at least
5 years’ worth of readings and at least 300 companies and even greater number of observations
from the consumers. The study should take companies which are not just limited to the USA but
also from other locations, especially from industrially developing and active regions such as
China and India.
Reference for tast 1 and task 2 and task 3
Knopf, B., Edenhofer, O., Flachsland, C., Kok, M.T., Lotze-Campen, H., Luderer, G., Popp, A.
and Van Vuuren, D.P., 2010. Managing the low-carbon transition–from model results to
policies. The Energy Journal, pp.223-245.
Brenner, S.N. andMolander, E.A., 1977. Is ethics of business changing. Harvard Business
Review, 55(1), pp.57-71.
Bridoux, F. and Stoelhorst, J.W., 2014. Microfoundations for stakeholder theory: Managing
stakeholders with heterogeneous motives. Strategic Management Journal, 35(1), pp.107-125.
Clarkson, M.E., 1995. A stakeholder framework for analyzing and evaluating corporate social
performance. Academy of management review, 20(1), pp.92-117.
Donaldson, T., and Preston, L. E. (1995). The stakeholder theory of the corporation: Concepts,
evidence, and implications. Academy of management Review, 20(1), 65-91.
George, B., 2003. Managing stakeholders vs. responding to shareholders. Strategy and
Leadership, 31(6), pp.36-40.
Halal, W.E., 1990. The new management: Business and social institutions in the information
age. Business in the Contemporary World, 2(2), pp.41-54.
Jones, T.M. and Wicks, A.C., 1999. Convergent stakeholder theory. Academy of management
review, 24(2), pp.206-221.
Kreiner, P., A. Bhambri. 1991. Influence and information in organization-stakeholder
relationships. J. E. Post (Ed.) Research in Corporate Social performance and Policy, 12, pp.3-
36.
Wang, J. and Dewhirst, H.D., 1992. Boards of directors and stakeholder orientation. Journal of
business ethics, 11(2), pp.115-123.
Brenner, S.N. and Cochran, P., 1991, July. The stakeholder theory of the firm: Implications for
business and society theory and research. In Proceedings of the international association for
business and society (Vol. 2, pp. 897-933).

Mitchell, R.K. and Agle, B.R., 1997, July. Stakeholder identification and salience: Dialogue and
operationalization. In Proceedings of the International Association for Business and
Society (Vol. 8, pp. 717-727).
Norušis, M.J., 2006. SPSS 14.0 guide to data analysis. Upper Saddle River, NJ: Prentice Hall.
operationalization. In Proceedings of the International Association for Business and
Society (Vol. 8, pp. 717-727).
Norušis, M.J., 2006. SPSS 14.0 guide to data analysis. Upper Saddle River, NJ: Prentice Hall.
1 out of 25
Related Documents


Your All-in-One AI-Powered Toolkit for Academic Success.
+13062052269
info@desklib.com
Available 24*7 on WhatsApp / Email
![[object Object]](/_next/static/media/star-bottom.7253800d.svg)
Unlock your academic potential
© 2024 | Zucol Services PVT LTD | All rights reserved.