logo

Stat Analysis Case Study Assignment

7 Pages797 Words41 Views
   

Added on  2020-04-15

Stat Analysis Case Study Assignment

   Added on 2020-04-15

ShareRelated Documents
STAT ANALYSISCASESTUDYASSIGNMENT 3Student id[Pick the date]
Stat Analysis Case Study Assignment_1
Case 1(a)i) For the given hypothesis testing, it would be appropriate to use a z test statistic insteadof a t test statistic. This is because in the given case, the given binomial distribution canbe approximated as normal distribution owing to the satisfaction of the underlyingassumptions.Sample size (n)=200Observed proportion (p)=165200=0.825Hence, np>10alsonp(1p)>10Considering the above, it would be appropriate to assume the given sample as normal andhence z test would be the appropriate choice.ii) This would be a test for population proportion as the given data relates to the proportionof the students passed and not the average students that pass. Also, the mean would besubject to change due to count of students graduating and hence proportion would be moresuitable as it expresses pass performance in relative terms and not absolute terms.iii) The appropriate formula for computation of z test statistic is given below.zsamplestatistics=^pp0p0(1p0)nHere, ^p=sampleproportion=0.825p0=hypothesizepopulationproportion=0.77n=sample¿200z=0.8250.770.77(10.77)200z=1.848Hence, the value of sample test statistics comes out to be 1.848. (b)Hypothesis testing Step 1: Hypotheses
Stat Analysis Case Study Assignment_2
Null hypothesis H0: Percentage of graduates is equal to 0.77. p=0.77Alternative hypothesis H1:Percentage of graduates is not equal to 0.77. p0.77Step 3: Test statistic and significance level Level of significance = 0.01 Test statisticz=0.8250.770.77(10.77)200z=1.848Step 3: Decision rule According to the decision rule, null hypothesis would be rejected when the p value is lowerthan the level of significance. Similarly, as a result alternative hypothesis would be accepted. Step 4: p value and decision The p value for z statistic 1.848 comes out to be 0.9677. It can be seen that the p value is 0.9677 which is higher than the level of significance (0.01).Hence, insufficient evidence presents to reject the null hypothesis. As a result, alternativehypothesis would not be accepted. Step 5: interpretation of the decision It would be fair to conclude that null hypothesis would not be rejected and thus, percentage ofgraduates is equal to 0.77. (c)95% confidence interval for population proportion The z value for 95% confidence interval = 1.96 Confidence interval ¿^p±z^p(1^p)nUpper limit of 95% confidence interval ¿^p+z^p(1^p)n¿0.825+1.960.825(10.825)200¿0.877
Stat Analysis Case Study Assignment_3

End of preview

Want to access all the pages? Upload your documents or become a member.

Related Documents
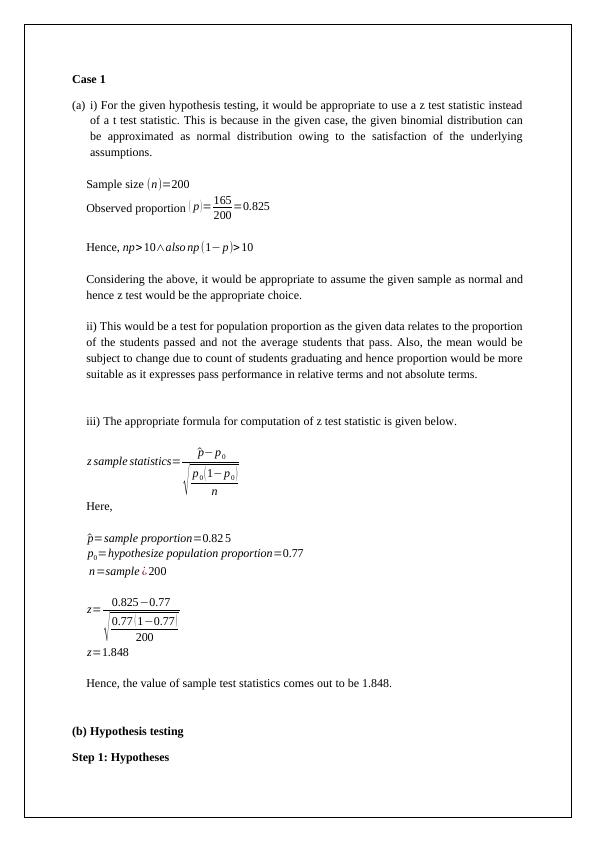
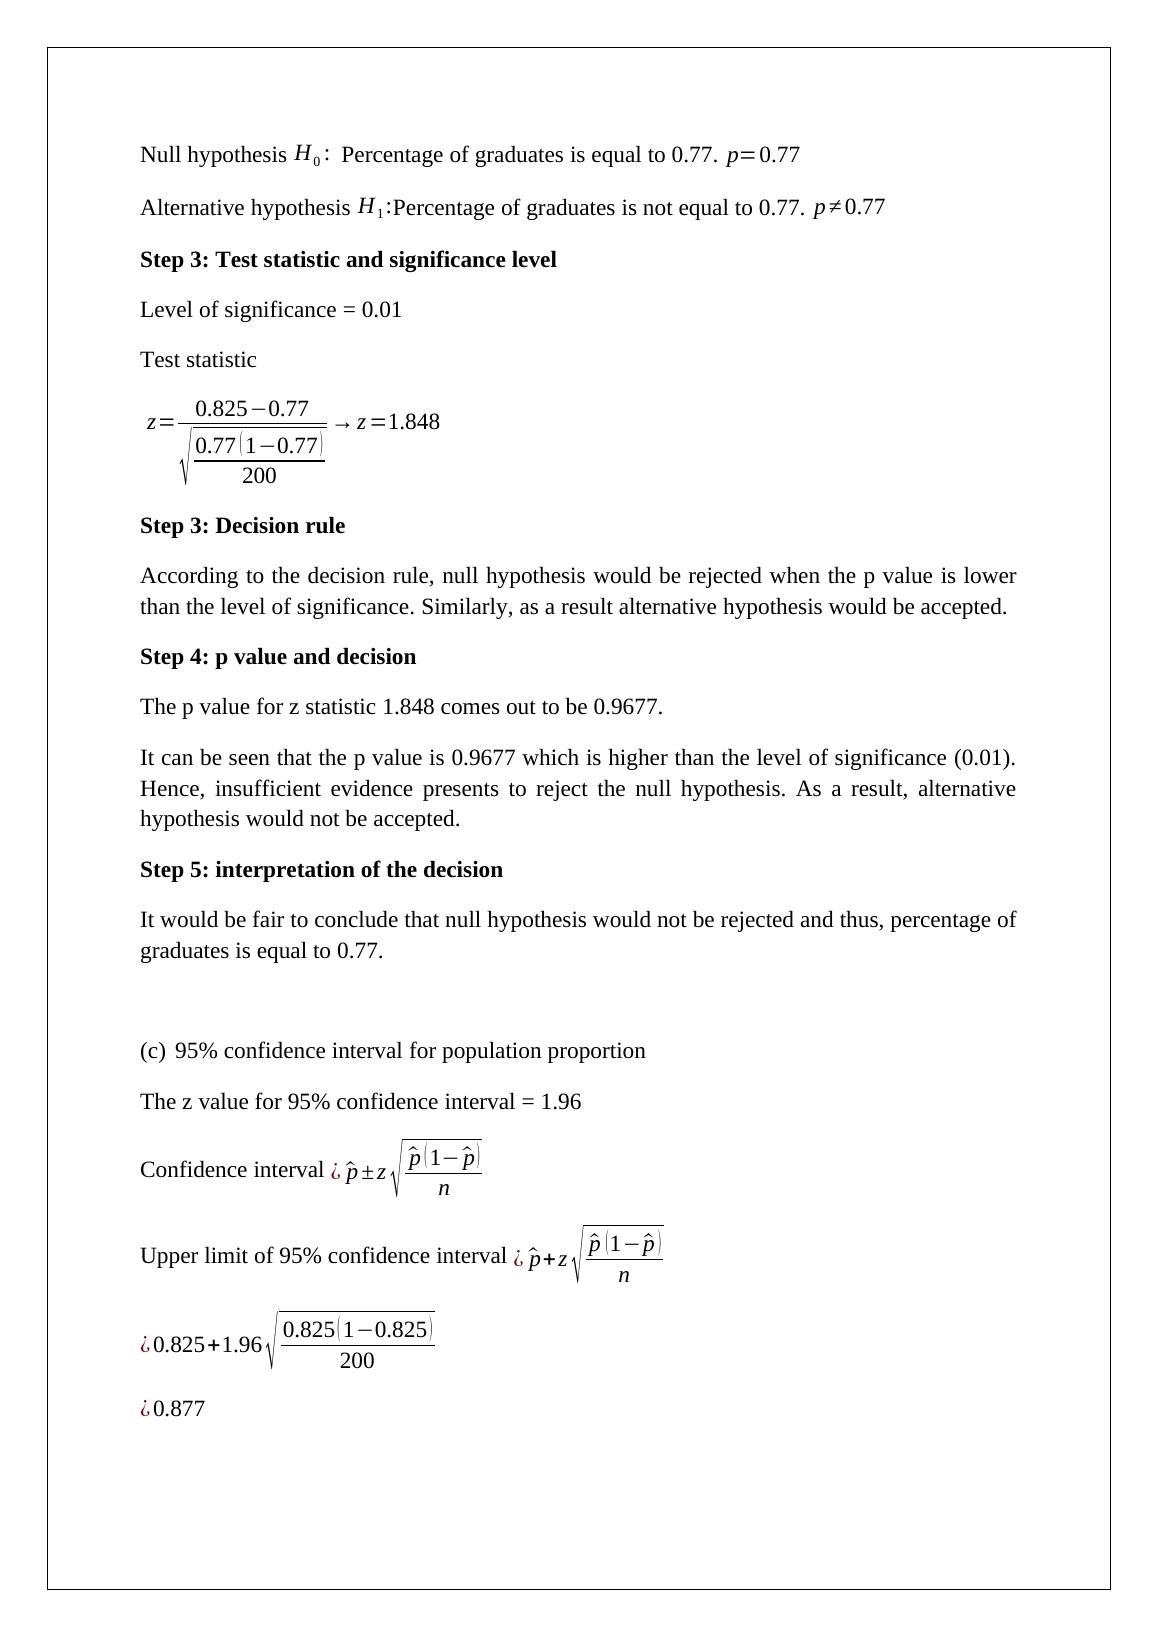
Analysing your College Graduation Rate Number of Students = 200 Number of graduated students = 77%
|6
|765
|470

Mathematical Statistics Assignment Report
|8
|444
|22

Statistics Study Material
|10
|1445
|24

Assignment On Statistics (Doc)
|5
|846
|367

Hypothesis Testing and Contingency Table Analysis in Statistics
|7
|1071
|107

Econometrics and Business Statistics (ECON634) Semester 2, 2018 Take-home Test
|14
|1832
|429