Comprehensive Financial Analysis: Statements and Investment Appraisal
VerifiedAdded on 2020/10/23
|16
|3816
|85
Report
AI Summary
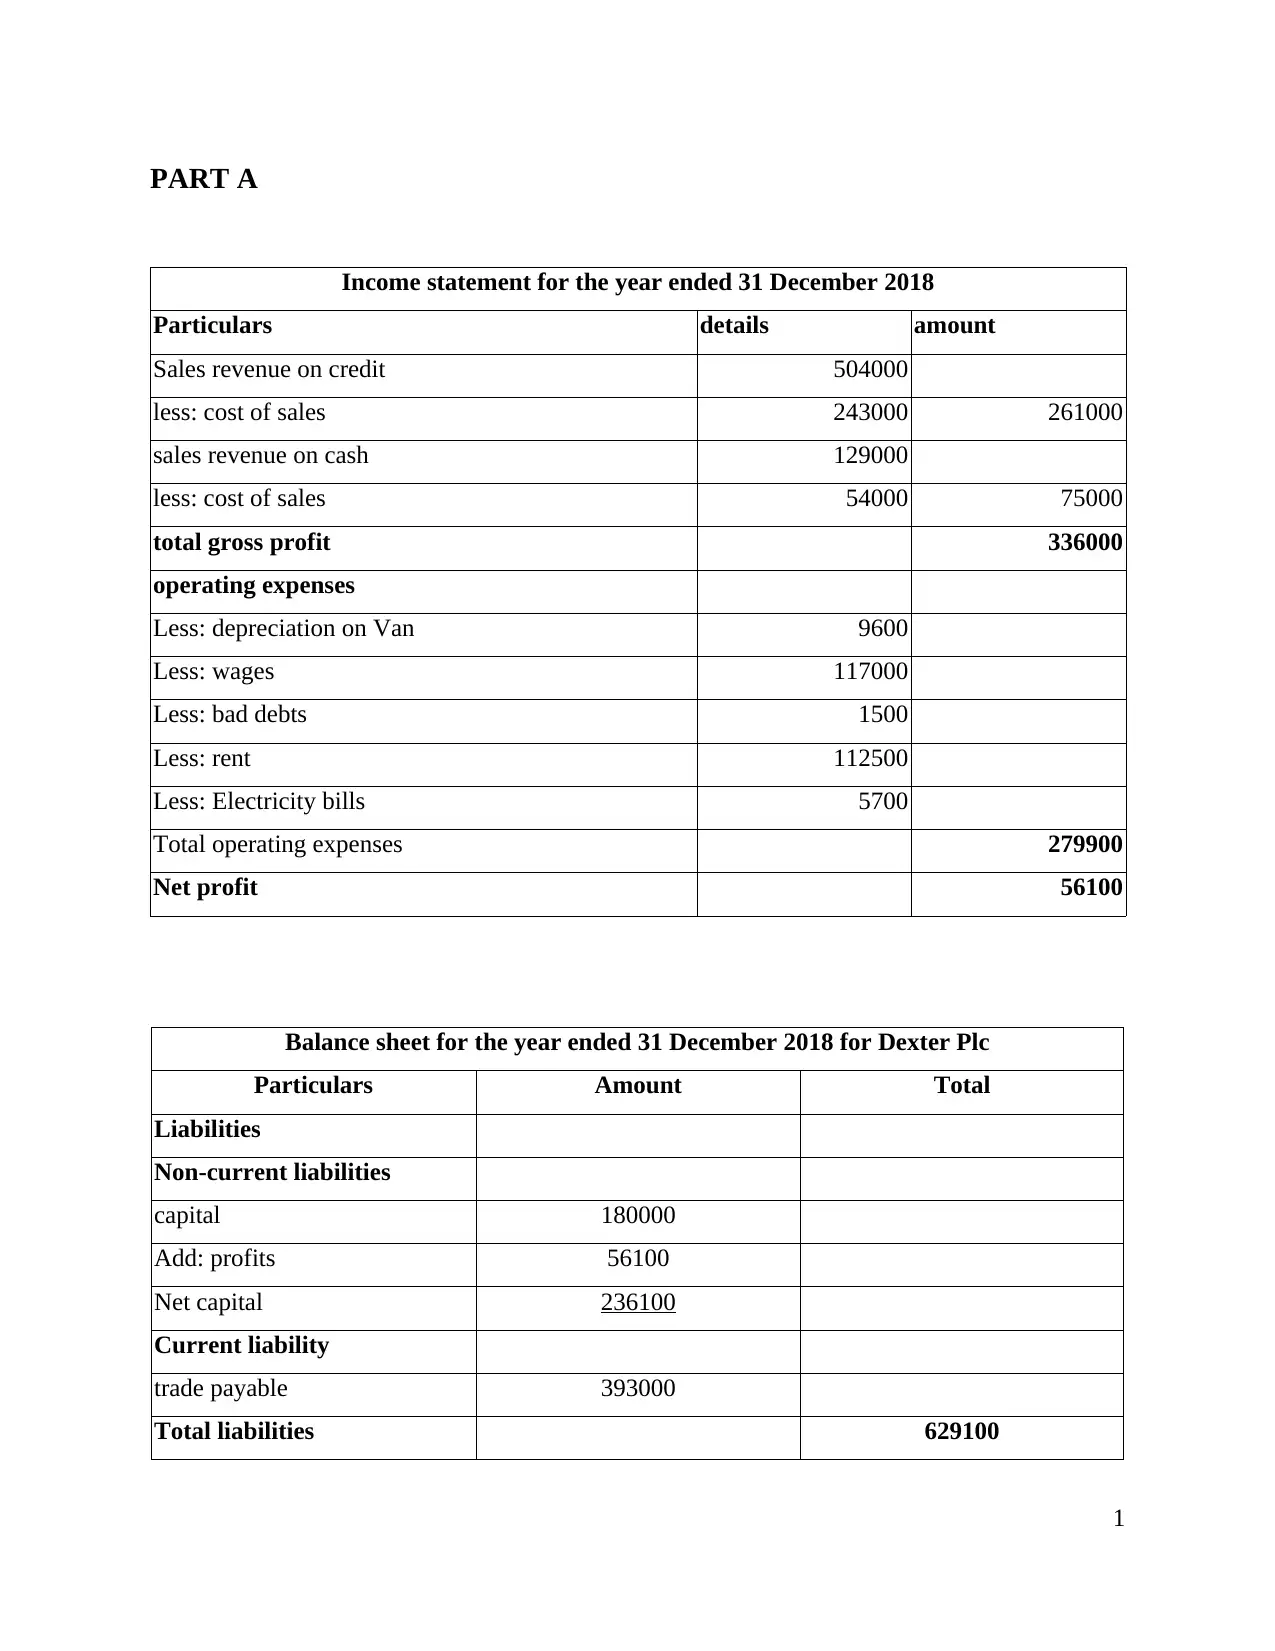
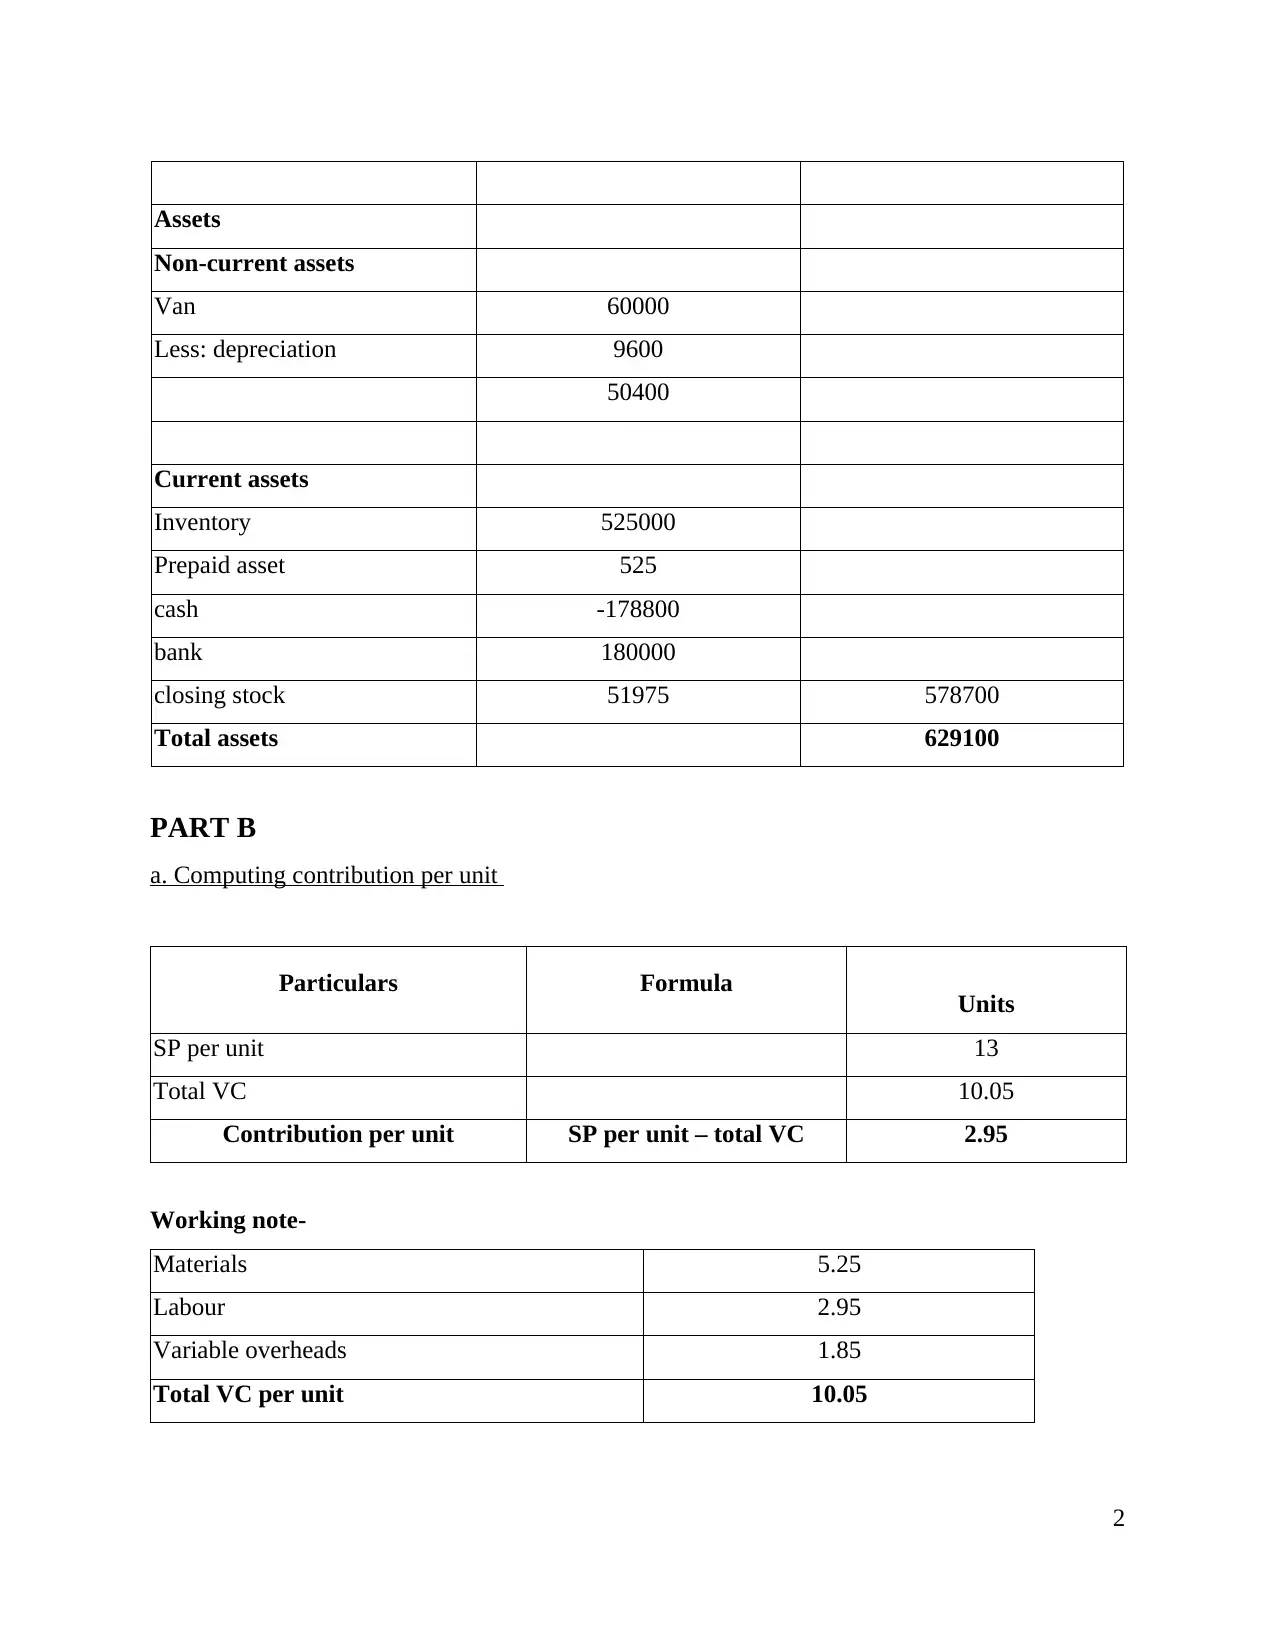
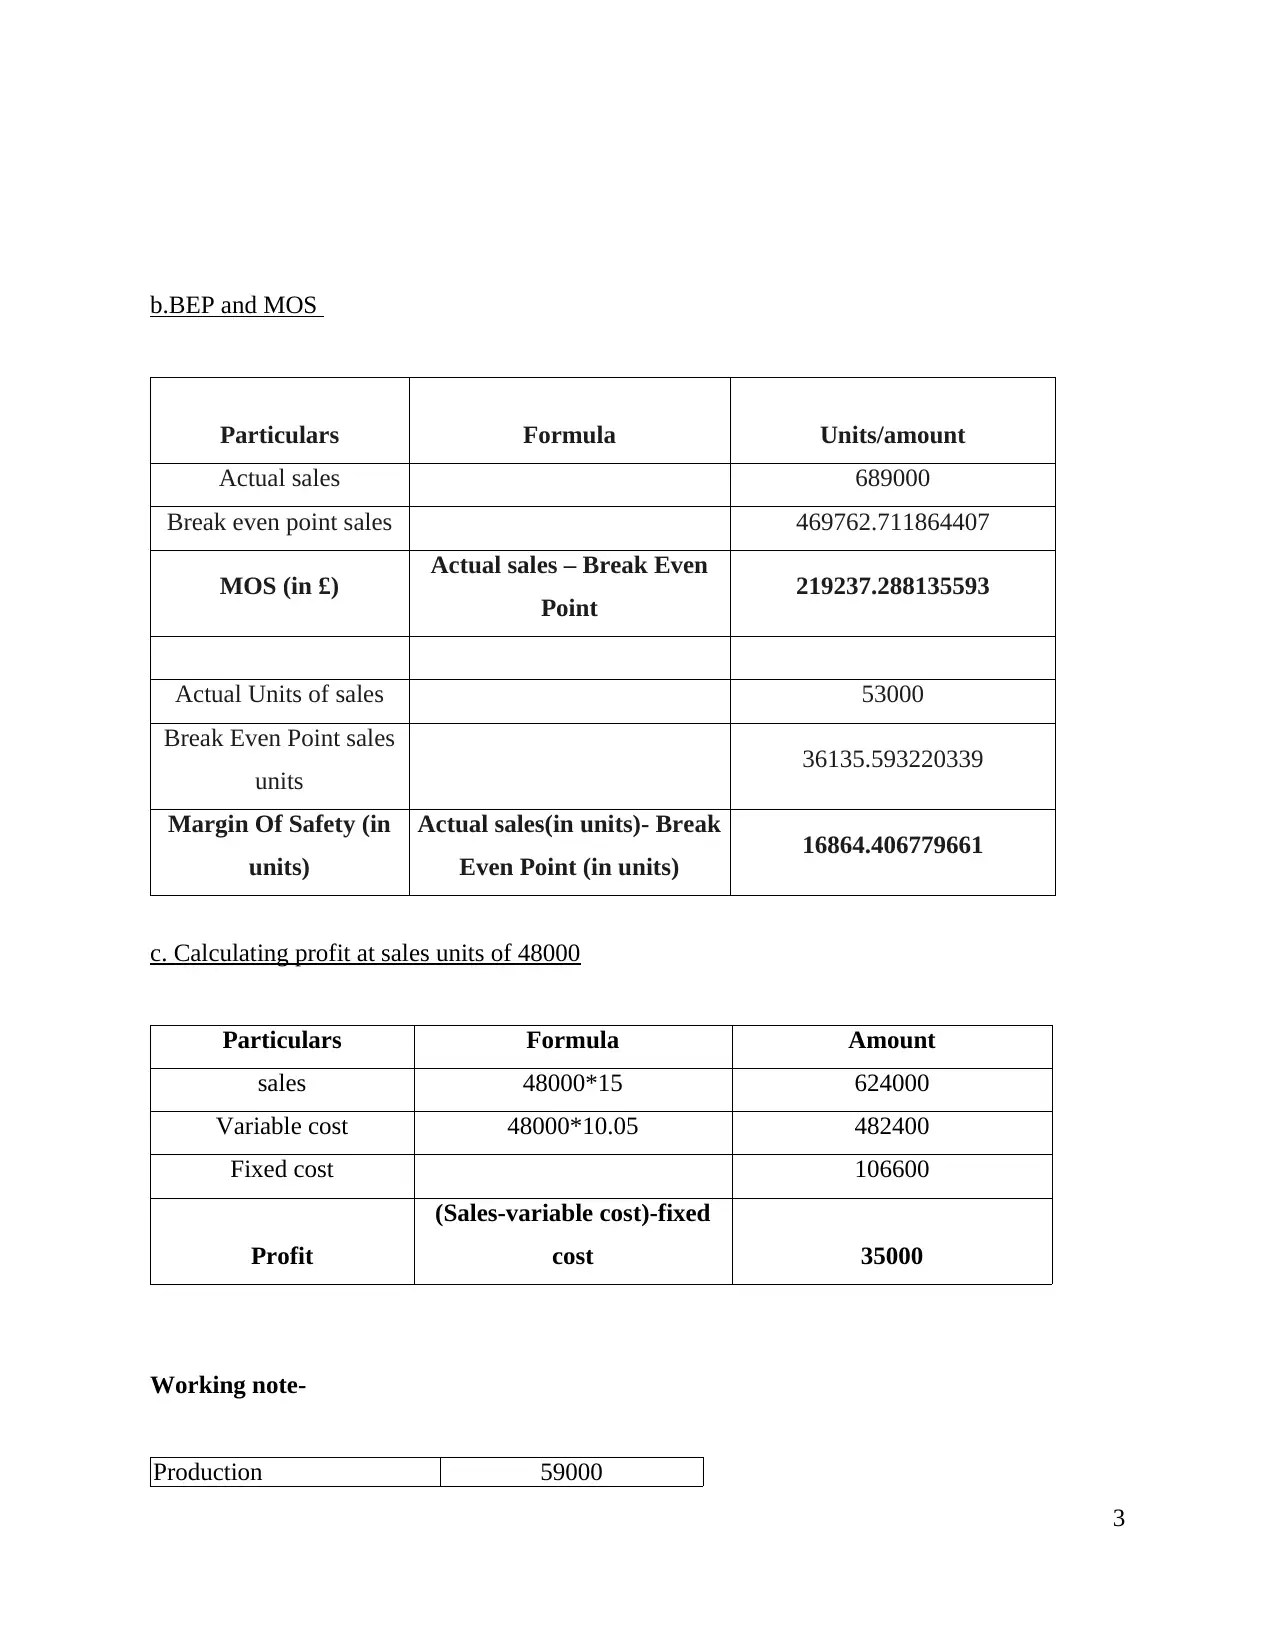
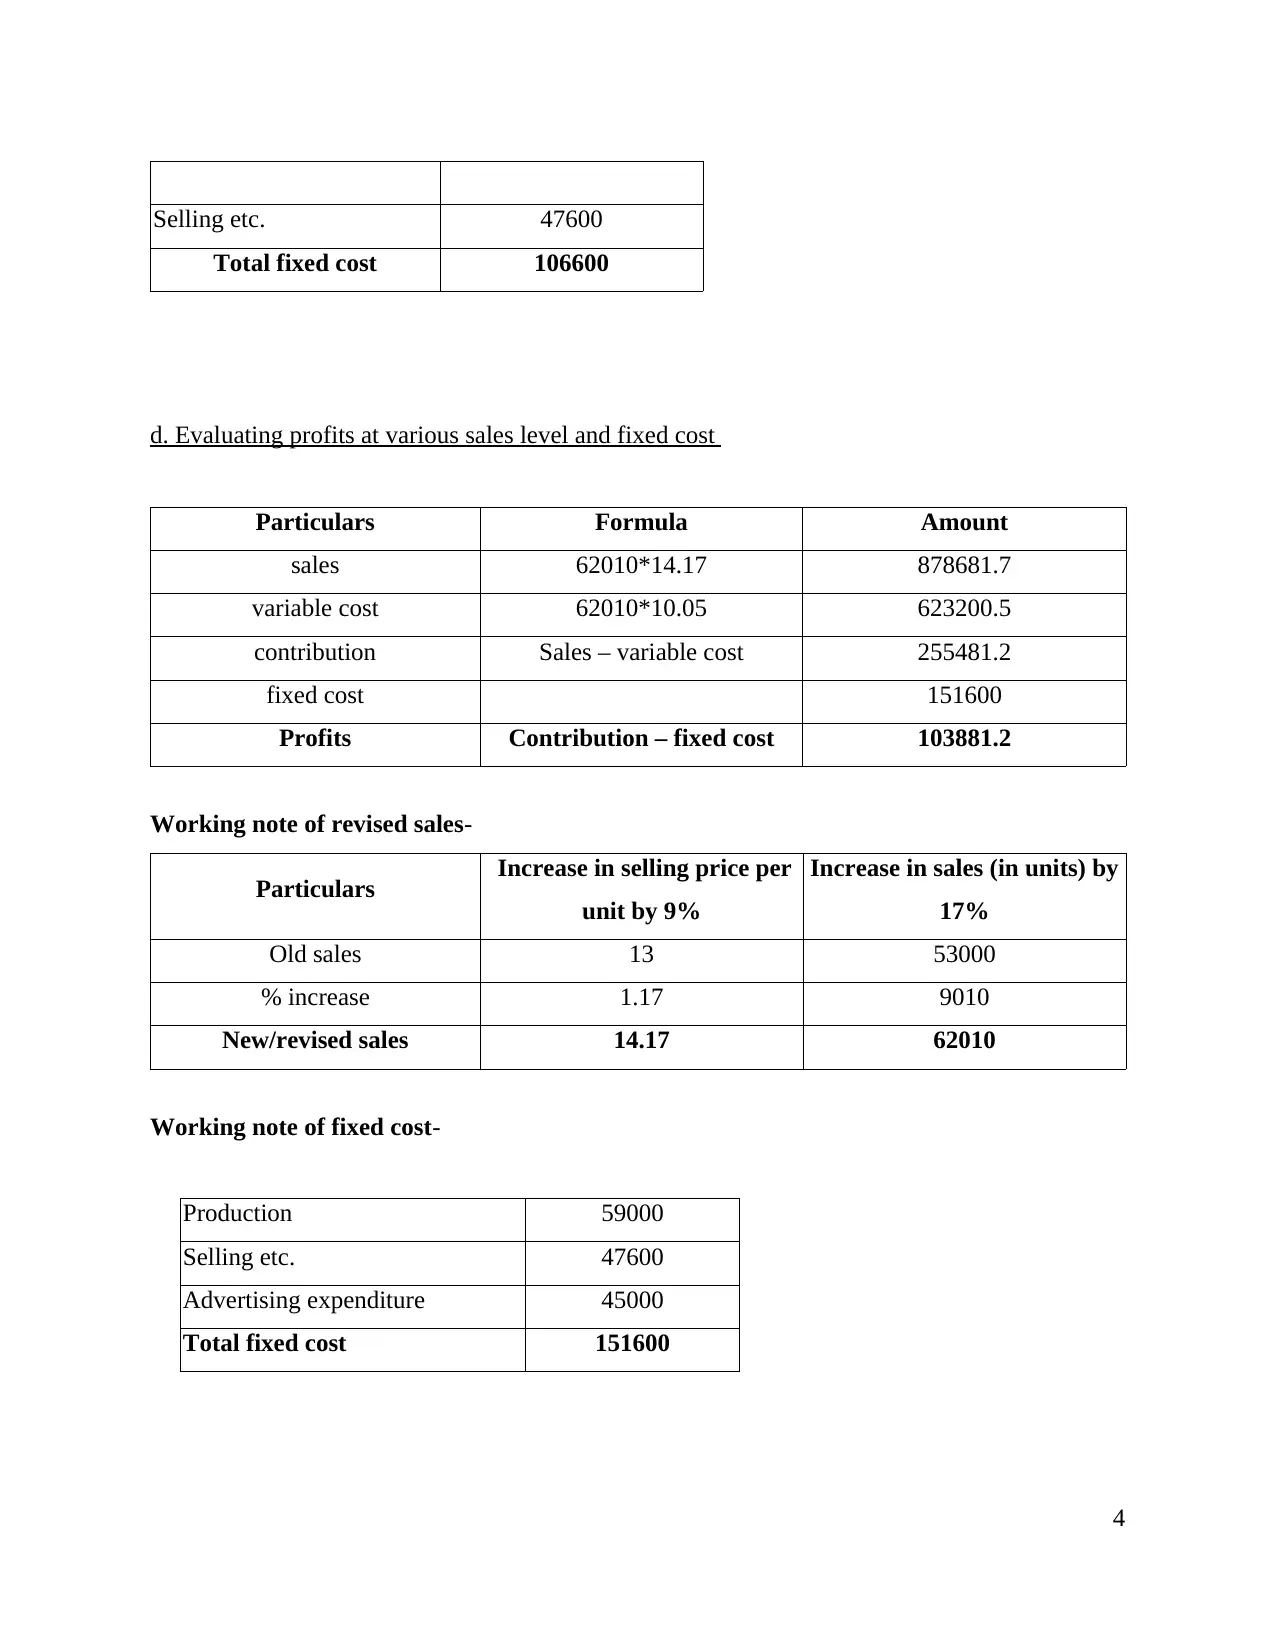
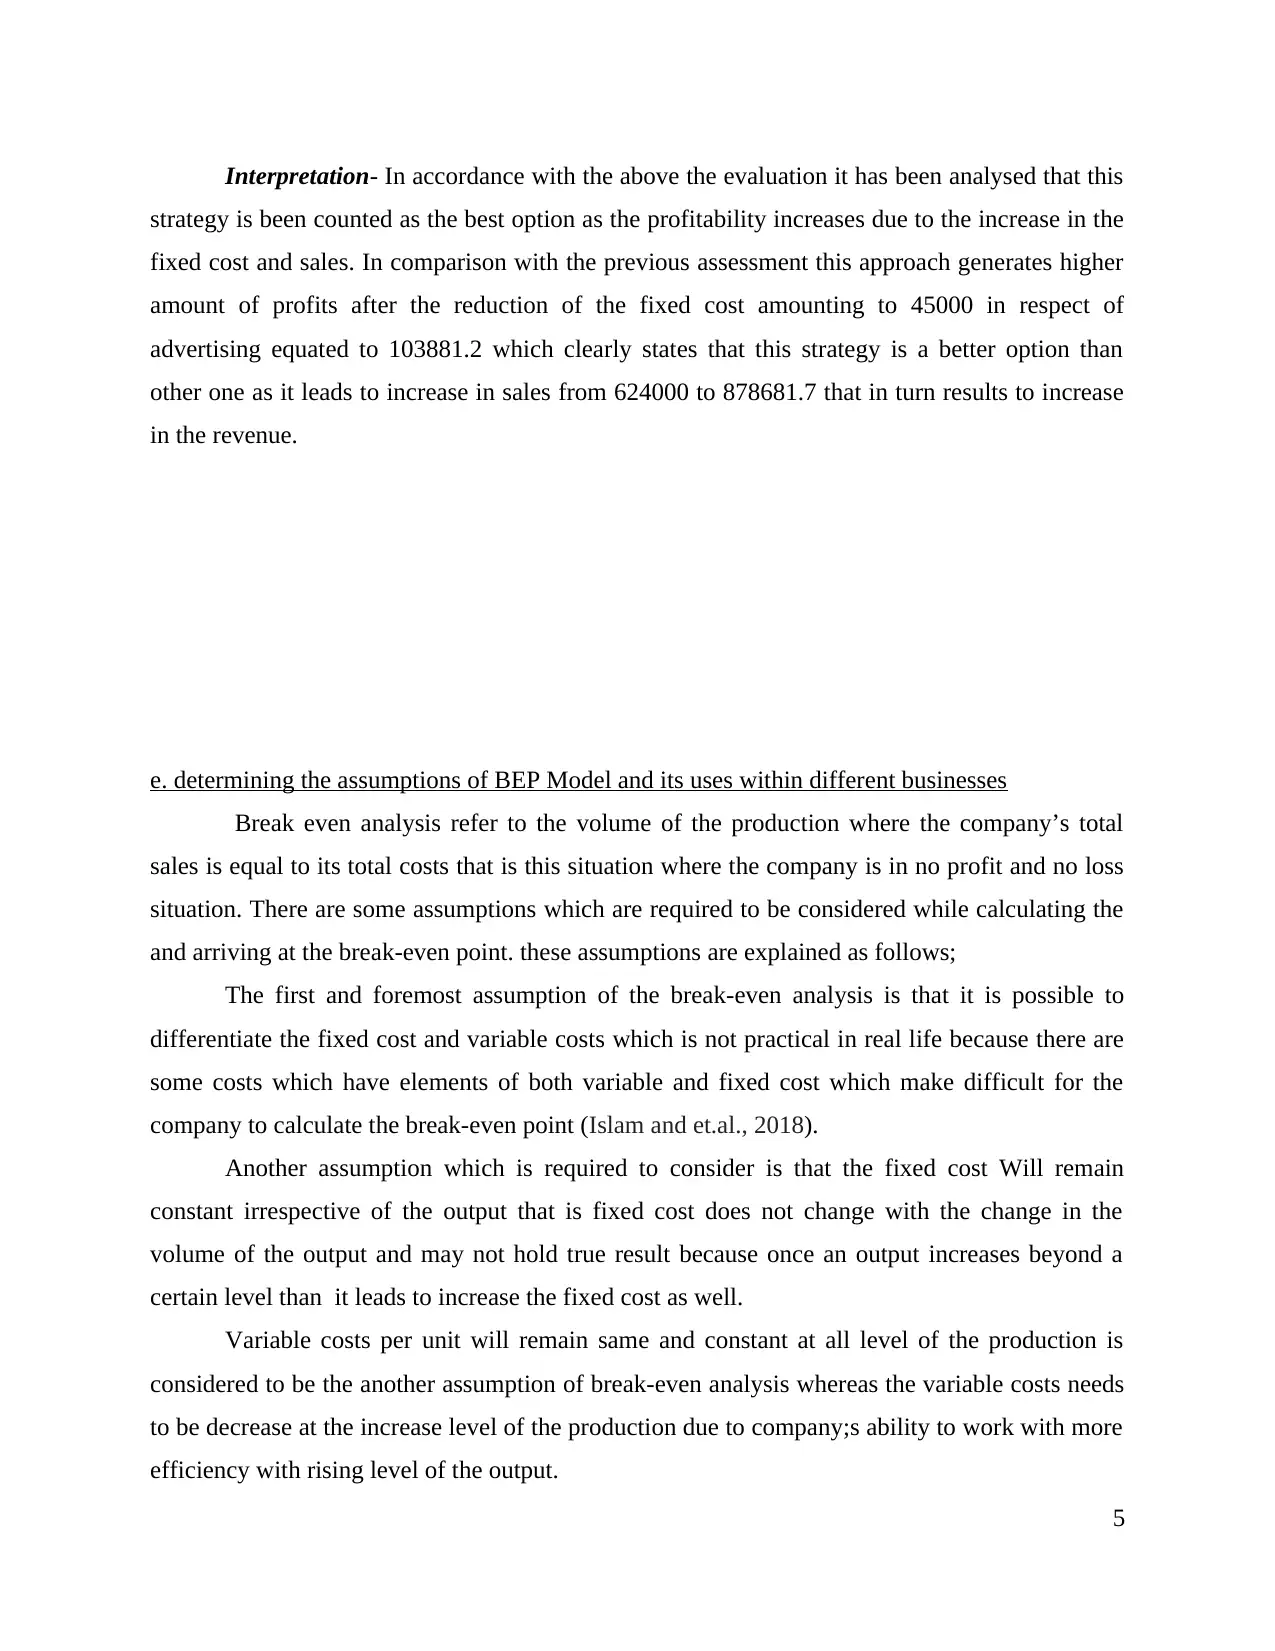
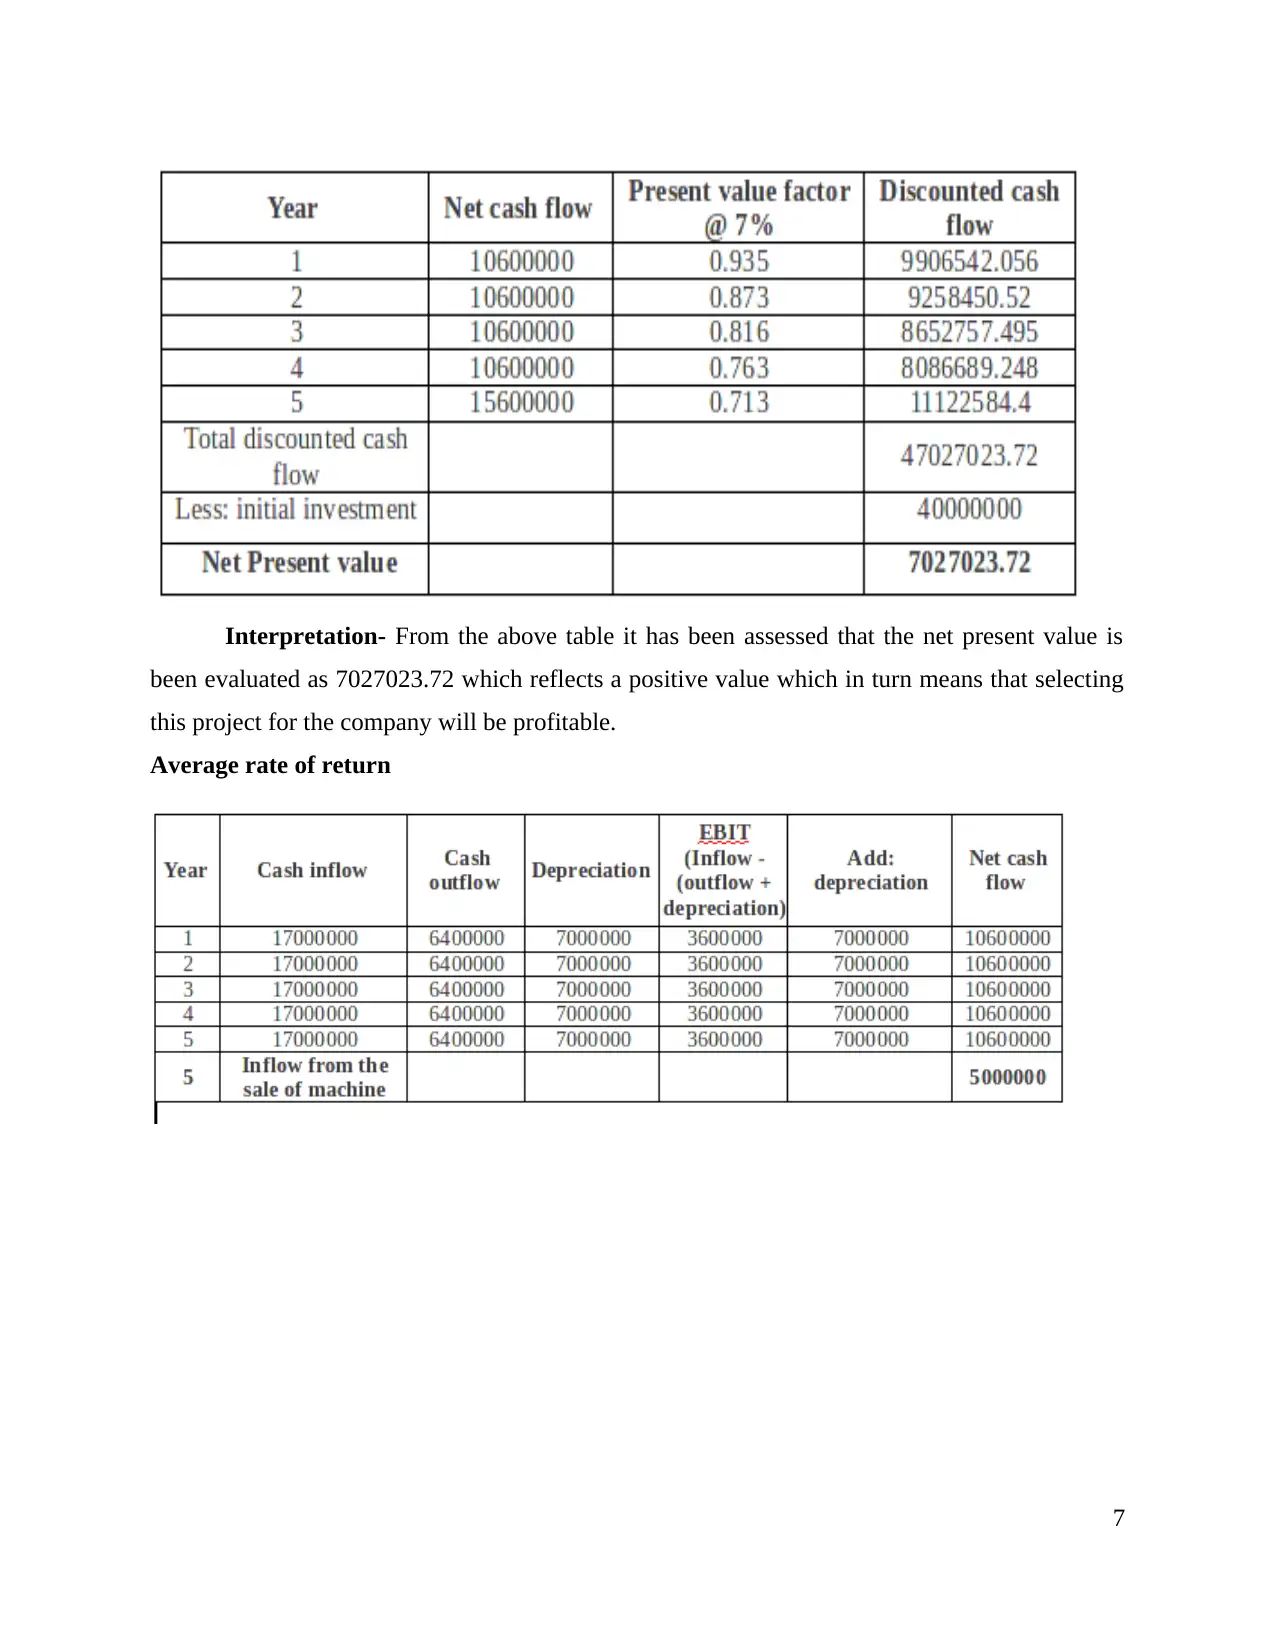
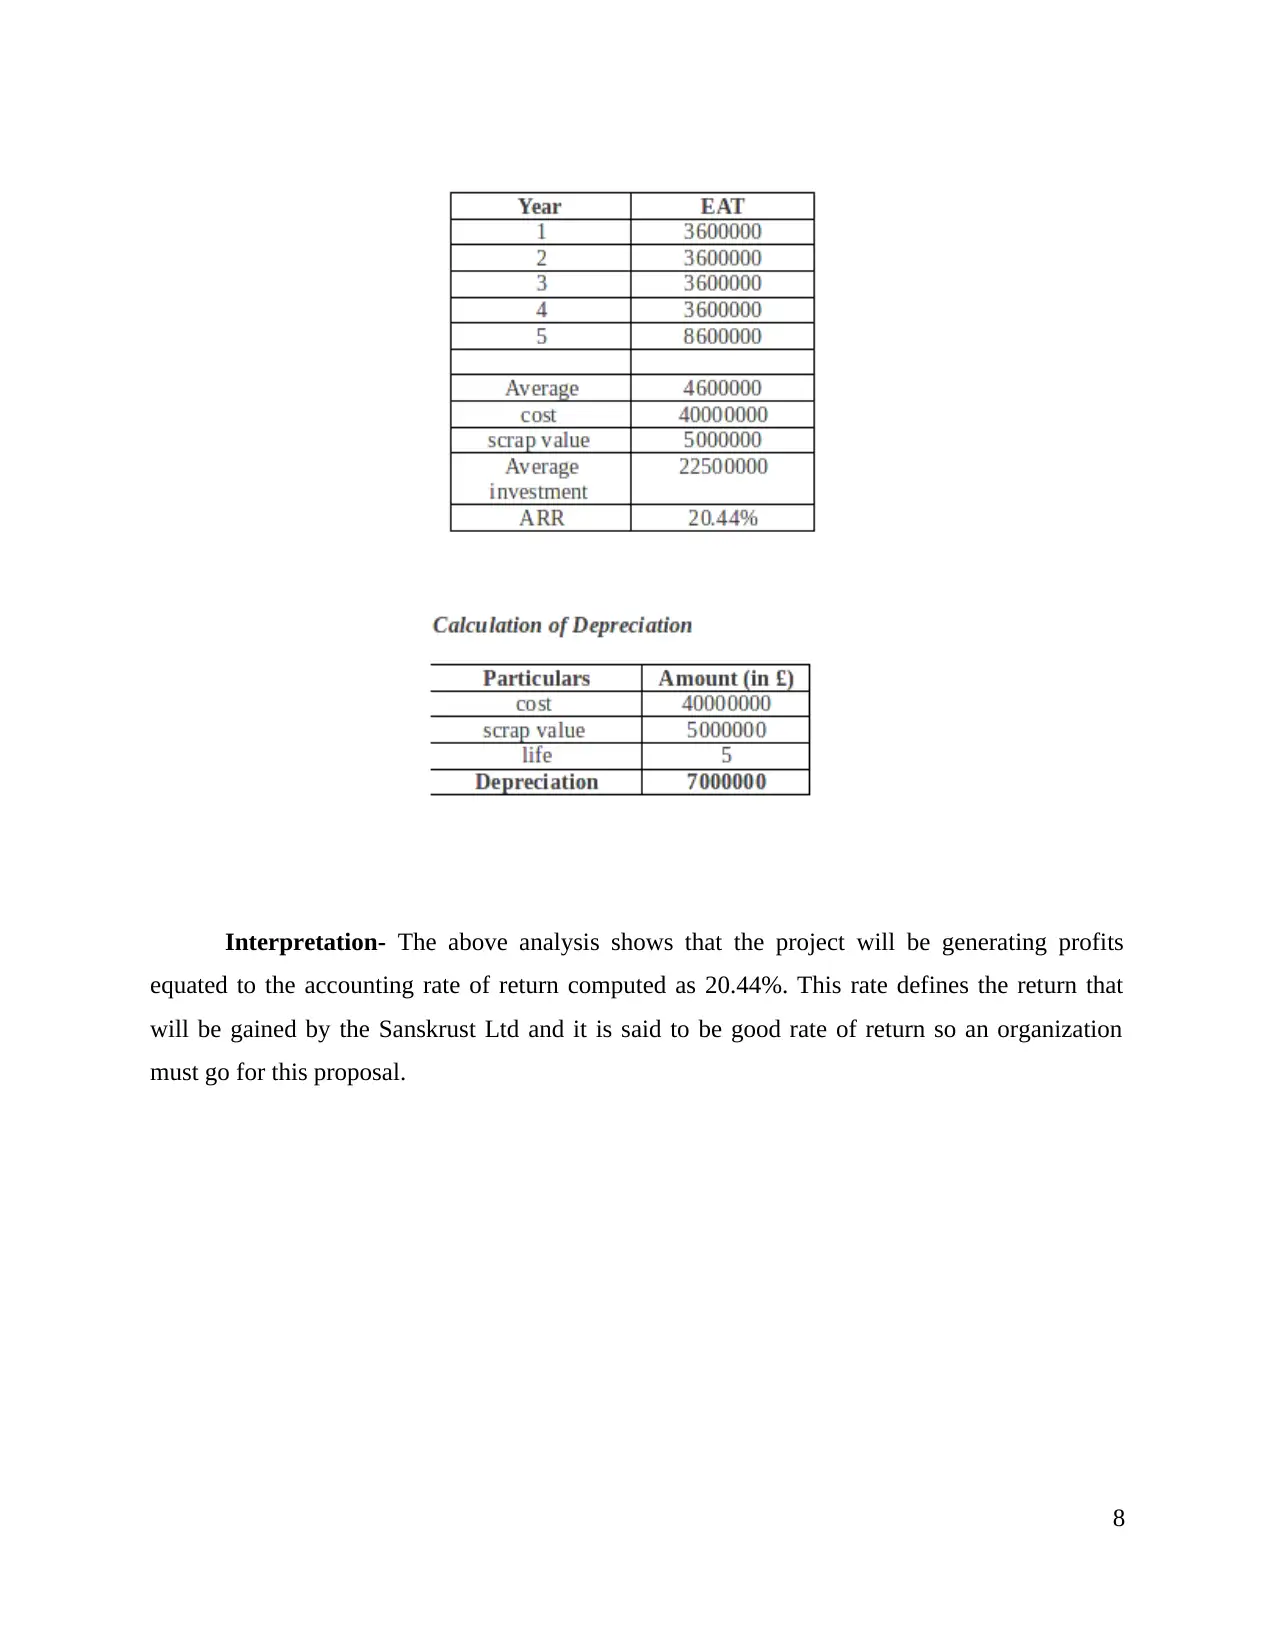
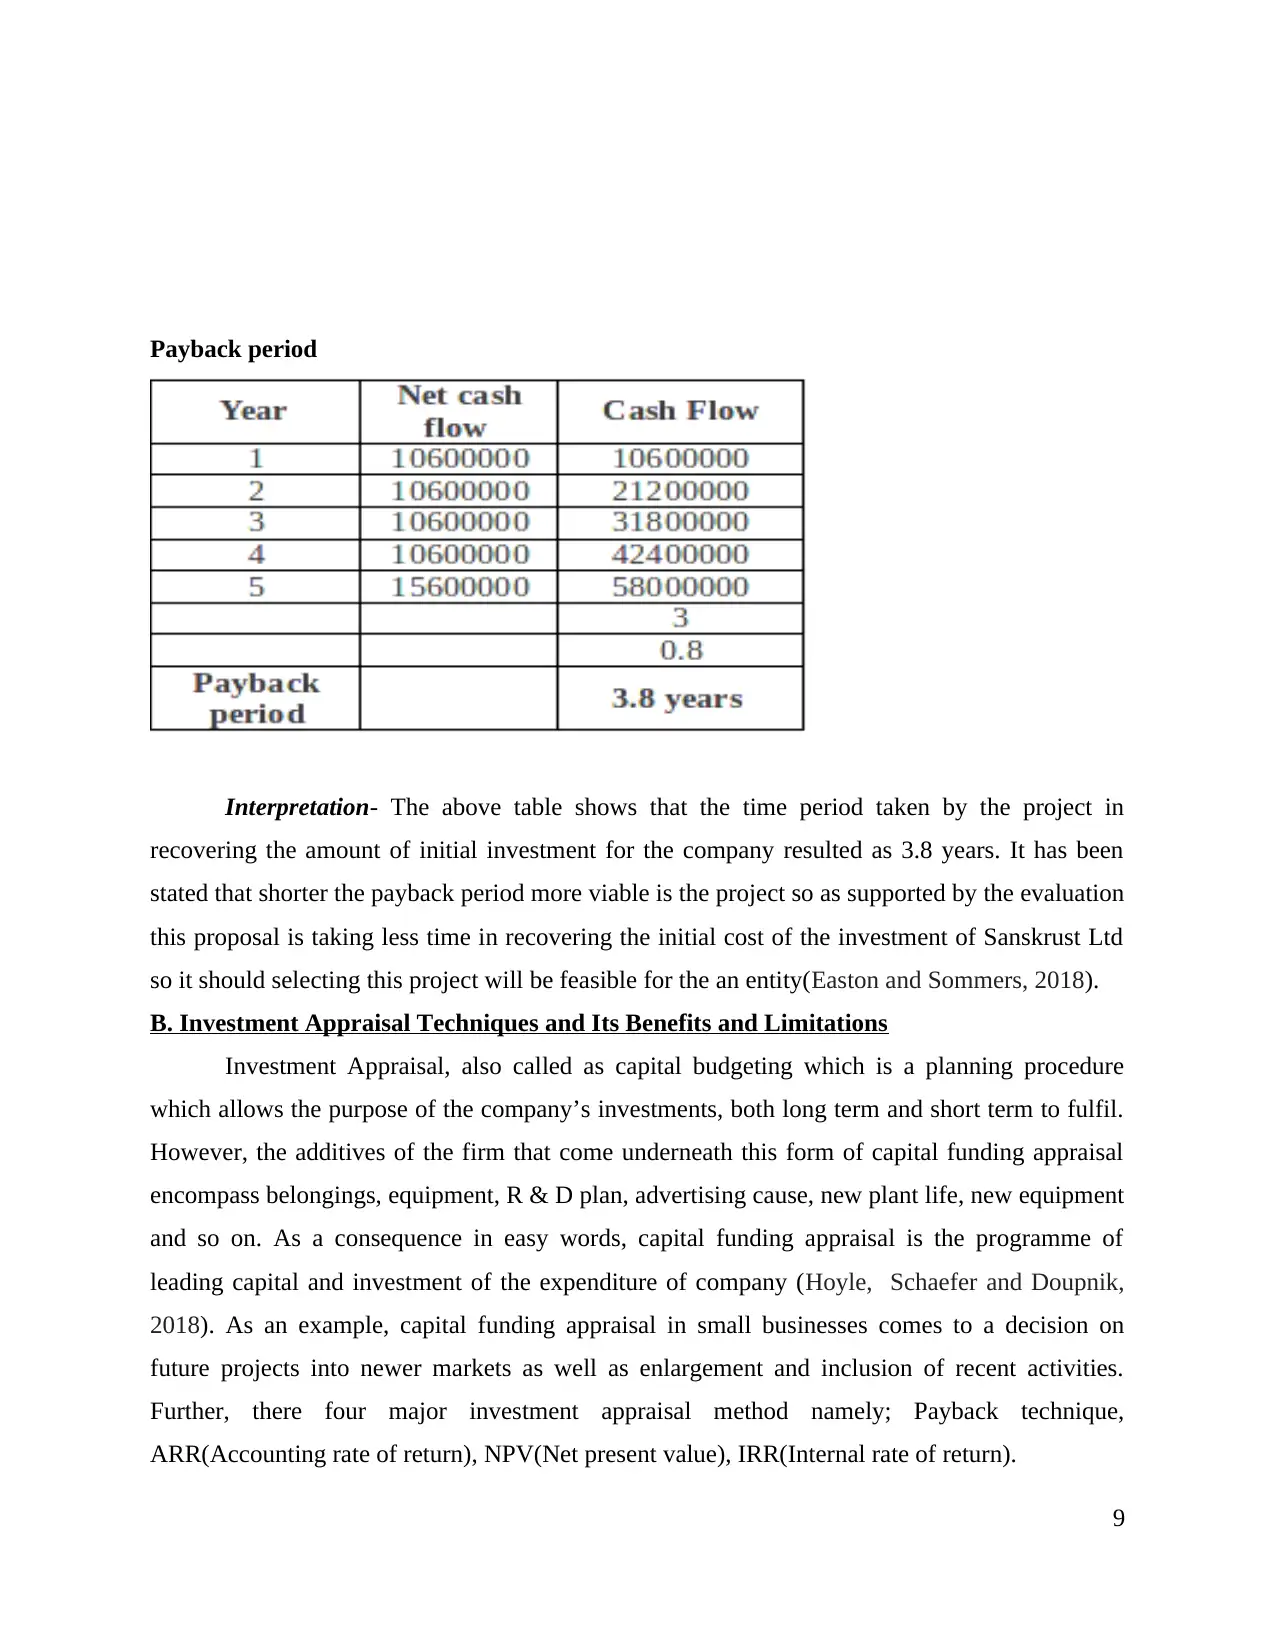
This report provides a detailed financial analysis, beginning with an income statement and balance sheet for Dexter Plc, covering the year ended December 31, 2018. It then delves into break-even analysis for Philly Ltd., calculating contribution per unit, break-even point, margin of safety, and profit at various sales levels. The report evaluates the impact of changes in selling price and fixed costs on profitability. Furthermore, it presents investment appraisal techniques for Sankrust Ltd., including net present value, average rate of return, and payback period, along with their interpretations. Finally, the report discusses the benefits and limitations of different investment appraisal methods and the advantages and disadvantages of budgets, including operating, financial, and cash flow budgets. The report draws on financial analysis principles to assess business performance and investment viability.

STATEMENT OF INCOME,
STATEMENT OF FINANCIAL
POSITION REPORTS
STATEMENT OF FINANCIAL
POSITION REPORTS
Paraphrase This Document
Need a fresh take? Get an instant paraphrase of this document with our AI Paraphraser

Table of Contents
1.0
INTRODUCTION.............................................................................................................................
PART A...........................................................................................................................................1
PART B............................................................................................................................................3
PART C............................................................................................................................................6
A. Net Present Value, Average Rate of Return, Payback Period...............................................6
B. Investment Appraisal Techniques and Its Benefits and Limitations.....................................8
C. Budgets as a tool for strategic planning and their benefits....................................................9
2.0 CONCLUSION........................................................................................................................11
3.0 REFERENCES........................................................................................................................12

1.0 INTRODUCTION
A statement of income is one of the three crucial financial statements used for analysing a
business enterprise's financial performance over a particular accounting duration, with the
opposite key statements being the balance sheet and the statement of cashflows. However, it is
also known as the profit and loss statements or the declaration of revenue and fee, the income
declaration in most cases concentrates employer’s sales and fees at some point of a particular
duration. Hence, the report will highlight the income statement for the year ended 31st December
2018 and the financial position statement of dexter plc (Kieso, Weygandt and Warfield, 2016).
Further, the project will highlight the break-even analyses of philly ltd. and along with
that it will highlight the calculation of payback period, accounting rate of return, and the net
present value of the sankrust ltd. Moreover, the project will frame the different investment
appraisal methods and their advantage and disadvantages which includes payback period, net
present value, accounting rate of return and internal rate of return etc. Eventually, the assignment
will highlight the key advantages and disadvantages of budgets and their types which is inclusive
of operating budget, financial budget and cash flow budget (Cao, Chychyla and Stewart, 2015).
⊘ This is a preview!⊘
Do you want full access?
Subscribe today to unlock all pages.

Trusted by 1+ million students worldwide

PART A
Income statement for the year ended 31 December 2018
Particulars details amount
Sales revenue on credit 504000
less: cost of sales 243000 261000
sales revenue on cash 129000
less: cost of sales 54000 75000
total gross profit 336000
operating expenses
Less: depreciation on Van 9600
Less: wages 117000
Less: bad debts 1500
Less: rent 112500
Less: Electricity bills 5700
Total operating expenses 279900
Net profit 56100
Balance sheet for the year ended 31 December 2018 for Dexter Plc
Particulars Amount Total
Liabilities
Non-current liabilities
capital 180000
Add: profits 56100
Net capital 236100
Current liability
trade payable 393000
Total liabilities 629100
1
Paraphrase This Document
Need a fresh take? Get an instant paraphrase of this document with our AI Paraphraser

Assets
Non-current assets
Van 60000
Less: depreciation 9600
50400
Current assets
Inventory 525000
Prepaid asset 525
cash -178800
bank 180000
closing stock 51975 578700
Total assets 629100
PART B
a. Computing contribution per unit
Particulars Formula Units
SP per unit 13
Total VC 10.05
Contribution per unit SP per unit – total VC 2.95
Working note-
Materials 5.25
Labour 2.95
Variable overheads 1.85
Total VC per unit 10.05
2

b.BEP and MOS
Particulars Formula Units/amount
Actual sales 689000
Break even point sales 469762.711864407
MOS (in £) Actual sales – Break Even
Point 219237.288135593
Actual Units of sales 53000
Break Even Point sales
units 36135.593220339
Margin Of Safety (in
units)
Actual sales(in units)- Break
Even Point (in units) 16864.406779661
c. Calculating profit at sales units of 48000
Particulars Formula Amount
sales 48000*15 624000
Variable cost 48000*10.05 482400
Fixed cost 106600
Profit
(Sales-variable cost)-fixed
cost 35000
Working note-
Production 59000
3
⊘ This is a preview!⊘
Do you want full access?
Subscribe today to unlock all pages.

Trusted by 1+ million students worldwide

Selling etc. 47600
Total fixed cost 106600
d. Evaluating profits at various sales level and fixed cost
Particulars Formula Amount
sales 62010*14.17 878681.7
variable cost 62010*10.05 623200.5
contribution Sales – variable cost 255481.2
fixed cost 151600
Profits Contribution – fixed cost 103881.2
Working note of revised sales-
Particulars Increase in selling price per
unit by 9%
Increase in sales (in units) by
17%
Old sales 13 53000
% increase 1.17 9010
New/revised sales 14.17 62010
Working note of fixed cost-
Production 59000
Selling etc. 47600
Advertising expenditure 45000
Total fixed cost 151600
4
Paraphrase This Document
Need a fresh take? Get an instant paraphrase of this document with our AI Paraphraser

Interpretation- In accordance with the above the evaluation it has been analysed that this
strategy is been counted as the best option as the profitability increases due to the increase in the
fixed cost and sales. In comparison with the previous assessment this approach generates higher
amount of profits after the reduction of the fixed cost amounting to 45000 in respect of
advertising equated to 103881.2 which clearly states that this strategy is a better option than
other one as it leads to increase in sales from 624000 to 878681.7 that in turn results to increase
in the revenue.
e. determining the assumptions of BEP Model and its uses within different businesses
Break even analysis refer to the volume of the production where the company’s total
sales is equal to its total costs that is this situation where the company is in no profit and no loss
situation. There are some assumptions which are required to be considered while calculating the
and arriving at the break-even point. these assumptions are explained as follows;
The first and foremost assumption of the break-even analysis is that it is possible to
differentiate the fixed cost and variable costs which is not practical in real life because there are
some costs which have elements of both variable and fixed cost which make difficult for the
company to calculate the break-even point (Islam and et.al., 2018).
Another assumption which is required to consider is that the fixed cost Will remain
constant irrespective of the output that is fixed cost does not change with the change in the
volume of the output and may not hold true result because once an output increases beyond a
certain level than it leads to increase the fixed cost as well.
Variable costs per unit will remain same and constant at all level of the production is
considered to be the another assumption of break-even analysis whereas the variable costs needs
to be decrease at the increase level of the production due to company;s ability to work with more
efficiency with rising level of the output.
5

Selling price will also remain constant is the another assumption on which break-even
analysis is based and it is not practical that selling price of all the units cannot be the same which
can also leads to the wrong calculation of the break-even point and not showing the accurate
position of the company .as every change in selling price of the products leads to change in the
break-even point as far as company is concerned.
Another assumption is there is no change in the given technology that is technology will
remain constant and production method, workers efficiency also remains constant which also
includes that there is no scope of the breaking down in production because of the unforeseen
situation and uncertainties like floods, earthquakes etc. there are no inventories or stock at the
start or end of the accounting period as inventory level are expected to remain same
from the above explantation it is cleared there are many assumptions which are used by
the company to arrive at break-even analysis and to ascertain the point at which they are making
no profit and no loss situation (Vasarhelyi, Kogan and Tuttle, 2015).
The company uses this method for many of the reasons as this tool helps in:
Determining the selling price which will give the company desired and expected profits.
It helps in fixation of the sales volume so that company can able to cover the given return
on capital employed.
It helps to company in forecasting the costs and profit as result of change in the volume
of the production.
It provides different suggestions for shifting in the sales mix.
This tool helps the company to make comparison from different firms in profitability.
It helps in determination of the costs and revenue at different level of the output.
It helps the company in making the decisions which will further help the in forecasting,
long-term planning and maintaining the profitability of the company.
It leads to reveal the business strength and profit earning capacity of concern without
many efforts and difficult.
PART C
A. Net Present Value, Average Rate of Return, Payback Period
Net present value
6
⊘ This is a preview!⊘
Do you want full access?
Subscribe today to unlock all pages.

Trusted by 1+ million students worldwide

Interpretation- From the above table it has been assessed that the net present value is
been evaluated as 7027023.72 which reflects a positive value which in turn means that selecting
this project for the company will be profitable.
Average rate of return
7
been evaluated as 7027023.72 which reflects a positive value which in turn means that selecting
this project for the company will be profitable.
Average rate of return
7
Paraphrase This Document
Need a fresh take? Get an instant paraphrase of this document with our AI Paraphraser

Interpretation- The above analysis shows that the project will be generating profits
equated to the accounting rate of return computed as 20.44%. This rate defines the return that
will be gained by the Sanskrust Ltd and it is said to be good rate of return so an organization
must go for this proposal.
8
equated to the accounting rate of return computed as 20.44%. This rate defines the return that
will be gained by the Sanskrust Ltd and it is said to be good rate of return so an organization
must go for this proposal.
8

Payback period
Interpretation- The above table shows that the time period taken by the project in
recovering the amount of initial investment for the company resulted as 3.8 years. It has been
stated that shorter the payback period more viable is the project so as supported by the evaluation
this proposal is taking less time in recovering the initial cost of the investment of Sanskrust Ltd
so it should selecting this project will be feasible for the an entity(Easton and Sommers, 2018).
B. Investment Appraisal Techniques and Its Benefits and Limitations
Investment Appraisal, also called as capital budgeting which is a planning procedure
which allows the purpose of the company’s investments, both long term and short term to fulfil.
However, the additives of the firm that come underneath this form of capital funding appraisal
encompass belongings, equipment, R & D plan, advertising cause, new plant life, new equipment
and so on. As a consequence in easy words, capital funding appraisal is the programme of
leading capital and investment of the expenditure of company (Hoyle, Schaefer and Doupnik,
2018). As an example, capital funding appraisal in small businesses comes to a decision on
future projects into newer markets as well as enlargement and inclusion of recent activities.
Further, there four major investment appraisal method namely; Payback technique,
ARR(Accounting rate of return), NPV(Net present value), IRR(Internal rate of return).
9
⊘ This is a preview!⊘
Do you want full access?
Subscribe today to unlock all pages.

Trusted by 1+ million students worldwide
1 out of 16