Detailed Statistical Analysis Report: Australian Sales Data 2002
VerifiedAdded on 2020/09/17
|20
|3025
|29
Report
AI Summary
This report presents a statistical analysis of Australian sales data, focusing on identifying sales trends and patterns. The study utilizes descriptive statistics, frequency tables, and charts to visualize the data. Furthermore, the analysis incorporates regression analysis, ANOVA, and t-tests to examine relationships between variables such as order priority, customer segments, shipping costs, and sales. Key findings indicate that changes in the number of units sold do not significantly impact overall sales, and the West side of Australia generates higher sales. The report concludes that statistical tools are crucial for business decision-making, emphasizing the importance of selling a high volume of units. Limitations include a small sample size and the absence of advanced visualization techniques. The report provides insights into sales trends and customer behavior, offering valuable information for businesses operating in the Australian market. The report also includes an executive summary, table of contents, introduction, task breakdown, conclusion, references, and an appendix with raw data and calculations.
STATISTICAL ANALYSES
Paraphrase This Document
Need a fresh take? Get an instant paraphrase of this document with our AI Paraphraser

EXECUTIVE SUMMARY
In present research study multiple tools are applied on dataset and it is identified that change in
number of units sold is not bringing any big variation in entire sales amount. It is also identified
that West side is generating higher amount of sales for firms then East side. Thus, focus must be
customers that live in West side of the nation. Sales value is deviating at fast rate which reflect
that sales through transactions very at different level on varied order ID. Finally, it can be
said that sales through different sort of customers is almost equal . thus, attention equally need
to be given on all sort of customers.
⊘ This is a preview!⊘
Do you want full access?
Subscribe today to unlock all pages.
Trusted by 1+ million students worldwide
TABLE OF CONTENTS
INTRODUCTION...........................................................................................................................1
TASK 1............................................................................................................................................1
Preparing sample of 60 days from 2002 data..............................................................................1
TASK 2............................................................................................................................................1
Task 3...............................................................................................................................................5
Calculation of confidence interval...............................................................................................5
TASK 4............................................................................................................................................5
(1)Independent sample t test........................................................................................................5
(2) One way ANOVA..................................................................................................................6
TASK 5............................................................................................................................................6
Coorelation and regression..........................................................................................................6
CONCLUSION................................................................................................................................7
REFERENCE..................................................................................................................................9
APPENDIX....................................................................................................................................10
Summary statistics.........................................................................................................................10
Table 1CI calculation.....................................................................................................................11
Figure 1Freuqnecy distribution for order priority...........................................................................2
Figure 2Frequeny distribution for sort of customers.......................................................................2
Figure 3Frequency distribution for region.......................................................................................3
Figure 4Shipping mode distribution................................................................................................3
Figure 5Shiping cost chart...............................................................................................................5
Paraphrase This Document
Need a fresh take? Get an instant paraphrase of this document with our AI Paraphraser
INTRODUCTION
Statistics is the one of the domain that have due significence for the business firms. In
the present research study Australia sales data is analyzed in proper manner. Major purpose of
carrying out research study is to find out areas where most of sales are made and trends that exist
in respect to sales and product categories as well as different sort of customers. In this regard
descriptive statistics is computed and frequency tables are prepared and same are analyzed
through charts. Apart from this, in the report detail discussion is carried out on variables that are
in dataset by considering results obtained on regression analysis and ANOVA as well as t test.
Thus, it can be said that detailed analysis of variables is done in the present research study and it
is expected that reader will obtain detailed information about sales trends that exist in Australia
market.
TASK 1
Preparing sample of 60 days from 2002 data
According to requirement data is sorted and sample of 60 transactions is taken in to
account.
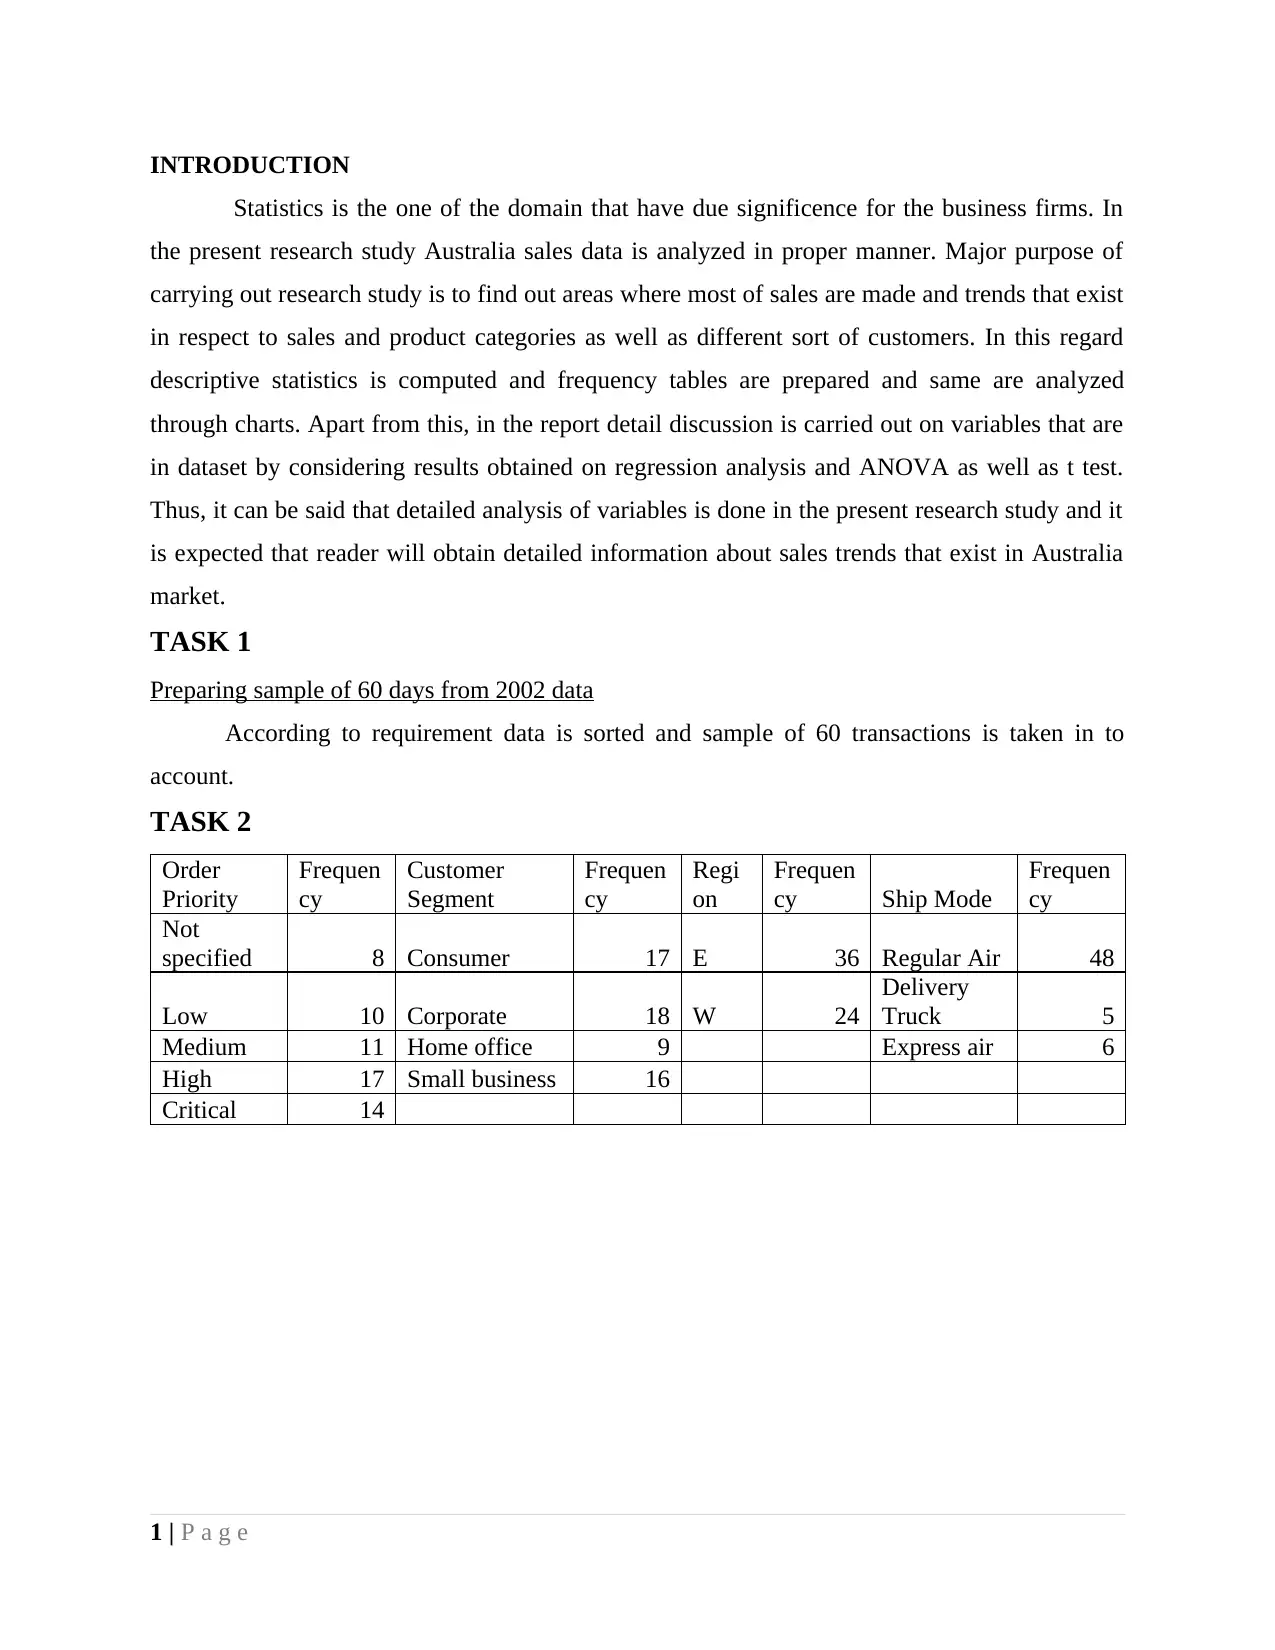
TASK 2
Order
Priority
Frequen
cy
Customer
Segment
Frequen
cy
Regi
on
Frequen
cy Ship Mode
Frequen
cy
Not
specified 8 Consumer 17 E 36 Regular Air 48
Low 10 Corporate 18 W 24
Delivery
Truck 5
Medium 11 Home office 9 Express air 6
High 17 Small business 16
Critical 14
1 | P a g e
Statistics is the one of the domain that have due significence for the business firms. In
the present research study Australia sales data is analyzed in proper manner. Major purpose of
carrying out research study is to find out areas where most of sales are made and trends that exist
in respect to sales and product categories as well as different sort of customers. In this regard
descriptive statistics is computed and frequency tables are prepared and same are analyzed
through charts. Apart from this, in the report detail discussion is carried out on variables that are
in dataset by considering results obtained on regression analysis and ANOVA as well as t test.
Thus, it can be said that detailed analysis of variables is done in the present research study and it
is expected that reader will obtain detailed information about sales trends that exist in Australia
market.
TASK 1
Preparing sample of 60 days from 2002 data
According to requirement data is sorted and sample of 60 transactions is taken in to
account.
TASK 2
Order
Priority
Frequen
cy
Customer
Segment
Frequen
cy
Regi
on
Frequen
cy Ship Mode
Frequen
cy
Not
specified 8 Consumer 17 E 36 Regular Air 48
Low 10 Corporate 18 W 24
Delivery
Truck 5
Medium 11 Home office 9 Express air 6
High 17 Small business 16
Critical 14
1 | P a g e
8
10
11
17
14
Frequency
Not specified Low Medium High Critical
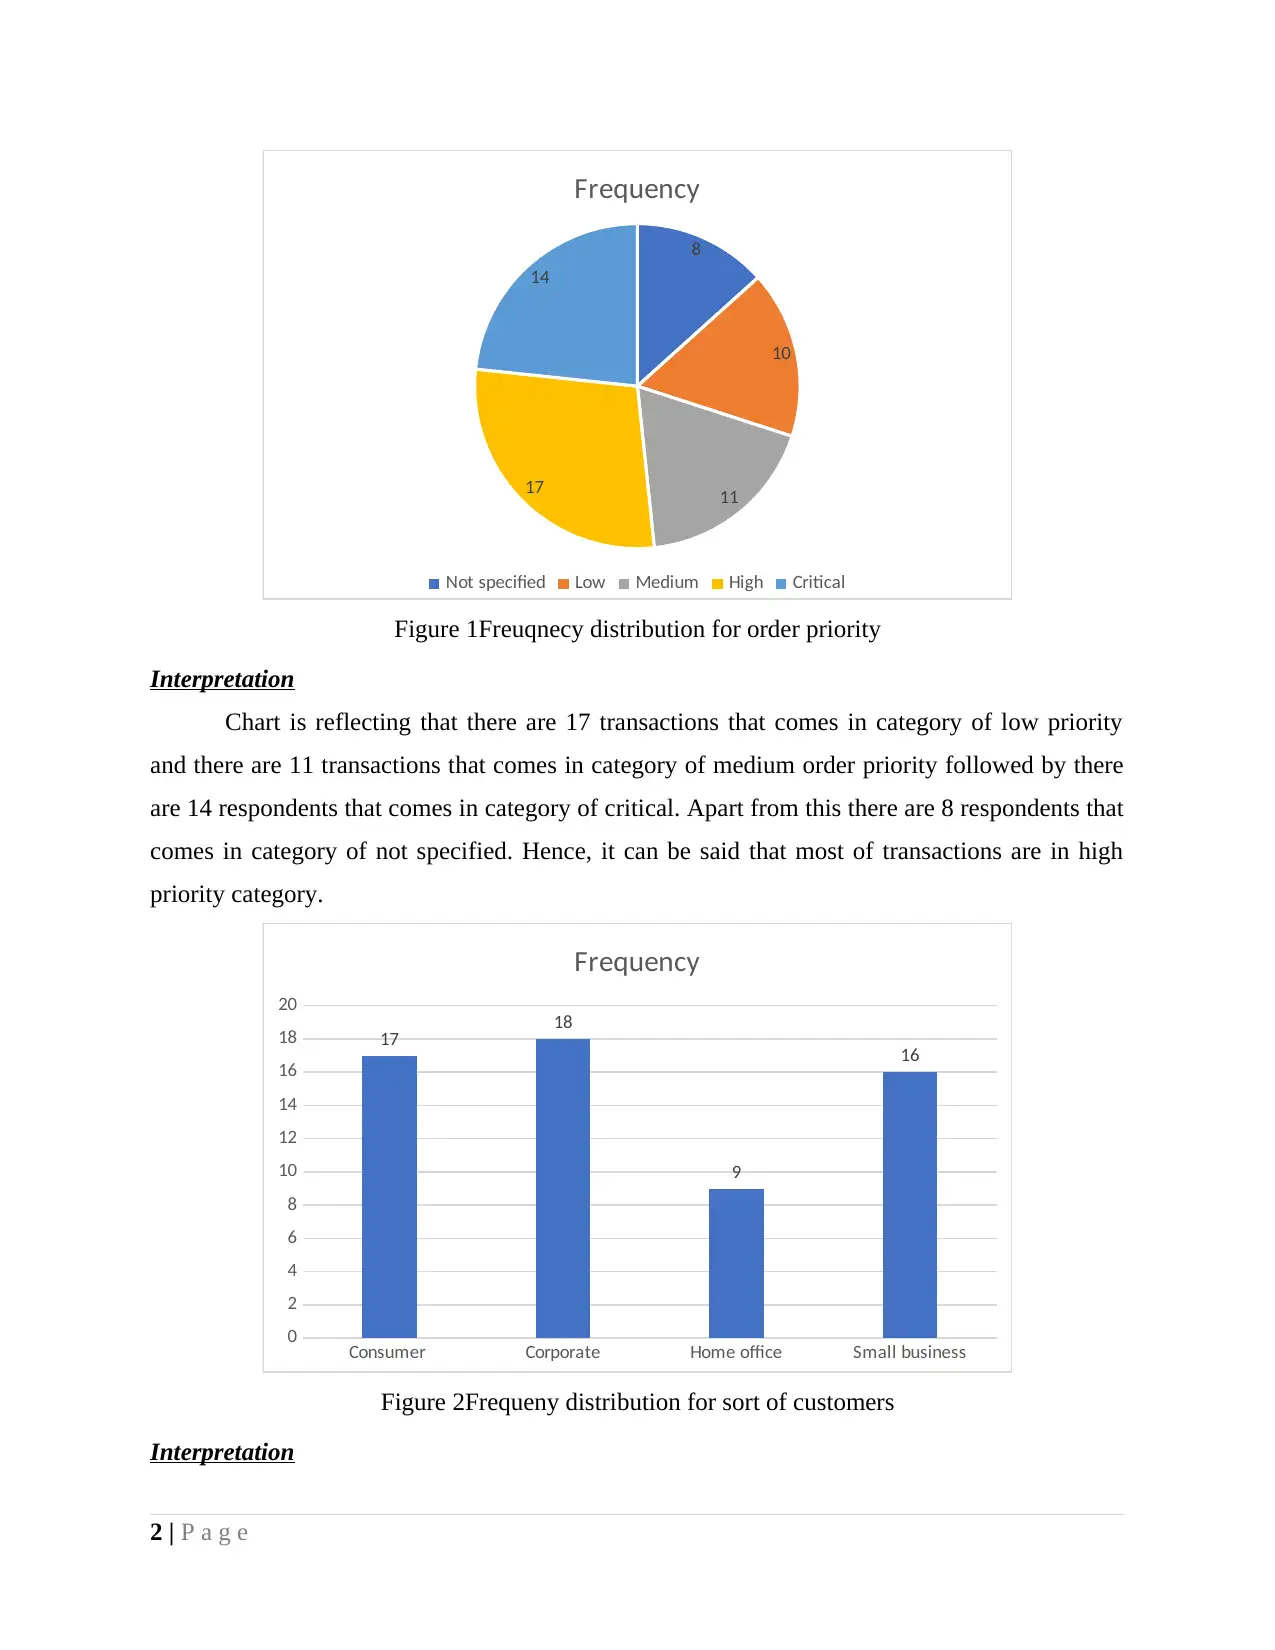
Figure 1Freuqnecy distribution for order priority
Interpretation
Chart is reflecting that there are 17 transactions that comes in category of low priority
and there are 11 transactions that comes in category of medium order priority followed by there
are 14 respondents that comes in category of critical. Apart from this there are 8 respondents that
comes in category of not specified. Hence, it can be said that most of transactions are in high
priority category.
Consumer Corporate Home office Small business
0
2
4
6
8
10
12
14
16
18
20
17 18
9
16
Frequency
Figure 2Frequeny distribution for sort of customers
Interpretation
2 | P a g e
10
11
17
14
Frequency
Not specified Low Medium High Critical
Figure 1Freuqnecy distribution for order priority
Interpretation
Chart is reflecting that there are 17 transactions that comes in category of low priority
and there are 11 transactions that comes in category of medium order priority followed by there
are 14 respondents that comes in category of critical. Apart from this there are 8 respondents that
comes in category of not specified. Hence, it can be said that most of transactions are in high
priority category.
Consumer Corporate Home office Small business
0
2
4
6
8
10
12
14
16
18
20
17 18
9
16
Frequency
Figure 2Frequeny distribution for sort of customers
Interpretation
2 | P a g e
⊘ This is a preview!⊘
Do you want full access?
Subscribe today to unlock all pages.
Trusted by 1+ million students worldwide
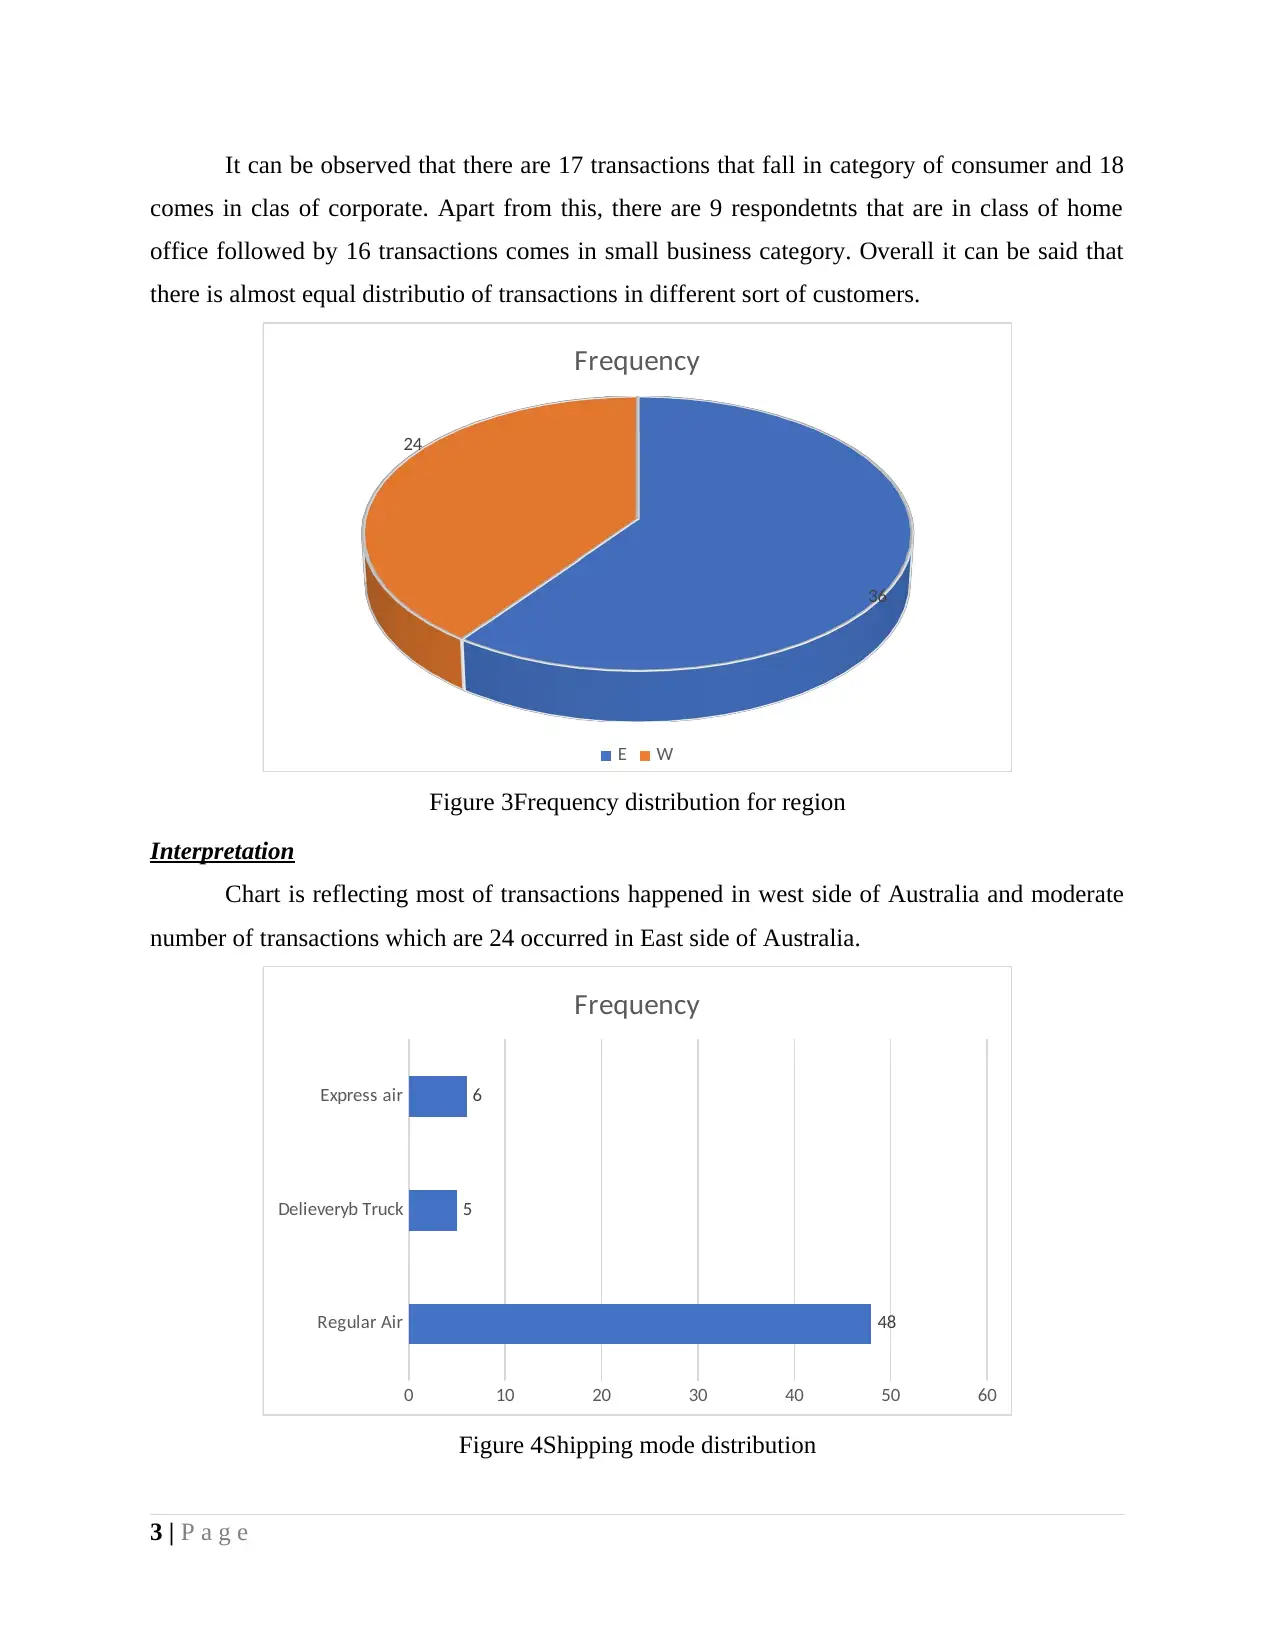
It can be observed that there are 17 transactions that fall in category of consumer and 18
comes in clas of corporate. Apart from this, there are 9 respondetnts that are in class of home
office followed by 16 transactions comes in small business category. Overall it can be said that
there is almost equal distributio of transactions in different sort of customers.
36
24
Frequency
E W
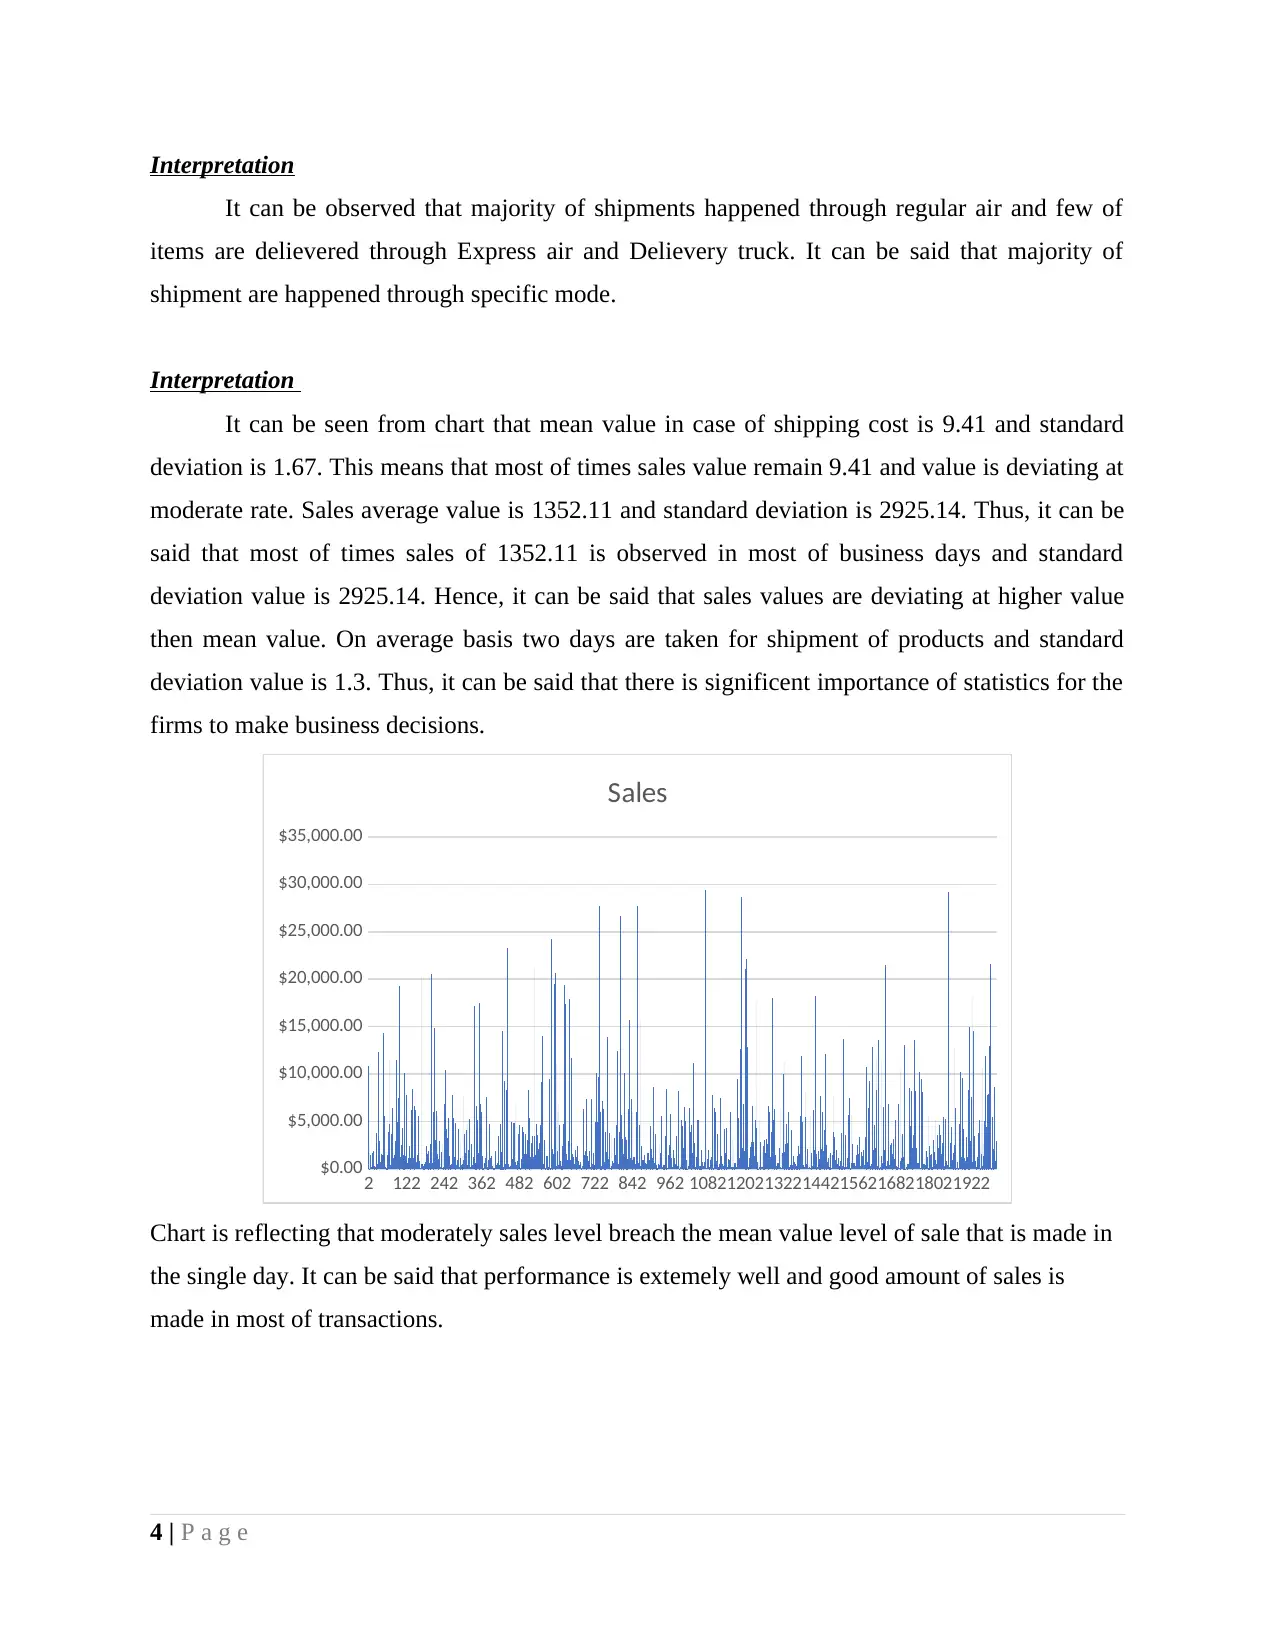
Figure 3Frequency distribution for region
Interpretation
Chart is reflecting most of transactions happened in west side of Australia and moderate
number of transactions which are 24 occurred in East side of Australia.
Regular Air
Delieveryb Truck
Express air
0 10 20 30 40 50 60
48
5
6
Frequency
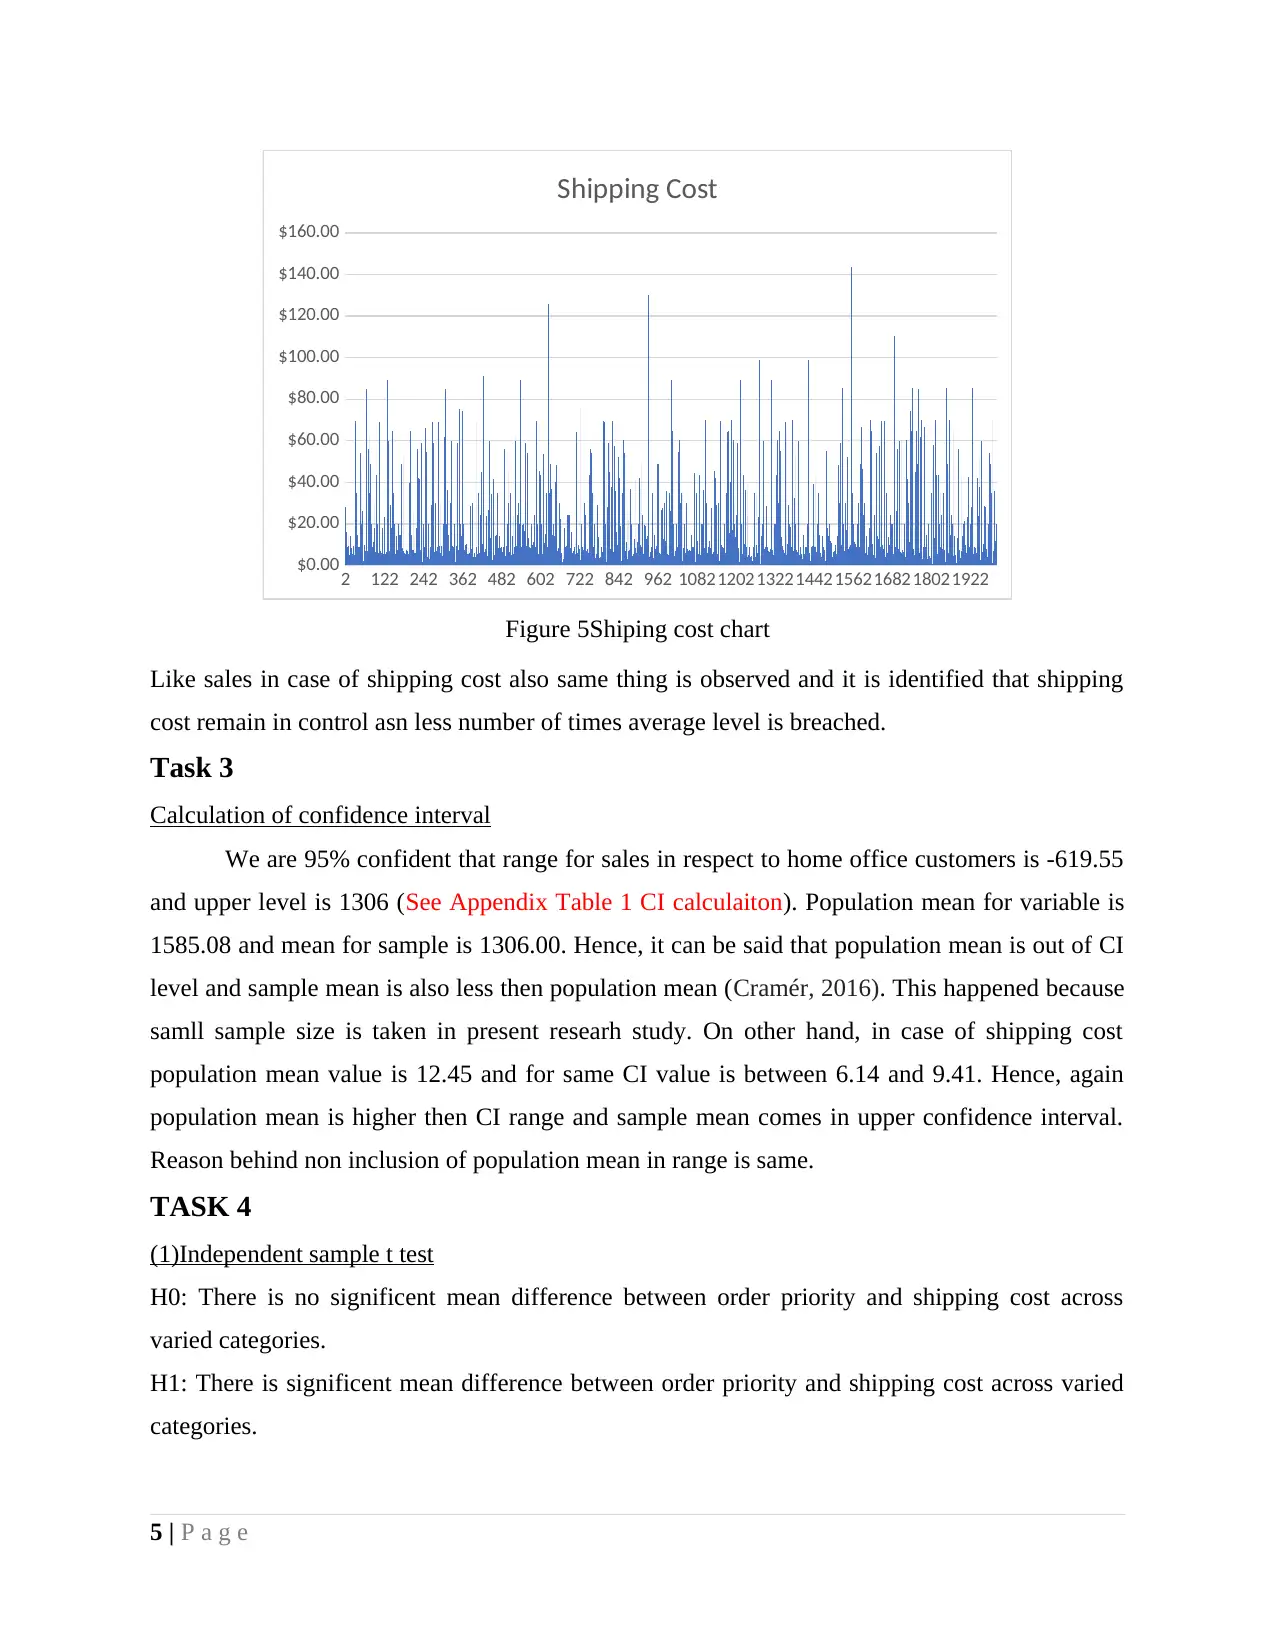
Figure 4Shipping mode distribution
3 | P a g e
comes in clas of corporate. Apart from this, there are 9 respondetnts that are in class of home
office followed by 16 transactions comes in small business category. Overall it can be said that
there is almost equal distributio of transactions in different sort of customers.
36
24
Frequency
E W
Figure 3Frequency distribution for region
Interpretation
Chart is reflecting most of transactions happened in west side of Australia and moderate
number of transactions which are 24 occurred in East side of Australia.
Regular Air
Delieveryb Truck
Express air
0 10 20 30 40 50 60
48
5
6
Frequency
Figure 4Shipping mode distribution
3 | P a g e
Paraphrase This Document
Need a fresh take? Get an instant paraphrase of this document with our AI Paraphraser
Interpretation
It can be observed that majority of shipments happened through regular air and few of
items are delievered through Express air and Delievery truck. It can be said that majority of
shipment are happened through specific mode.
Interpretation
It can be seen from chart that mean value in case of shipping cost is 9.41 and standard
deviation is 1.67. This means that most of times sales value remain 9.41 and value is deviating at
moderate rate. Sales average value is 1352.11 and standard deviation is 2925.14. Thus, it can be
said that most of times sales of 1352.11 is observed in most of business days and standard
deviation value is 2925.14. Hence, it can be said that sales values are deviating at higher value
then mean value. On average basis two days are taken for shipment of products and standard
deviation value is 1.3. Thus, it can be said that there is significent importance of statistics for the
firms to make business decisions.
2 122 242 362 482 602 722 842 962 10821202132214421562168218021922
$0.00
$5,000.00
$10,000.00
$15,000.00
$20,000.00
$25,000.00
$30,000.00
$35,000.00
Sales
Chart is reflecting that moderately sales level breach the mean value level of sale that is made in
the single day. It can be said that performance is extemely well and good amount of sales is
made in most of transactions.
4 | P a g e
2 122 242 362 482 602 722 842 962 10821202132214421562168218021922
$0.00
$20.00
$40.00
$60.00
$80.00
$100.00
$120.00
$140.00
$160.00
Shipping Cost
Figure 5Shiping cost chart
Like sales in case of shipping cost also same thing is observed and it is identified that shipping
cost remain in control asn less number of times average level is breached.
Task 3
Calculation of confidence interval
We are 95% confident that range for sales in respect to home office customers is -619.55
and upper level is 1306 (See Appendix Table 1 CI calculaiton). Population mean for variable is
1585.08 and mean for sample is 1306.00. Hence, it can be said that population mean is out of CI
level and sample mean is also less then population mean (Cramér, 2016). This happened because
samll sample size is taken in present researh study. On other hand, in case of shipping cost
population mean value is 12.45 and for same CI value is between 6.14 and 9.41. Hence, again
population mean is higher then CI range and sample mean comes in upper confidence interval.
Reason behind non inclusion of population mean in range is same.
TASK 4
(1)Independent sample t test
H0: There is no significent mean difference between order priority and shipping cost across
varied categories.
H1: There is significent mean difference between order priority and shipping cost across varied
categories.
5 | P a g e
⊘ This is a preview!⊘
Do you want full access?
Subscribe today to unlock all pages.
Trusted by 1+ million students worldwide
Interpretation
On analysis of facts it can be said that there is no significent mean difference between
order priority and shipping cost (See Appendix Table 2 calculation). Hence, with change in order
priority category which is critical or any other no big change comes in shipping cost.
(2) One way ANOVA
H0: There is no significent mean difference between sales across different regions.
H1: There is significent mean difference between sales across different regions.
Interpretation
ANOVA results clearly reflect that value of level of significene is 0.00<0.05 and this is
indicating that across different regions sales level is significently different (See ANOVA table in
appendix). On average basis sales is made on West regions and variance of only 0.24 is observed
which means that region is deviating at low rate. Average sales value is 1352.11 and variance is
8556450. Thus, sales value is deviating at high rate.
TASK 5
Coorelation and regression
H0: There is no significent mean difference between sales and order quantity.
H1: There is significent mean difference between sales and order quantity.
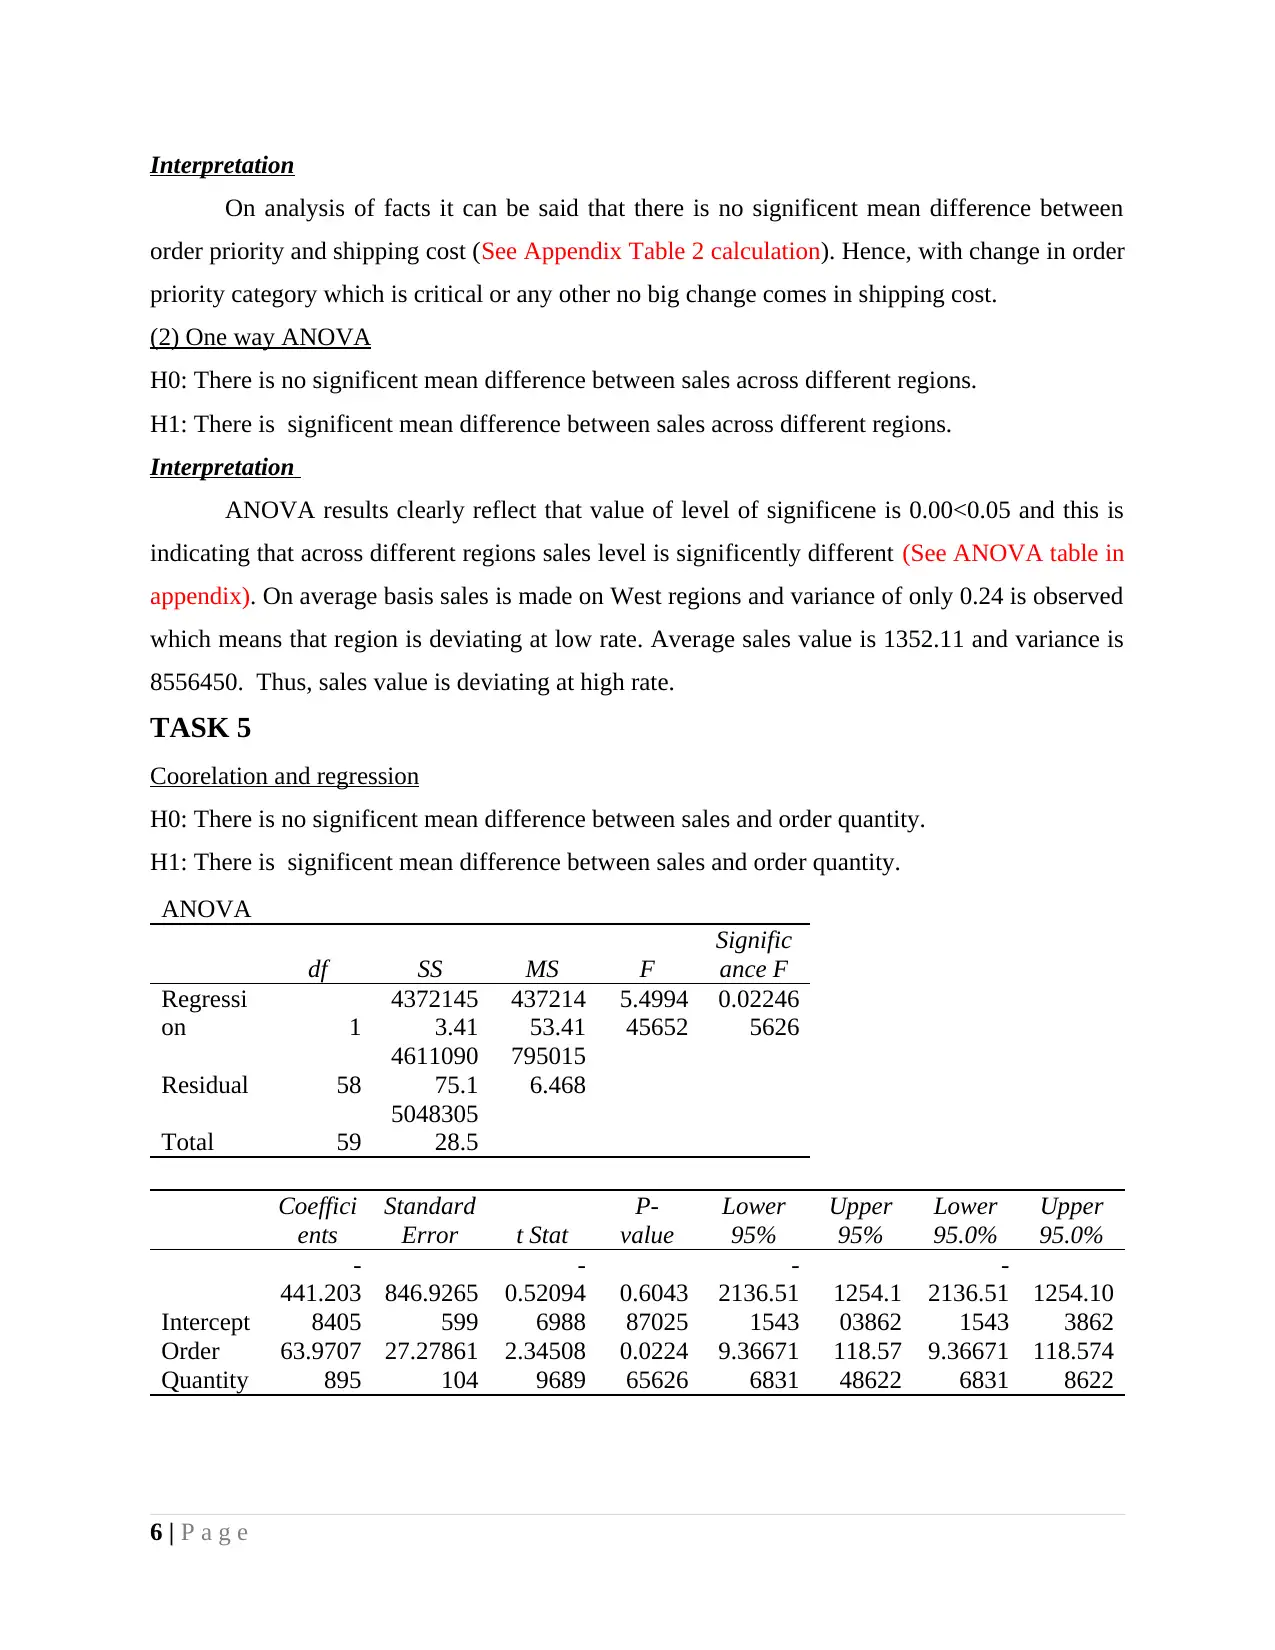
ANOVA
df SS MS F
Signific
ance F
Regressi
on 1
4372145
3.41
437214
53.41
5.4994
45652
0.02246
5626
Residual 58
4611090
75.1
795015
6.468
Total 59
5048305
28.5
Coeffici
ents
Standard
Error t Stat
P-
value
Lower
95%
Upper
95%
Lower
95.0%
Upper
95.0%
Intercept
-
441.203
8405
846.9265
599
-
0.52094
6988
0.6043
87025
-
2136.51
1543
1254.1
03862
-
2136.51
1543
1254.10
3862
Order
Quantity
63.9707
895
27.27861
104
2.34508
9689
0.0224
65626
9.36671
6831
118.57
48622
9.36671
6831
118.574
8622
6 | P a g e
On analysis of facts it can be said that there is no significent mean difference between
order priority and shipping cost (See Appendix Table 2 calculation). Hence, with change in order
priority category which is critical or any other no big change comes in shipping cost.
(2) One way ANOVA
H0: There is no significent mean difference between sales across different regions.
H1: There is significent mean difference between sales across different regions.
Interpretation
ANOVA results clearly reflect that value of level of significene is 0.00<0.05 and this is
indicating that across different regions sales level is significently different (See ANOVA table in
appendix). On average basis sales is made on West regions and variance of only 0.24 is observed
which means that region is deviating at low rate. Average sales value is 1352.11 and variance is
8556450. Thus, sales value is deviating at high rate.
TASK 5
Coorelation and regression
H0: There is no significent mean difference between sales and order quantity.
H1: There is significent mean difference between sales and order quantity.
ANOVA
df SS MS F
Signific
ance F
Regressi
on 1
4372145
3.41
437214
53.41
5.4994
45652
0.02246
5626
Residual 58
4611090
75.1
795015
6.468
Total 59
5048305
28.5
Coeffici
ents
Standard
Error t Stat
P-
value
Lower
95%
Upper
95%
Lower
95.0%
Upper
95.0%
Intercept
-
441.203
8405
846.9265
599
-
0.52094
6988
0.6043
87025
-
2136.51
1543
1254.1
03862
-
2136.51
1543
1254.10
3862
Order
Quantity
63.9707
895
27.27861
104
2.34508
9689
0.0224
65626
9.36671
6831
118.57
48622
9.36671
6831
118.574
8622
6 | P a g e
Paraphrase This Document
Need a fresh take? Get an instant paraphrase of this document with our AI Paraphraser
0 10 20 30 40 50 60-$5,000.00
$0.00
$5,000.00
$10,000.00
$15,000.00
$20,000.00
Order Quantity Line Fit Plot
Sales
Predicted Sales
Order Quantity
Sales
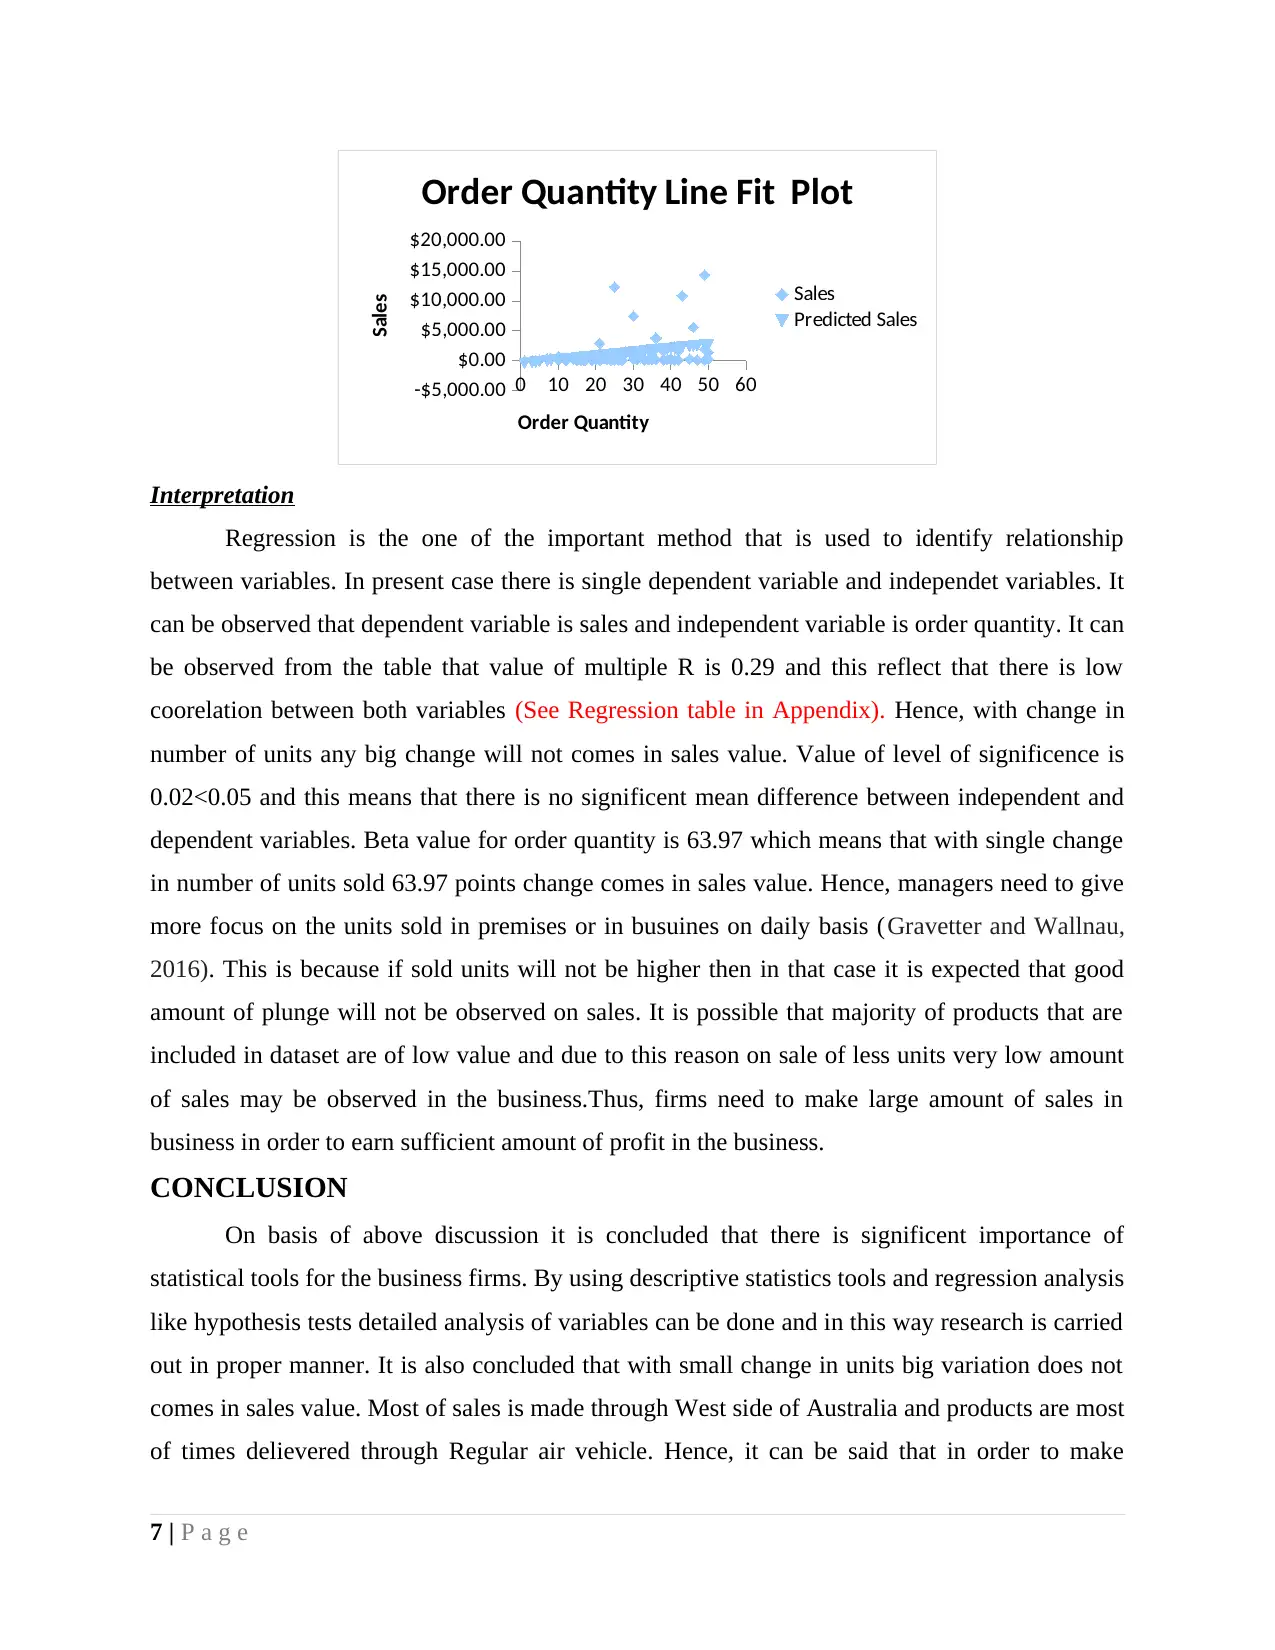
Interpretation
Regression is the one of the important method that is used to identify relationship
between variables. In present case there is single dependent variable and independet variables. It
can be observed that dependent variable is sales and independent variable is order quantity. It can
be observed from the table that value of multiple R is 0.29 and this reflect that there is low
coorelation between both variables (See Regression table in Appendix). Hence, with change in
number of units any big change will not comes in sales value. Value of level of significence is
0.02<0.05 and this means that there is no significent mean difference between independent and
dependent variables. Beta value for order quantity is 63.97 which means that with single change
in number of units sold 63.97 points change comes in sales value. Hence, managers need to give
more focus on the units sold in premises or in busuines on daily basis (Gravetter and Wallnau,
2016). This is because if sold units will not be higher then in that case it is expected that good
amount of plunge will not be observed on sales. It is possible that majority of products that are
included in dataset are of low value and due to this reason on sale of less units very low amount
of sales may be observed in the business.Thus, firms need to make large amount of sales in
business in order to earn sufficient amount of profit in the business.
CONCLUSION
On basis of above discussion it is concluded that there is significent importance of
statistical tools for the business firms. By using descriptive statistics tools and regression analysis
like hypothesis tests detailed analysis of variables can be done and in this way research is carried
out in proper manner. It is also concluded that with small change in units big variation does not
comes in sales value. Most of sales is made through West side of Australia and products are most
of times delievered through Regular air vehicle. Hence, it can be said that in order to make
7 | P a g e
$0.00
$5,000.00
$10,000.00
$15,000.00
$20,000.00
Order Quantity Line Fit Plot
Sales
Predicted Sales
Order Quantity
Sales
Interpretation
Regression is the one of the important method that is used to identify relationship
between variables. In present case there is single dependent variable and independet variables. It
can be observed that dependent variable is sales and independent variable is order quantity. It can
be observed from the table that value of multiple R is 0.29 and this reflect that there is low
coorelation between both variables (See Regression table in Appendix). Hence, with change in
number of units any big change will not comes in sales value. Value of level of significence is
0.02<0.05 and this means that there is no significent mean difference between independent and
dependent variables. Beta value for order quantity is 63.97 which means that with single change
in number of units sold 63.97 points change comes in sales value. Hence, managers need to give
more focus on the units sold in premises or in busuines on daily basis (Gravetter and Wallnau,
2016). This is because if sold units will not be higher then in that case it is expected that good
amount of plunge will not be observed on sales. It is possible that majority of products that are
included in dataset are of low value and due to this reason on sale of less units very low amount
of sales may be observed in the business.Thus, firms need to make large amount of sales in
business in order to earn sufficient amount of profit in the business.
CONCLUSION
On basis of above discussion it is concluded that there is significent importance of
statistical tools for the business firms. By using descriptive statistics tools and regression analysis
like hypothesis tests detailed analysis of variables can be done and in this way research is carried
out in proper manner. It is also concluded that with small change in units big variation does not
comes in sales value. Most of sales is made through West side of Australia and products are most
of times delievered through Regular air vehicle. Hence, it can be said that in order to make
7 | P a g e

higher sales large number of units need to be sold in the market. Major limitation of analysis is
that extensive or more deep analysis of research study is not done as by using techniques related
to visualization in depth lots of facts can be identified. Small sample size was taken in the
present research study and it is also major limitation and in future large sample size need to be
taken to avoid such kind of problems.
8 | P a g e
⊘ This is a preview!⊘
Do you want full access?
Subscribe today to unlock all pages.
Trusted by 1+ million students worldwide
1 out of 20
Related Documents


Your All-in-One AI-Powered Toolkit for Academic Success.
+13062052269
info@desklib.com
Available 24*7 on WhatsApp / Email
![[object Object]](/_next/static/media/star-bottom.7253800d.svg)
Unlock your academic potential
Copyright © 2020–2026 A2Z Services. All Rights Reserved. Developed and managed by ZUCOL.