Statistical Analysis Project Part B for MAT10251 - SCU

Verified

Added on  2021/06/14

|7
|926
|99
Project
AI Summary
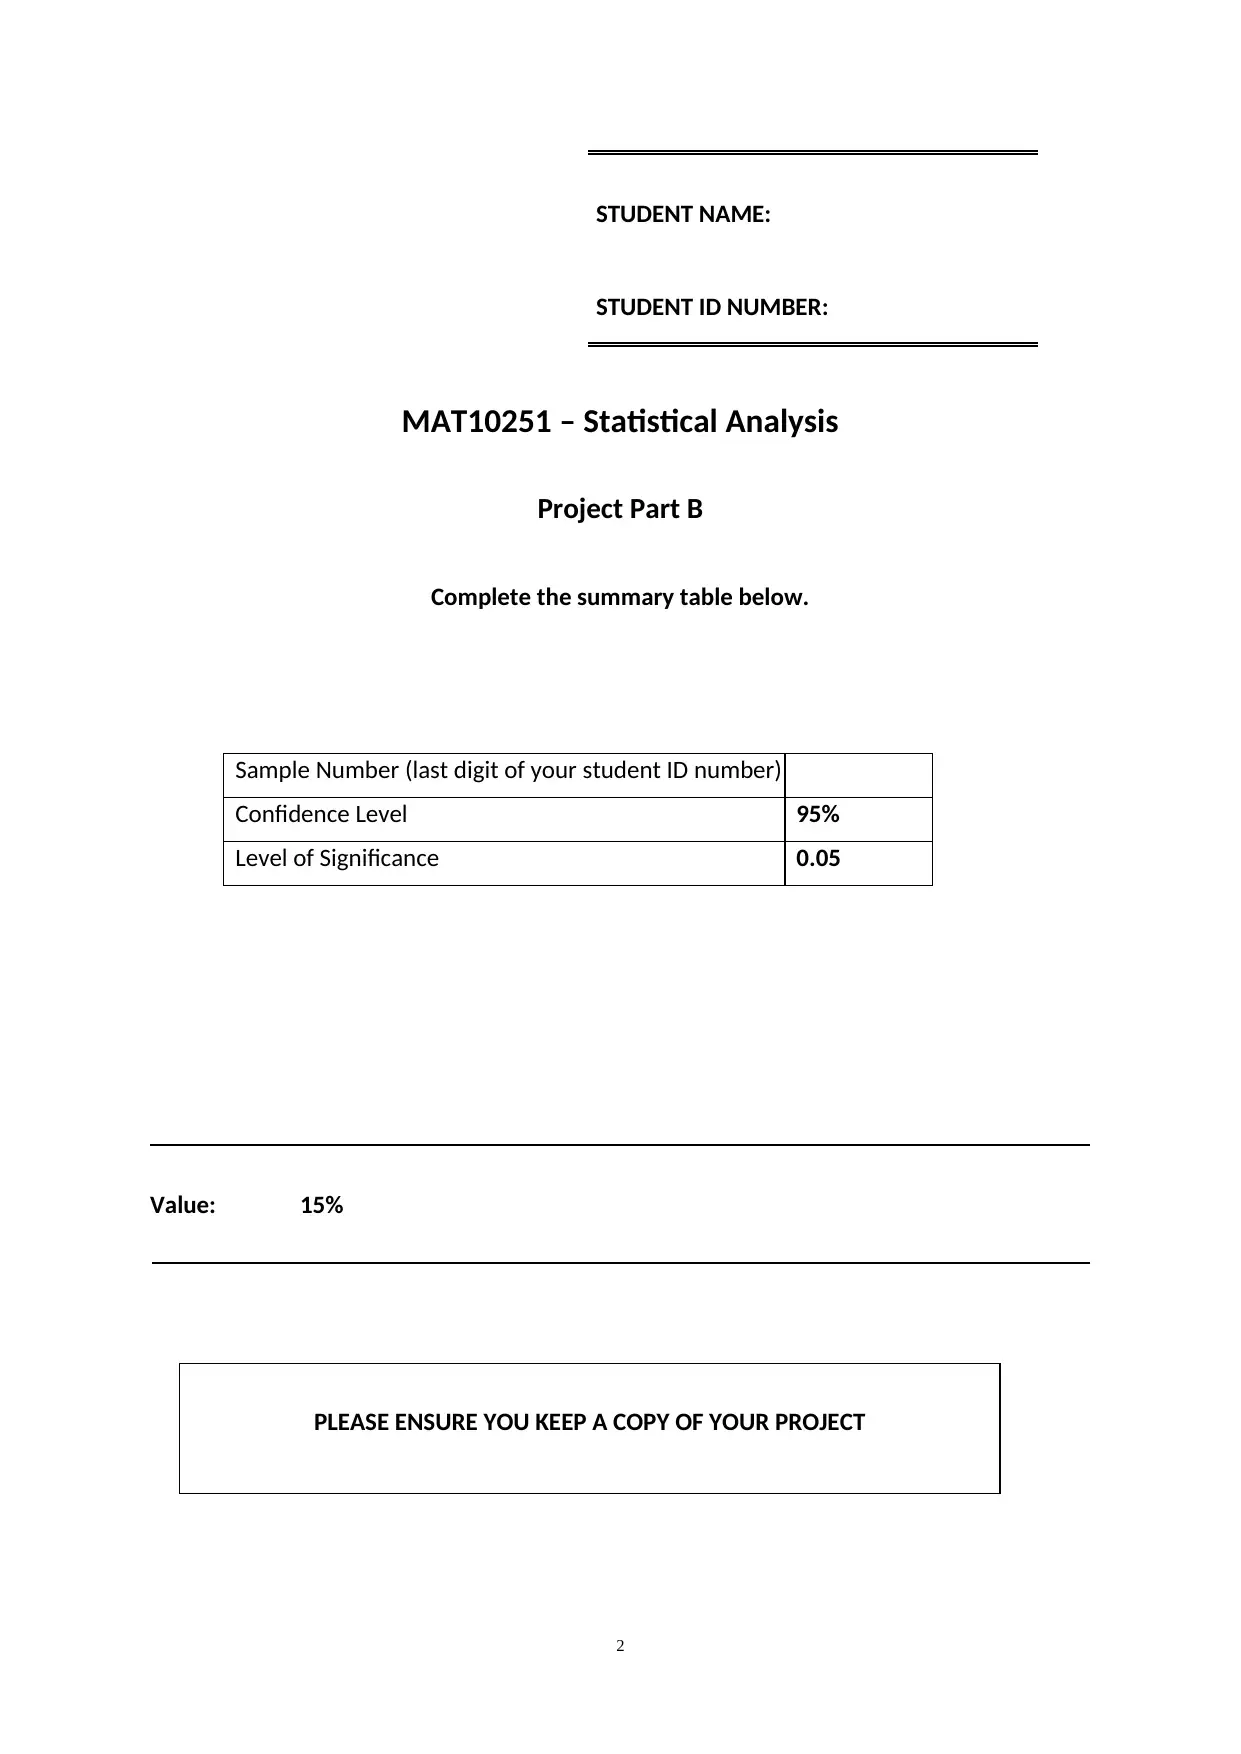
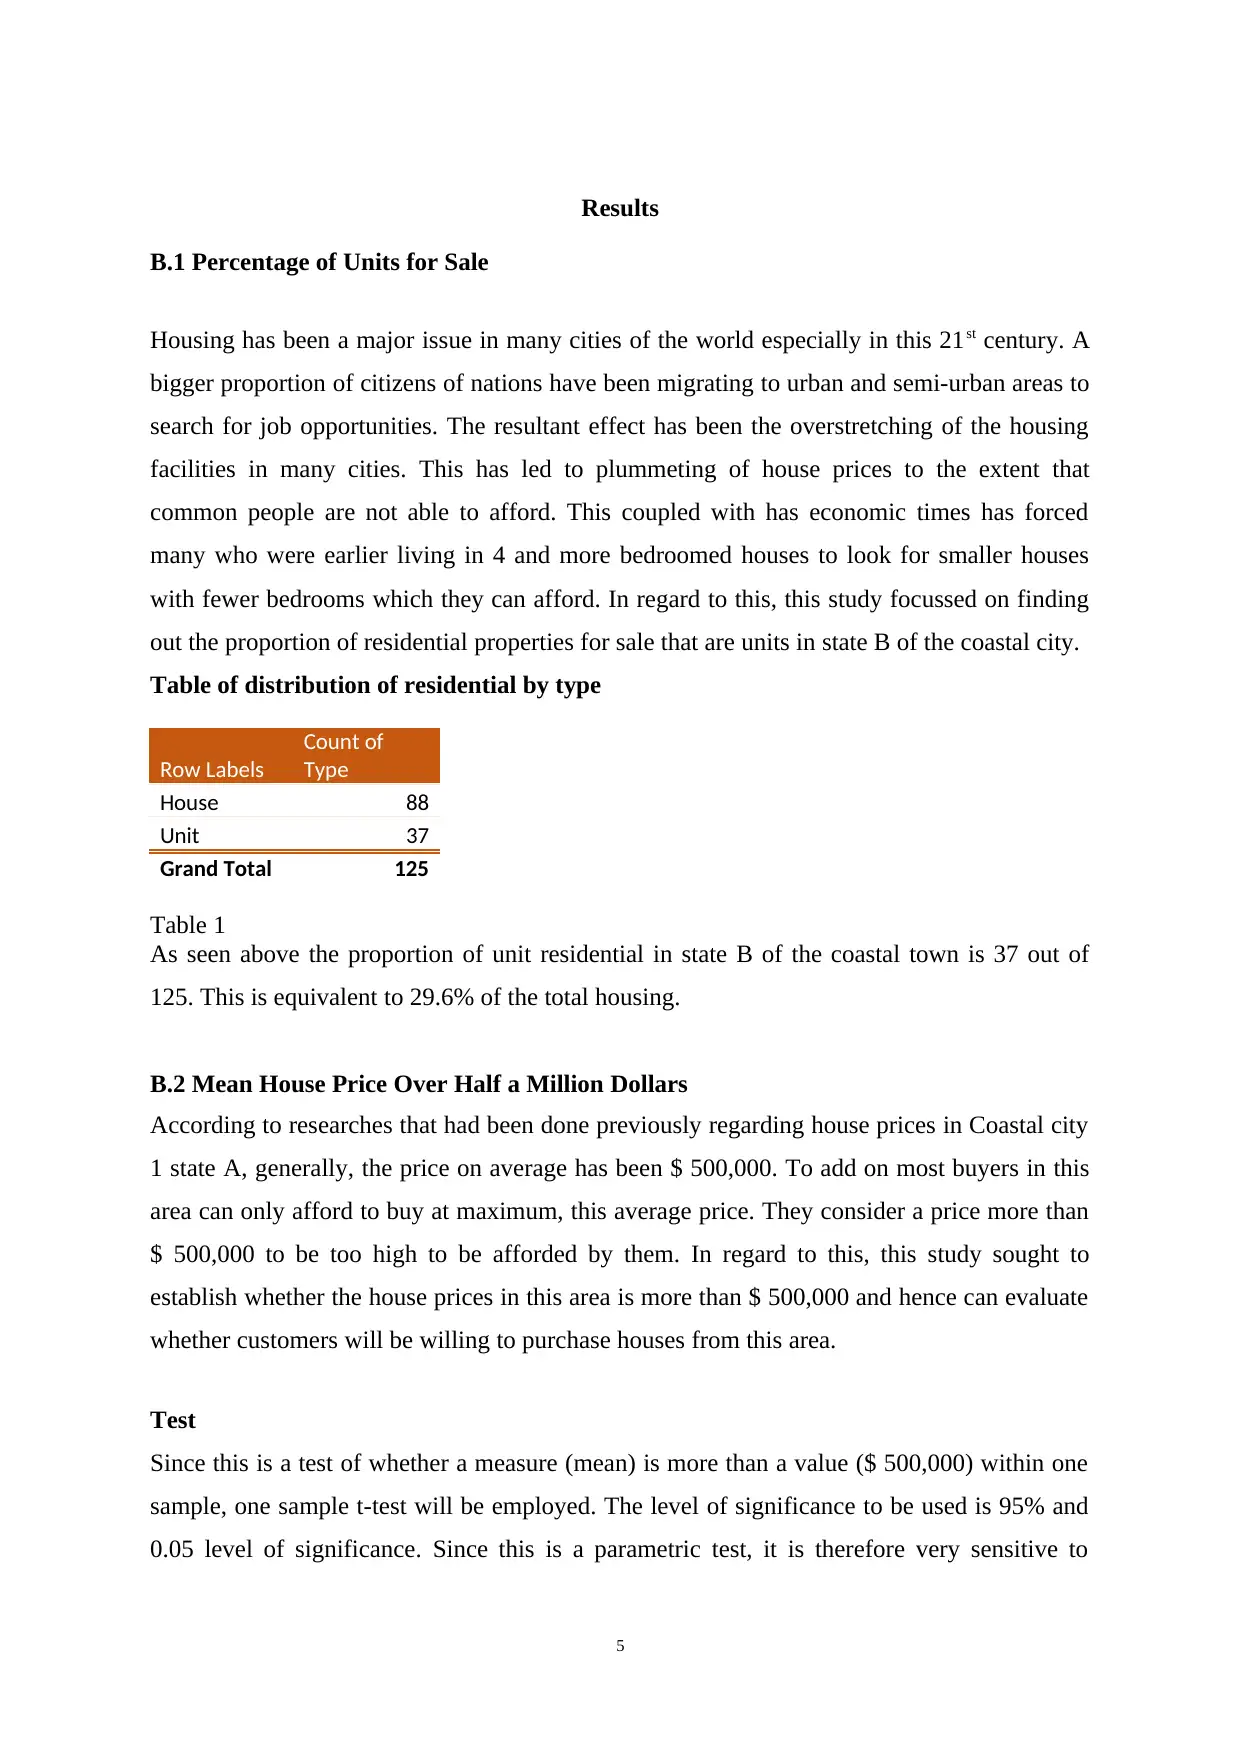
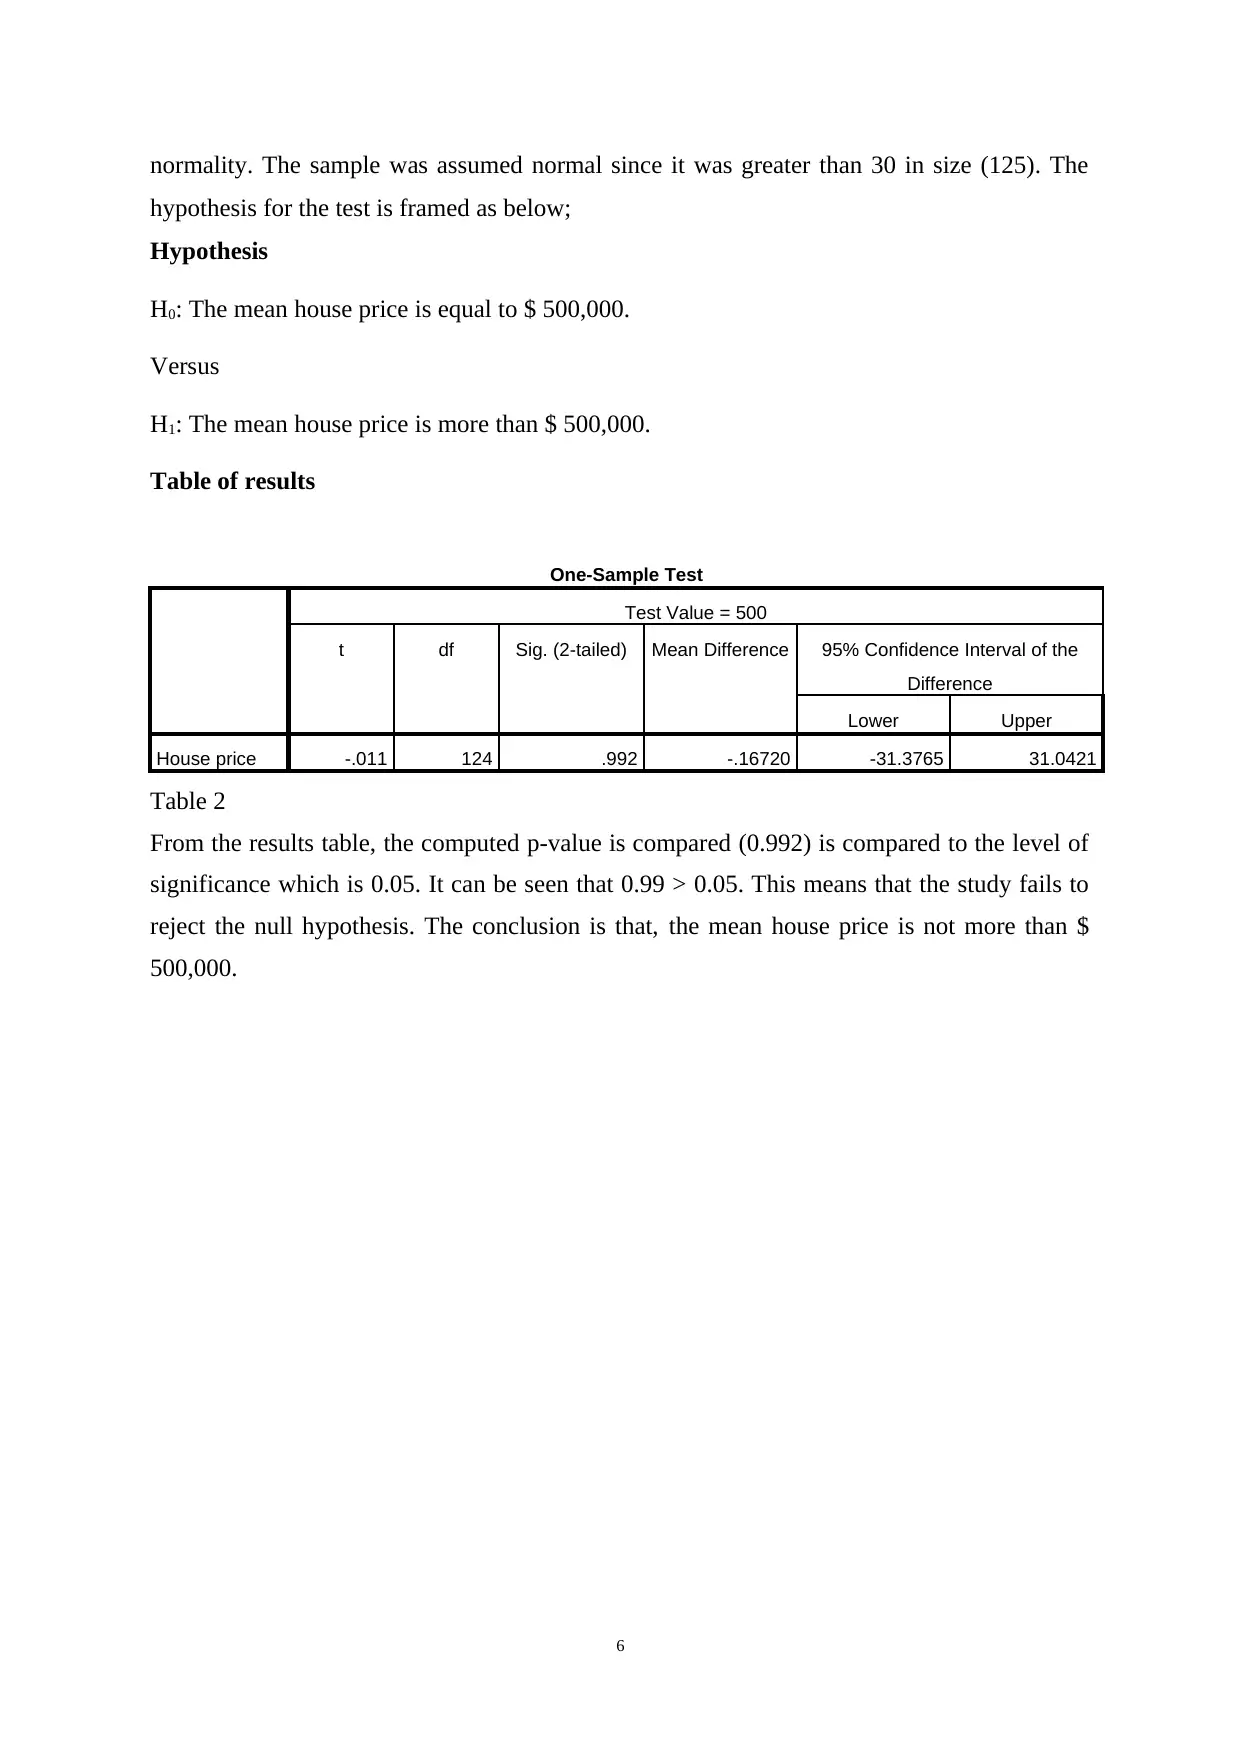
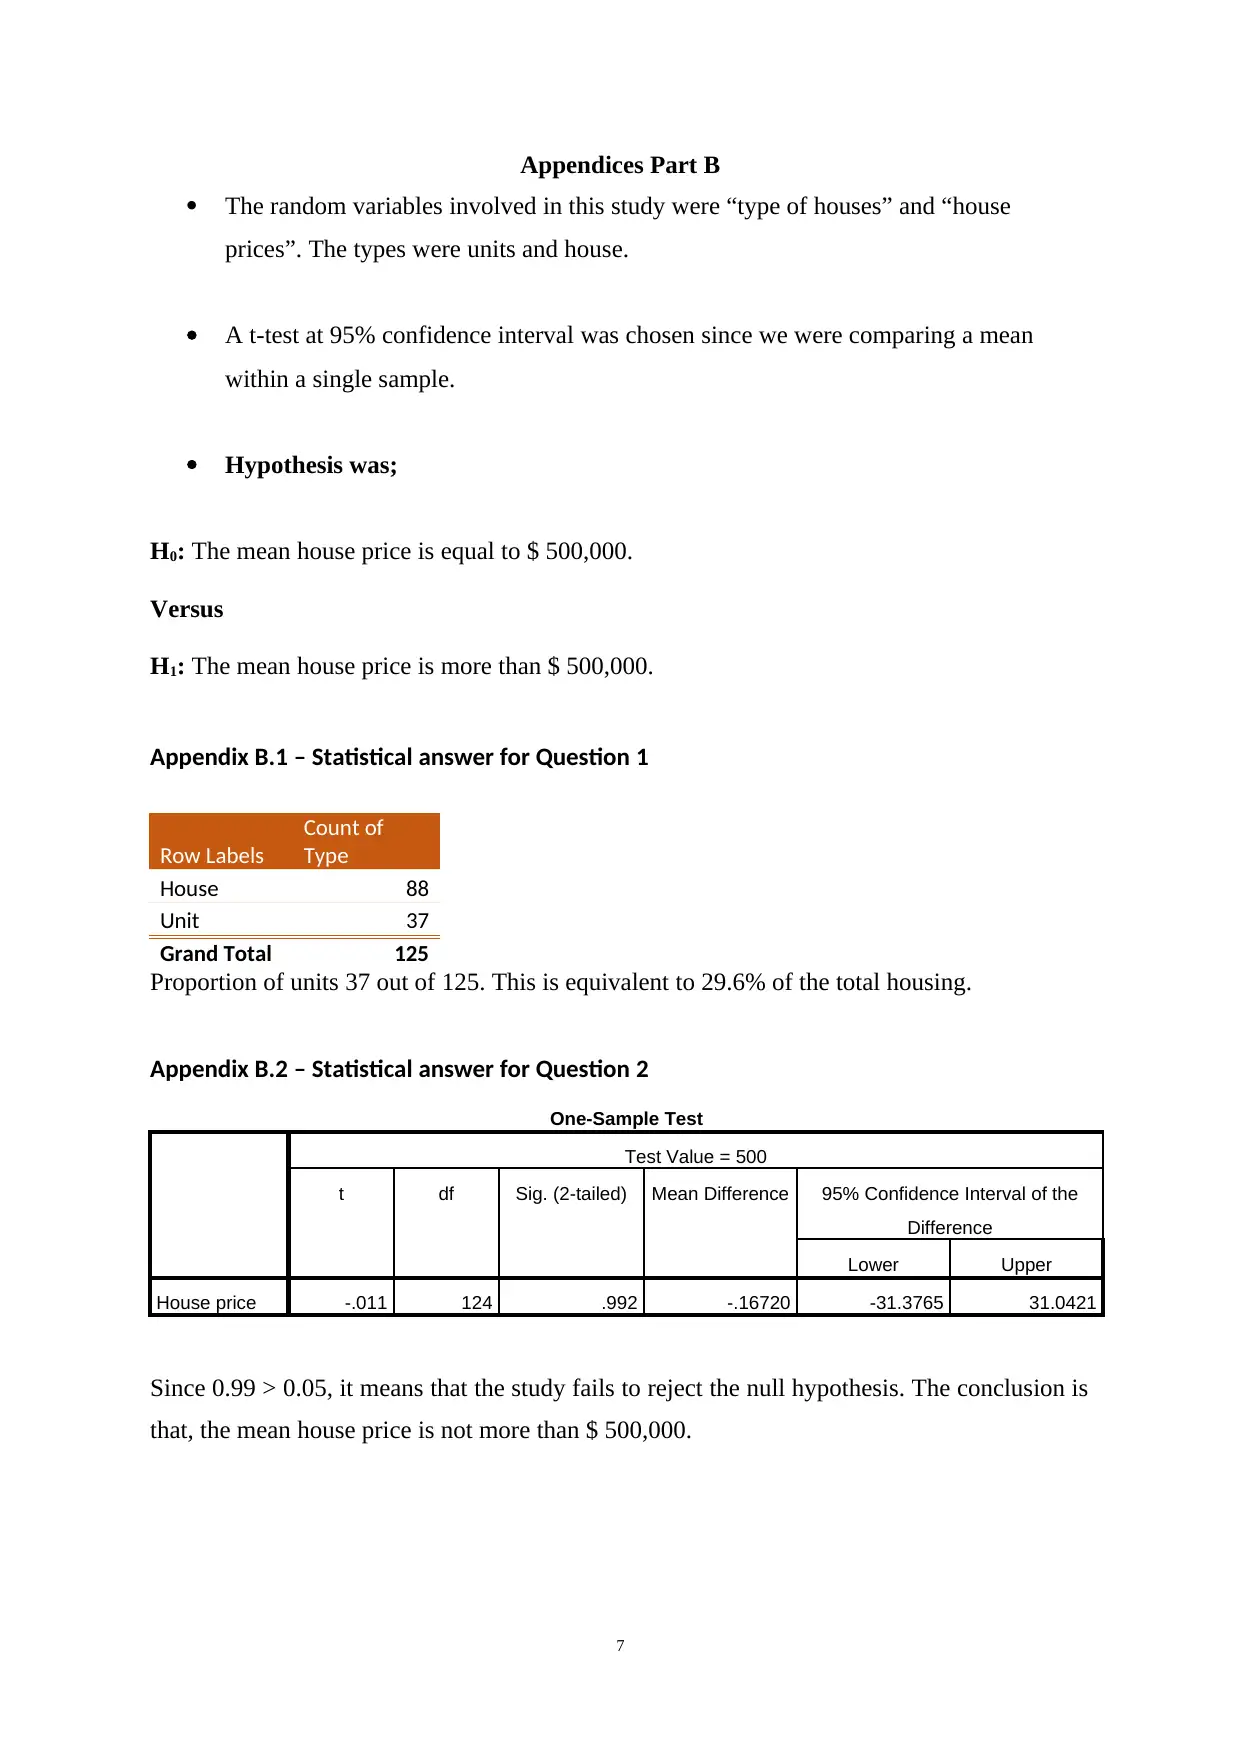
This project, part of the MAT10251 Statistical Analysis course at Southern Cross University, focuses on analyzing housing market data. The assignment investigates the proportion of residential properties for sale that are units, finding that 29.6% of the total housing stock in state B of the coastal city consists of units. The project also examines whether the mean house price in a specific area exceeds $500,000. A one-sample t-test is employed to test this hypothesis, using a 95% confidence level and a 0.05 level of significance. The analysis concludes that the mean house price is not significantly more than $500,000. The project includes the results, the statistical answers, and the tables and appendices supporting the findings.
Document Page
SOUTHERN CROSS UNIVERSITY
School of Business and Tourism
MAT10251 Statistical Analysis
PROJECT COVER SHEET
Please complete all of the following details and then make these sheets the first pages of
your project – do not send it as a separate document.
Your project must be submitted as a Word document.
PART B
Student Name:
Student ID No.:
Tutor’s name:
Due date:
Date submitted:
Declaration:
I have read and understand the Rules Relating to Awards (Rule 3 Section 18 –
Academic Integrity) as contained in the SCU Policy Library. I understand the
penalties that apply for academic misconduct and agree to be bound by these
rules.
The work I am submitting electronically is entirely my own work.
Signed:
(please type
your name)
Date:
tabler-icon-diamond-filled.svg

Paraphrase This Document

Need a fresh take? Get an instant paraphrase of this document with our AI Paraphraser
Document Page
STUDENT NAME:
STUDENT ID NUMBER:
MAT10251 – Statistical Analysis
Project Part B
Complete the summary table below.
Sample Number (last digit of your student ID number)
Confidence Level 95%
Level of Significance 0.05
Value: 15%
PLEASE ENSURE YOU KEEP A COPY OF YOUR PROJECT
2
Document Page
Self-Marking Sheet for Part A
Reflection/feedback (approximately 200 words)
3
Document Page
Marking and Feedback Sheet Part B
Part B Statistical Inference Tasks (19 marks)
Statistical Inference Question 1
Choice of technique, assumptions & other required steps 3 3.0
Calculation (Excel output) 3 3.0
Conclusion 2 1.0
Statistical Inference Question 2
Choice of technique, assumptions & other required steps 6 5.0
Calculation (Excel output) 3 2.0
Decision and conclusion 2 2.0
Written task - Discussion and results (6 marks)
Question 1 2 2.0
Question 2 2 2.0
Structure, grammar and spelling 2 2.0
Total Part B 30 22.0
Comments
4
tabler-icon-diamond-filled.svg

Paraphrase This Document

Need a fresh take? Get an instant paraphrase of this document with our AI Paraphraser
Document Page
Results
B.1 Percentage of Units for Sale
Housing has been a major issue in many cities of the world especially in this 21st century. A
bigger proportion of citizens of nations have been migrating to urban and semi-urban areas to
search for job opportunities. The resultant effect has been the overstretching of the housing
facilities in many cities. This has led to plummeting of house prices to the extent that
common people are not able to afford. This coupled with has economic times has forced
many who were earlier living in 4 and more bedroomed houses to look for smaller houses
with fewer bedrooms which they can afford. In regard to this, this study focussed on finding
out the proportion of residential properties for sale that are units in state B of the coastal city.
Table of distribution of residential by type
Row Labels
Count of
Type
House 88
Unit 37
Grand Total 125
Table 1
As seen above the proportion of unit residential in state B of the coastal town is 37 out of
125. This is equivalent to 29.6% of the total housing.
B.2 Mean House Price Over Half a Million Dollars
According to researches that had been done previously regarding house prices in Coastal city
1 state A, generally, the price on average has been $ 500,000. To add on most buyers in this
area can only afford to buy at maximum, this average price. They consider a price more than
$ 500,000 to be too high to be afforded by them. In regard to this, this study sought to
establish whether the house prices in this area is more than $ 500,000 and hence can evaluate
whether customers will be willing to purchase houses from this area.
Test
Since this is a test of whether a measure (mean) is more than a value ($ 500,000) within one
sample, one sample t-test will be employed. The level of significance to be used is 95% and
0.05 level of significance. Since this is a parametric test, it is therefore very sensitive to
5
Document Page
normality. The sample was assumed normal since it was greater than 30 in size (125). The
hypothesis for the test is framed as below;
Hypothesis
H0: The mean house price is equal to $ 500,000.
Versus
H1: The mean house price is more than $ 500,000.
Table of results
One-Sample Test
Test Value = 500
t df Sig. (2-tailed) Mean Difference 95% Confidence Interval of the
Difference
Lower Upper
House price -.011 124 .992 -.16720 -31.3765 31.0421
Table 2
From the results table, the computed p-value is compared (0.992) is compared to the level of
significance which is 0.05. It can be seen that 0.99 > 0.05. This means that the study fails to
reject the null hypothesis. The conclusion is that, the mean house price is not more than $
500,000.
6
Document Page
Appendices Part B
The random variables involved in this study were “type of houses” and “house
prices”. The types were units and house.
A t-test at 95% confidence interval was chosen since we were comparing a mean
within a single sample.
Hypothesis was;
H0: The mean house price is equal to $ 500,000.
Versus
H1: The mean house price is more than $ 500,000.
Appendix B.1 – Statistical answer for Question 1
Row Labels
Count of
Type
House 88
Unit 37
Grand Total 125
Proportion of units 37 out of 125. This is equivalent to 29.6% of the total housing.
Appendix B.2 – Statistical answer for Question 2
One-Sample Test
Test Value = 500
t df Sig. (2-tailed) Mean Difference 95% Confidence Interval of the
Difference
Lower Upper
House price -.011 124 .992 -.16720 -31.3765 31.0421
Since 0.99 > 0.05, it means that the study fails to reject the null hypothesis. The conclusion is
that, the mean house price is not more than $ 500,000.
7
chevron_up_icon
1 out of 7
circle_padding
hide_on_mobile
zoom_out_icon
[object Object]