Review of Experimental Design in Animal Research Studies
VerifiedAdded on 2023/01/19
|4
|619
|39
Report
AI Summary
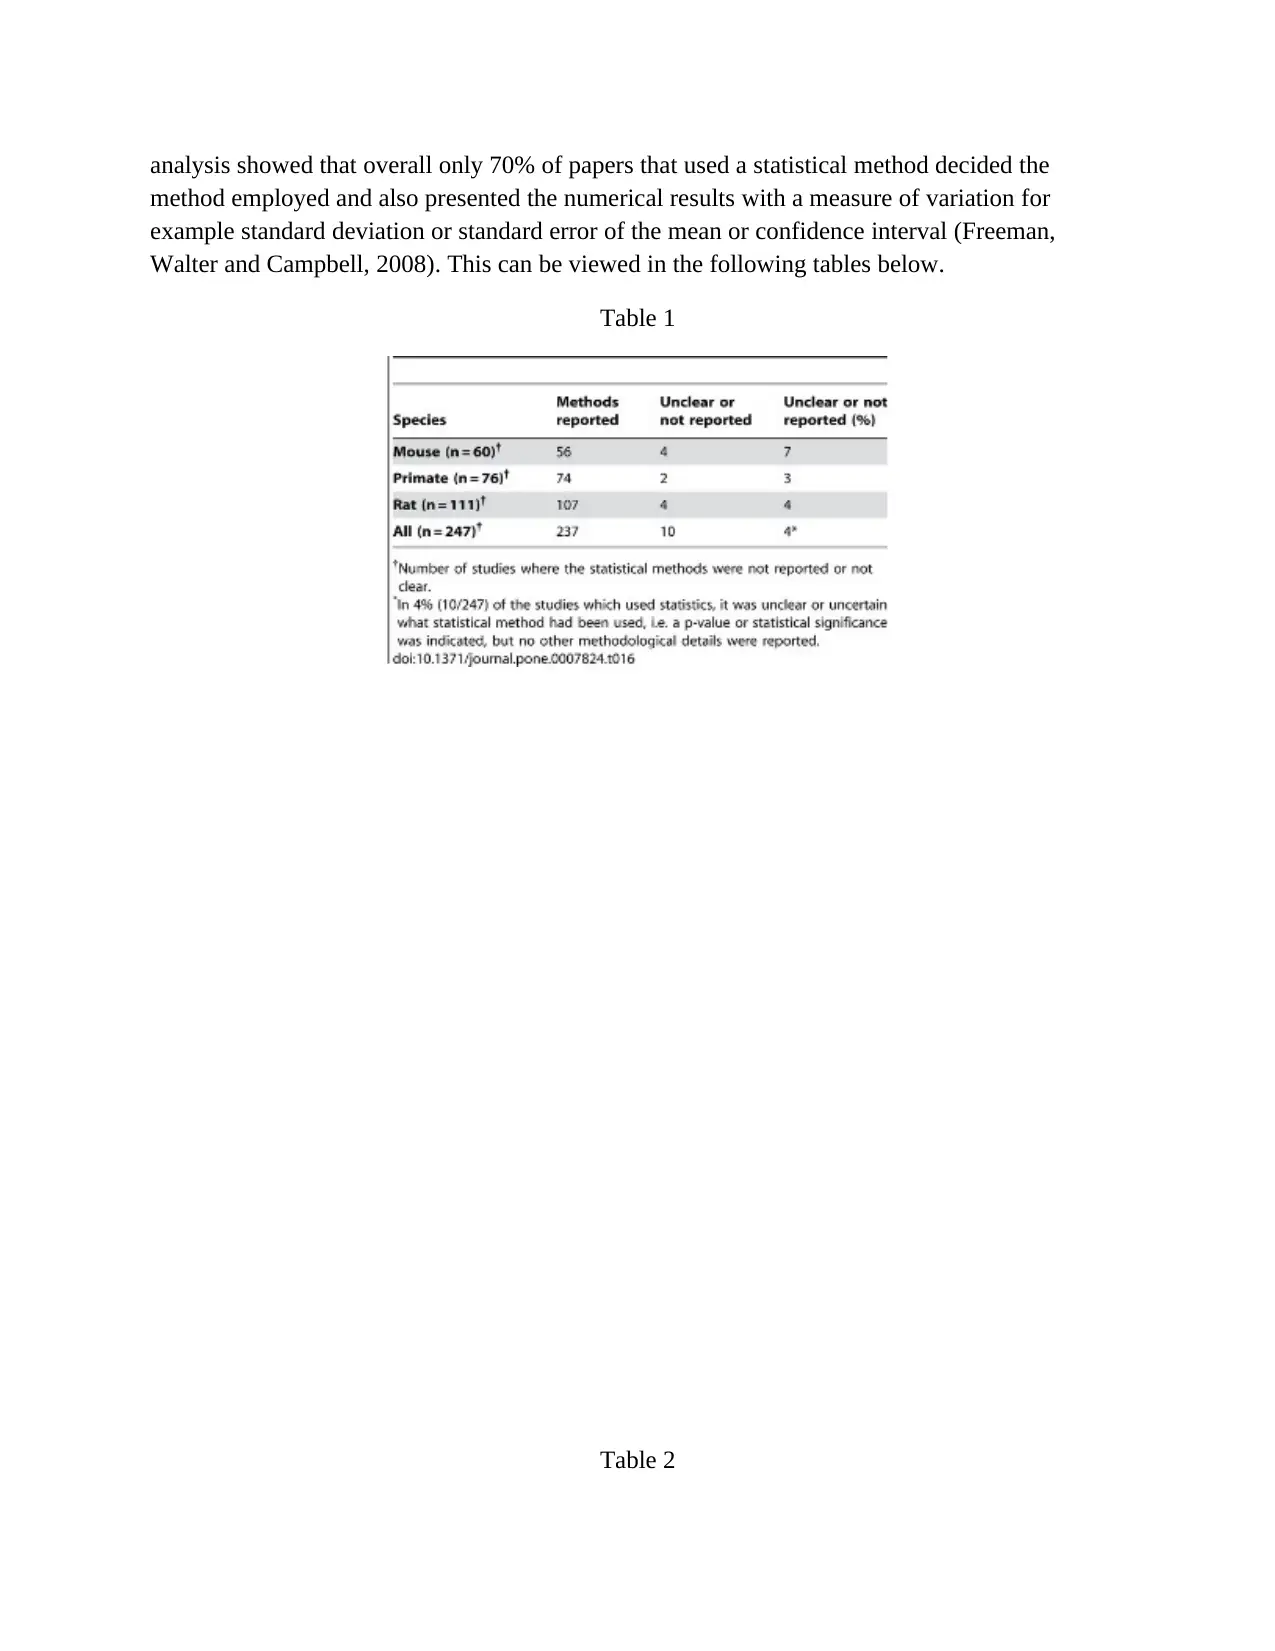
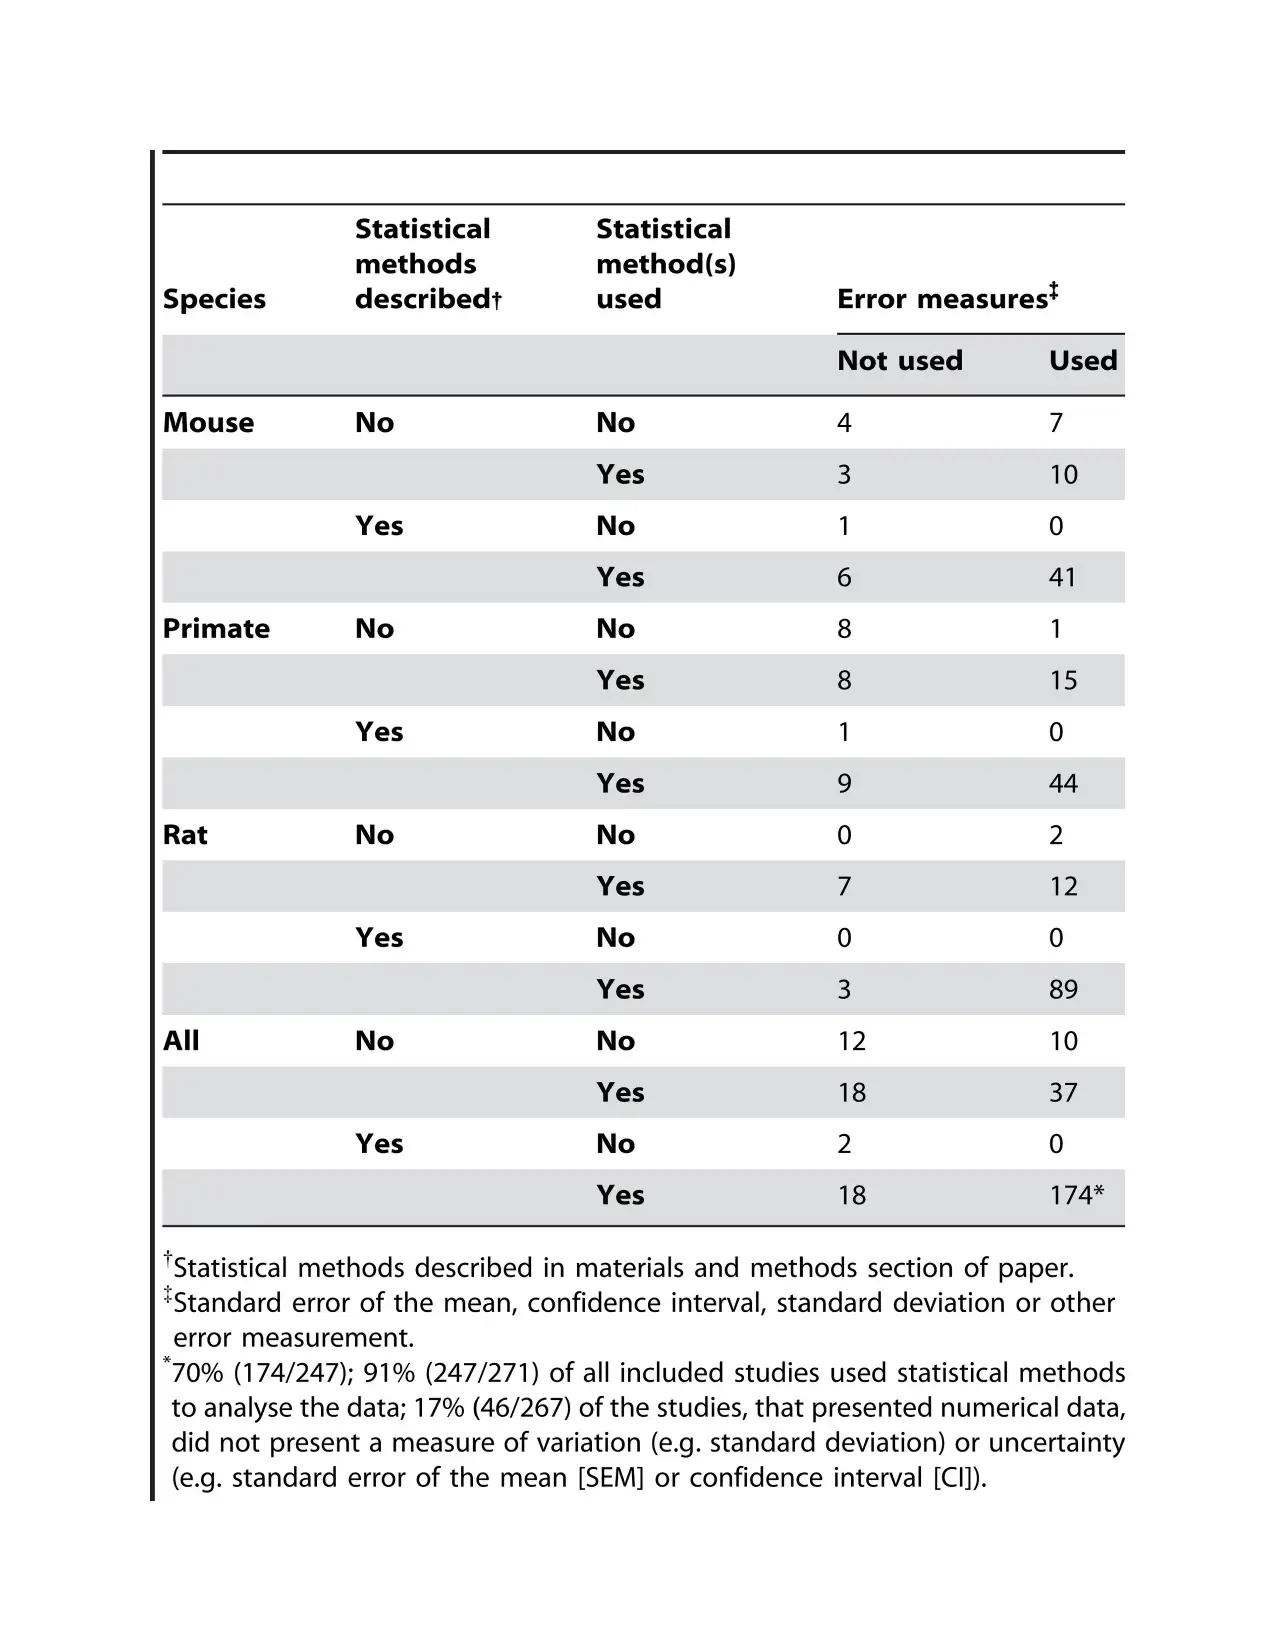
This report presents an analysis of the quality of experimental design, statistical analysis, and reporting in animal research. The study examined 271 publications involving mice, rats, and non-human primates, assessing the reporting of study objectives, methods, and results. The findings reveal that while 91% of the studies used statistical methods, only 70% of the papers presented numerical results with a measure of variation. The report highlights the importance of transparent and comprehensive reporting in scientific publications to ensure the validity and reproducibility of research findings. The study emphasizes the need for improved experimental design and statistical analysis in animal research to maximize the value of each experiment and adhere to ethical considerations. The report concludes by suggesting that the findings indicate cause for concern and that improvements are needed in the reporting of animal research to enhance the robustness and reliability of the results.
1 out of 4
Related Documents


Your All-in-One AI-Powered Toolkit for Academic Success.
+13062052269
info@desklib.com
Available 24*7 on WhatsApp / Email
![[object Object]](/_next/static/media/star-bottom.7253800d.svg)
Copyright © 2020–2026 A2Z Services. All Rights Reserved. Developed and managed by ZUCOL.