Individual Project: Analyzing Earlswood Station Passenger Data
VerifiedAdded on 2021/02/20
|8
|1158
|104
Project
AI Summary
This individual project analyzes passenger data from Earlswood (West Midlands) rail station over a ten-year period. The project begins by arranging the data in a tabular format and presenting it visually through column and line charts. It then delves into descriptive statistics, calculating the mean, medi...

INDIVIDUAL PROJECT
Table of Contents
Table of Contents.............................................................................................................................2
INTRODUCTION...........................................................................................................................1
MAIN BODY..................................................................................................................................1
1. Data arrangement in table format............................................................................................1
2. Presentation of Data in Chart Format......................................................................................1
Paraphrase This Document
Need a fresh take? Get an instant paraphrase of this document with our AI Paraphraser
3. Steps for calculating final value..............................................................................................2
4. Application of linear forecasting model..................................................................................4
Calculation of m value.................................................................................................................5
Calculation of c value..................................................................................................................5
Forecasting m and c value for 12th and 15th year.........................................................................5
CONCLUSION................................................................................................................................6
REFERENCES................................................................................................................................7
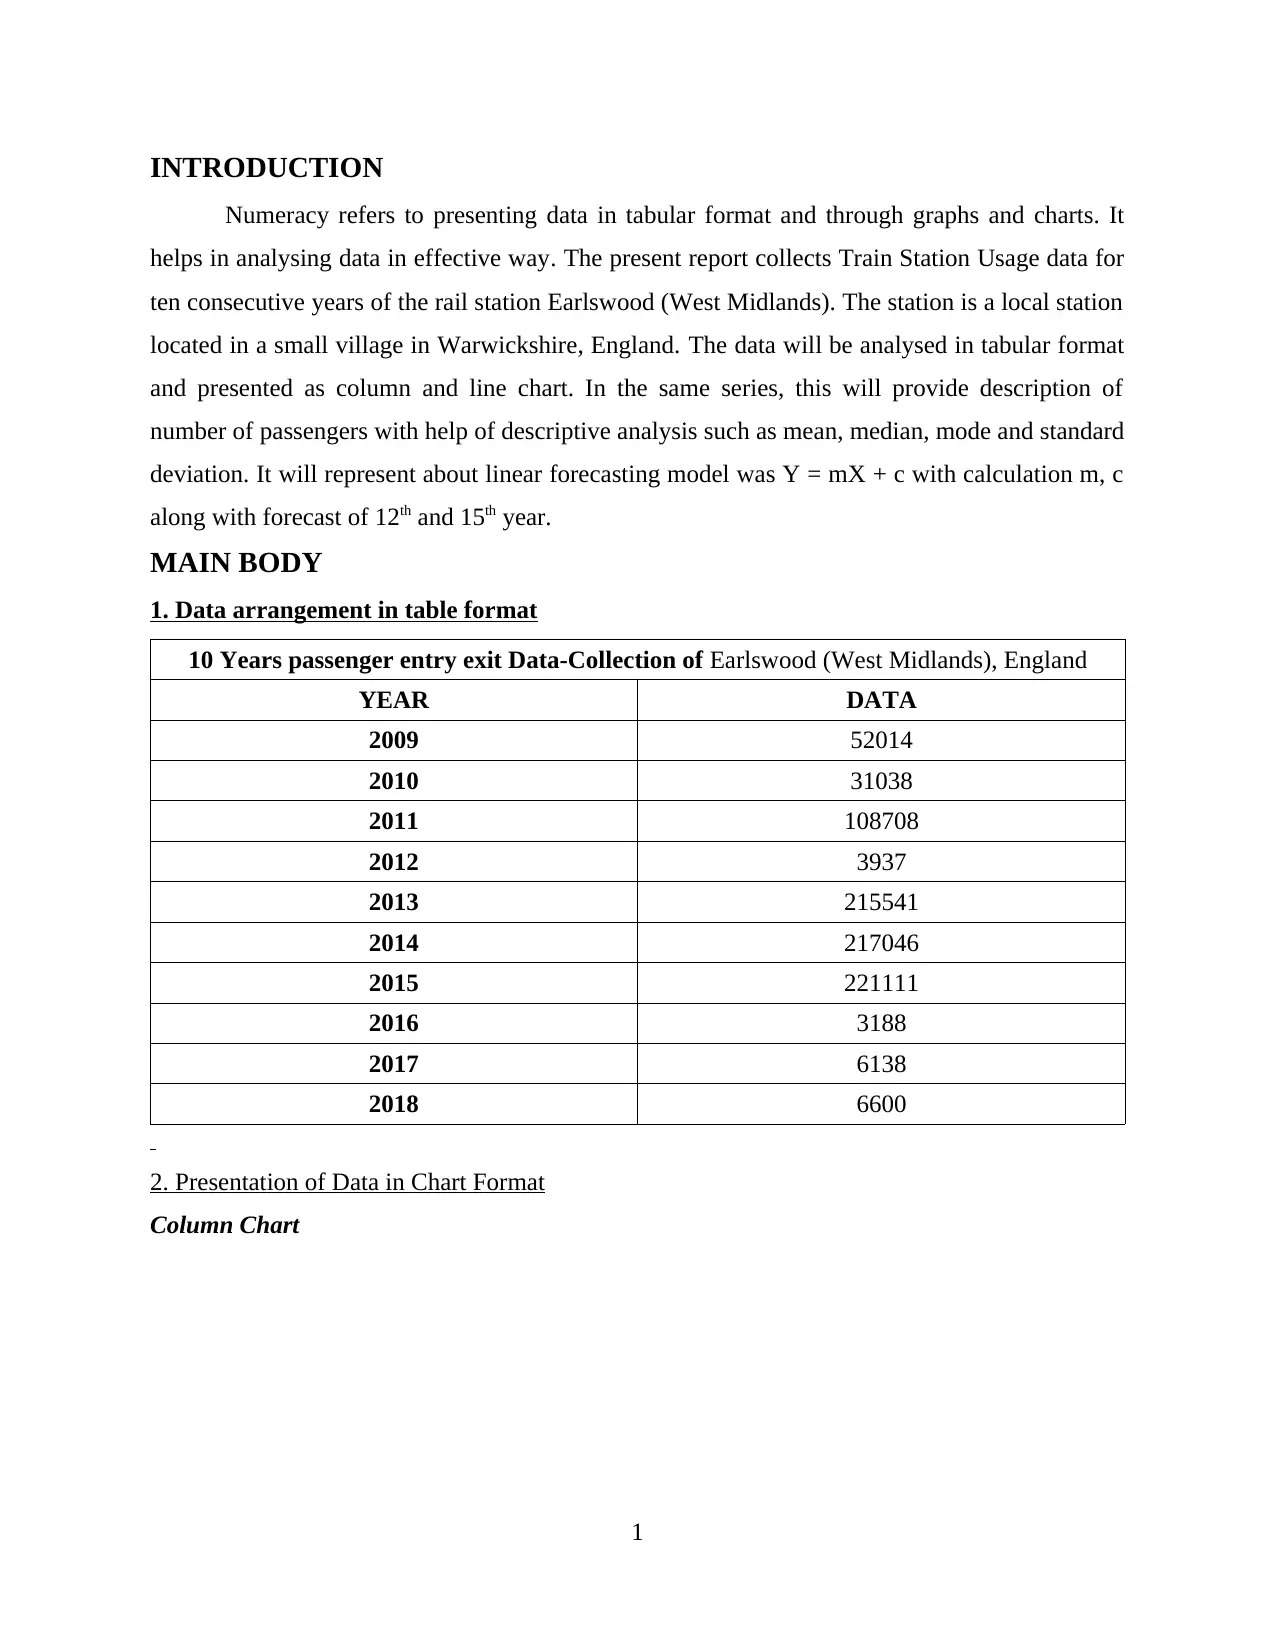
INTRODUCTION
Numeracy refers to presenting data in tabular format and through graphs and charts. It
helps in analysing data in effective way. The present report collects Train Station Usage data for
ten consecutive years of the rail station Earlswood (West Midlands). The station is a local station
located in a small village in Warwickshire, England. The data will be analysed in tabular format
and presented as column and line chart. In the same series, this will provide description of
number of passengers with help of descriptive analysis such as mean, median, mode and standard
deviation. It will represent about linear forecasting model was Y = mX + c with calculation m, c
along with forecast of 12th and 15th year.
MAIN BODY
1. Data arrangement in table format
10 Years passenger entry exit Data-Collection of Earlswood (West Midlands), England
YEAR DATA
2009 52014
2010 31038
2011 108708
2012 3937
2013 215541
2014 217046
2015 221111
2016 3188
2017 6138
2018 6600
2. Presentation of Data in Chart Format
Column Chart
1
You're viewing a preview
Unlock full access by subscribing today!


Line Chart
3. Steps for calculating final value
Mean
Mean refers to a type of average. The steps of mean are stated below:
Every amount is added for the purpose of finding the sum
Insert the number in tabular format (Sangeux, M. and et.al., 2016).
2
3. Steps for calculating final value
Mean
Mean refers to a type of average. The steps of mean are stated below:
Every amount is added for the purpose of finding the sum
Insert the number in tabular format (Sangeux, M. and et.al., 2016).
2
Paraphrase This Document
Need a fresh take? Get an instant paraphrase of this document with our AI Paraphraser
Select black cell and enter formula of mean.
Select the data for which it is to be calculated.
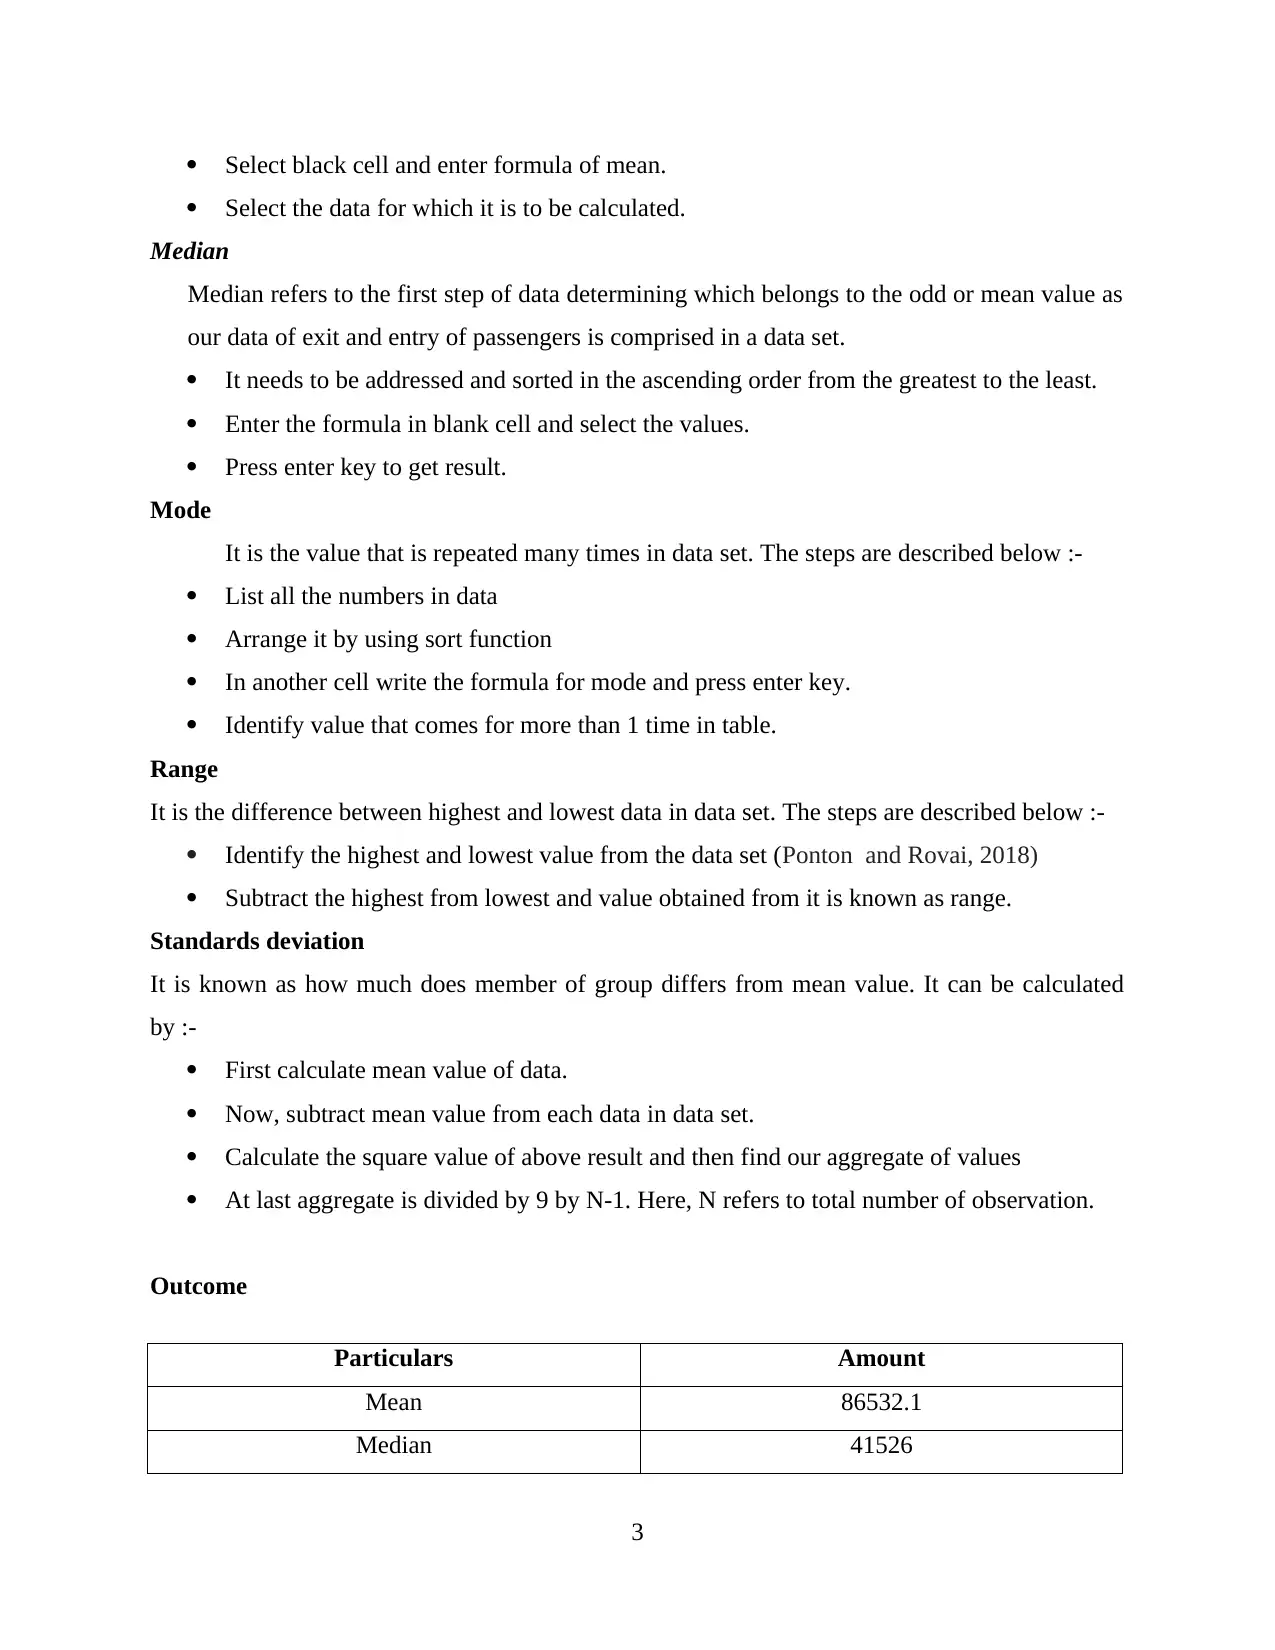
Median
Median refers to the first step of data determining which belongs to the odd or mean value as
our data of exit and entry of passengers is comprised in a data set.
It needs to be addressed and sorted in the ascending order from the greatest to the least.
Enter the formula in blank cell and select the values.
Press enter key to get result.
Mode
It is the value that is repeated many times in data set. The steps are described below :-
List all the numbers in data
Arrange it by using sort function
In another cell write the formula for mode and press enter key.
Identify value that comes for more than 1 time in table.
Range
It is the difference between highest and lowest data in data set. The steps are described below :-
Identify the highest and lowest value from the data set (Ponton and Rovai, 2018)
Subtract the highest from lowest and value obtained from it is known as range.
Standards deviation
It is known as how much does member of group differs from mean value. It can be calculated
by :-
First calculate mean value of data.
Now, subtract mean value from each data in data set.
Calculate the square value of above result and then find our aggregate of values
At last aggregate is divided by 9 by N-1. Here, N refers to total number of observation.
Outcome
Particulars Amount
Mean 86532.1
Median 41526
3
Select the data for which it is to be calculated.
Median
Median refers to the first step of data determining which belongs to the odd or mean value as
our data of exit and entry of passengers is comprised in a data set.
It needs to be addressed and sorted in the ascending order from the greatest to the least.
Enter the formula in blank cell and select the values.
Press enter key to get result.
Mode
It is the value that is repeated many times in data set. The steps are described below :-
List all the numbers in data
Arrange it by using sort function
In another cell write the formula for mode and press enter key.
Identify value that comes for more than 1 time in table.
Range
It is the difference between highest and lowest data in data set. The steps are described below :-
Identify the highest and lowest value from the data set (Ponton and Rovai, 2018)
Subtract the highest from lowest and value obtained from it is known as range.
Standards deviation
It is known as how much does member of group differs from mean value. It can be calculated
by :-
First calculate mean value of data.
Now, subtract mean value from each data in data set.
Calculate the square value of above result and then find our aggregate of values
At last aggregate is divided by 9 by N-1. Here, N refers to total number of observation.
Outcome
Particulars Amount
Mean 86532.1
Median 41526
3
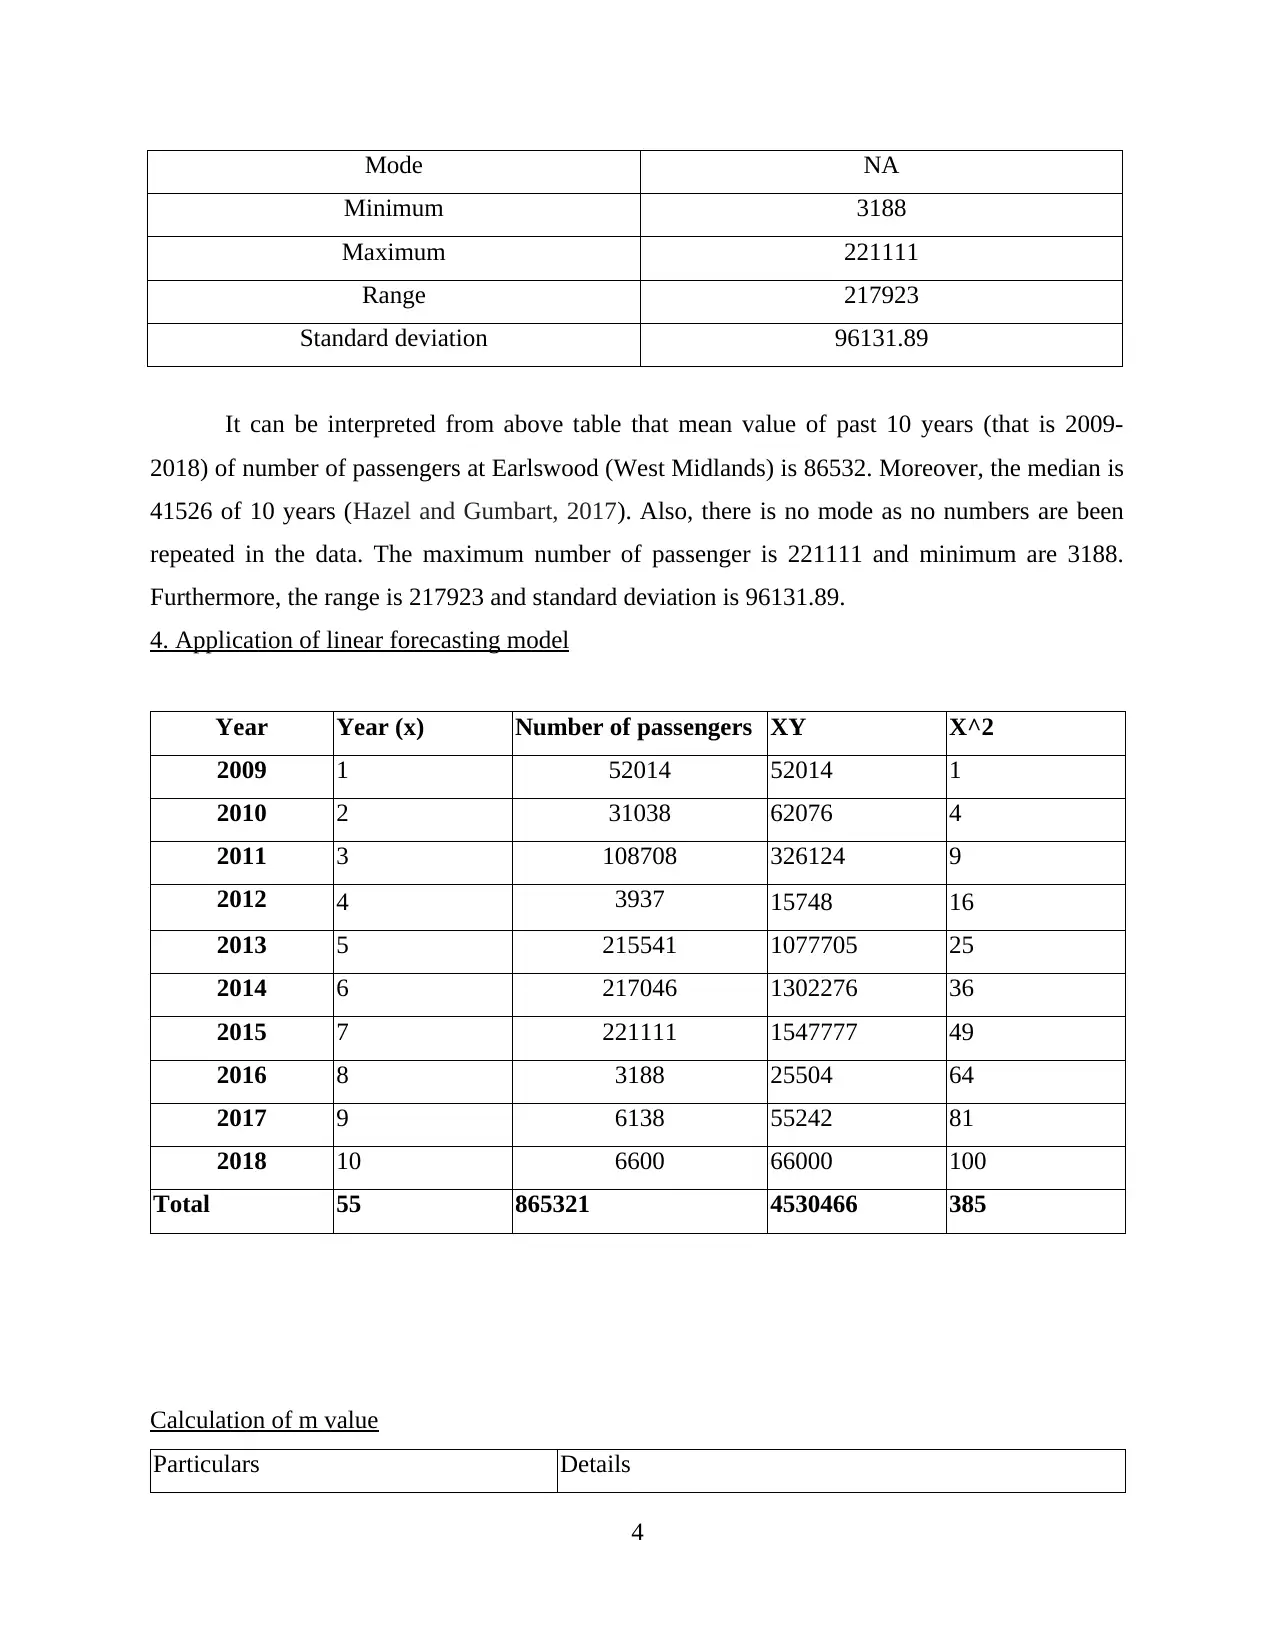
Mode NA
Minimum 3188
Maximum 221111
Range 217923
Standard deviation 96131.89
It can be interpreted from above table that mean value of past 10 years (that is 2009-
2018) of number of passengers at Earlswood (West Midlands) is 86532. Moreover, the median is
41526 of 10 years (Hazel and Gumbart, 2017). Also, there is no mode as no numbers are been
repeated in the data. The maximum number of passenger is 221111 and minimum are 3188.
Furthermore, the range is 217923 and standard deviation is 96131.89.
4. Application of linear forecasting model
Year Year (x) Number of passengers XY X^2
2009 1 52014 52014 1
2010 2 31038 62076 4
2011 3 108708 326124 9
2012 4 3937 15748 16
2013 5 215541 1077705 25
2014 6 217046 1302276 36
2015 7 221111 1547777 49
2016 8 3188 25504 64
2017 9 6138 55242 81
2018 10 6600 66000 100
Total 55 865321 4530466 385
Calculation of m value
Particulars Details
4
You're viewing a preview
Unlock full access by subscribing today!
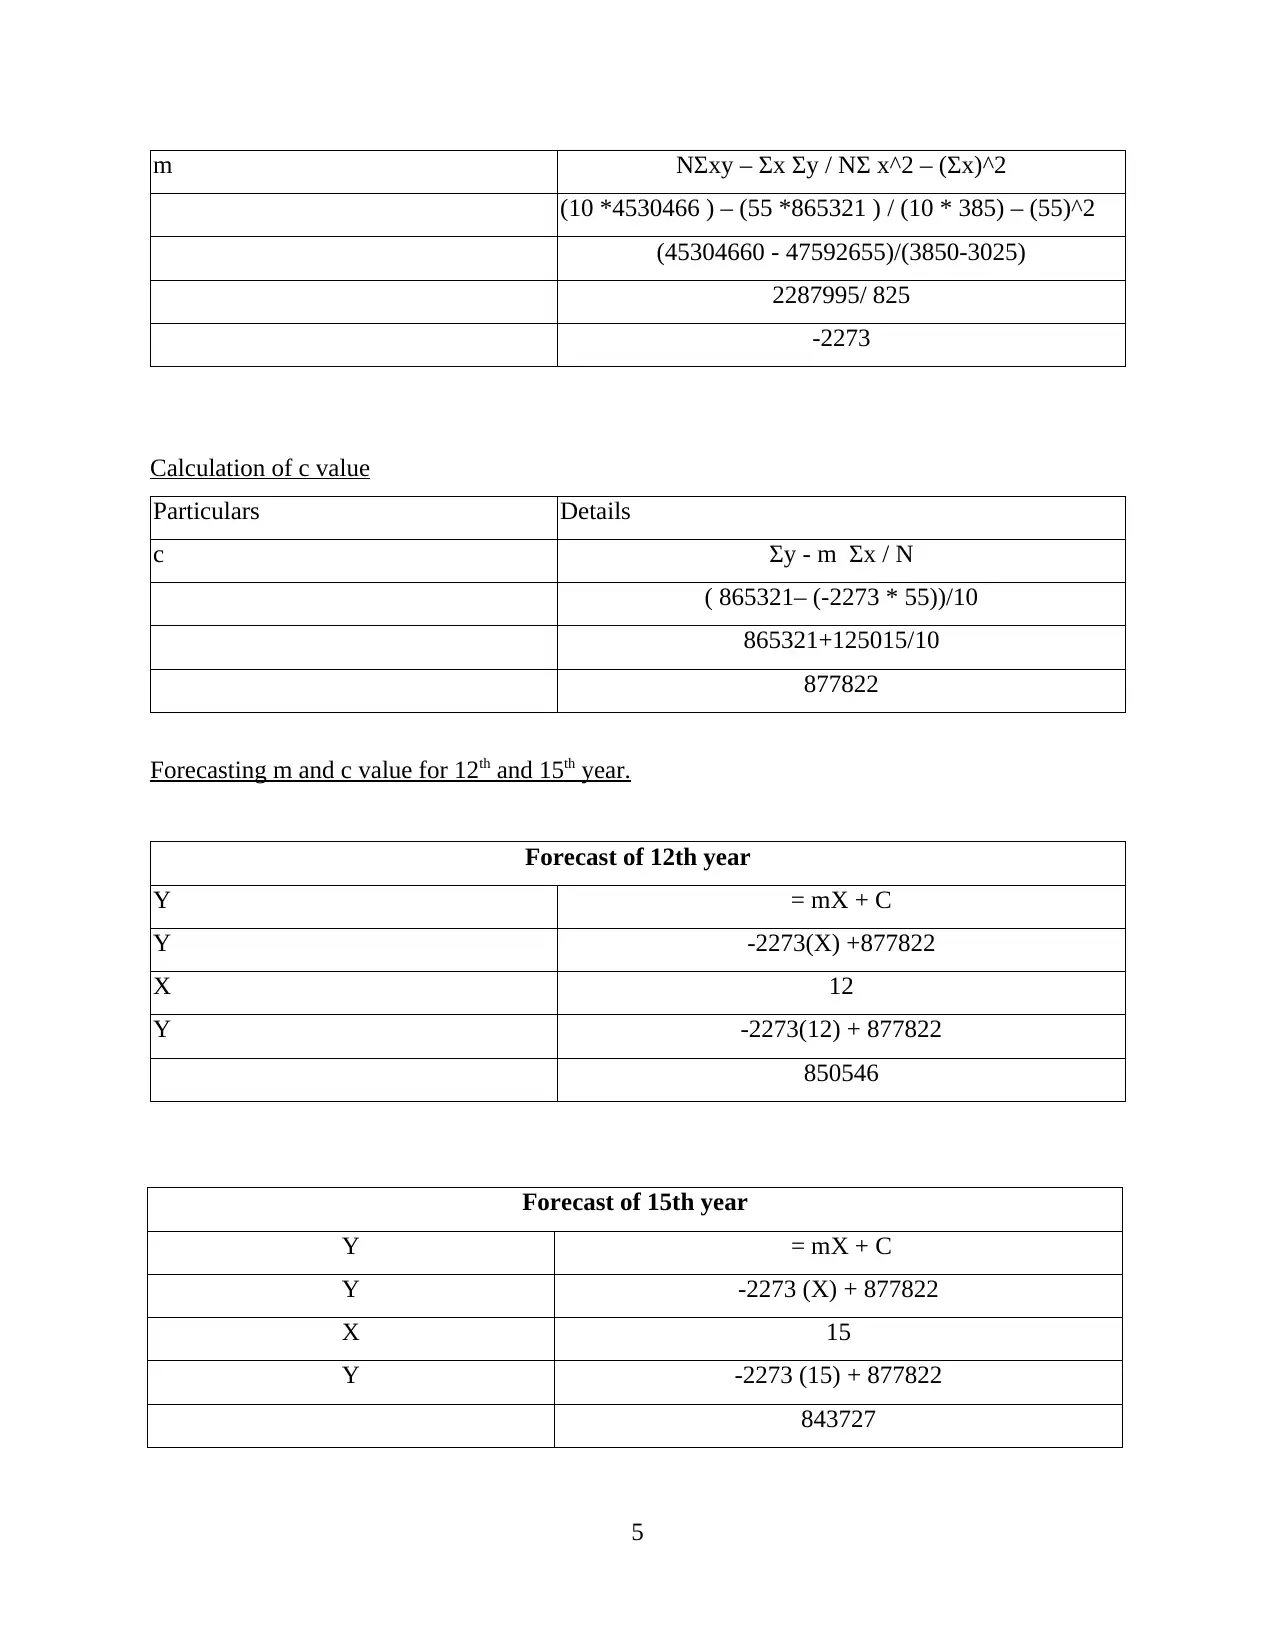
m NΣxy – Σx Σy / NΣ x^2 – (Σx)^2
(10 *4530466 ) – (55 *865321 ) / (10 * 385) – (55)^2
(45304660 - 47592655)/(3850-3025)
2287995/ 825
-2273
Calculation of c value
Particulars Details
c Σy - m Σx / N
( 865321– (-2273 * 55))/10
865321+125015/10
877822
Forecasting m and c value for 12th and 15th year.
Forecast of 12th year
Y = mX + C
Y -2273(X) +877822
X 12
Y -2273(12) + 877822
850546
Forecast of 15th year
Y = mX + C
Y -2273 (X) + 877822
X 15
Y -2273 (15) + 877822
843727
5
Paraphrase This Document
Need a fresh take? Get an instant paraphrase of this document with our AI Paraphraser
CONCLUSION
From the above report, it could be concluded that numeracy and data analysis are very
significant for analysing any details as it has shown in this with use of weather data of York. It
has reflected level of humidity and for avoiding any argument there is representation of visual
and tabular format. Moreover, it has provided descriptive statistics of data set and reflected
application of linear forecasting model where
6
1 out of 8
Related Documents


Your All-in-One AI-Powered Toolkit for Academic Success.
+13062052269
info@desklib.com
Available 24*7 on WhatsApp / Email
![[object Object]](/_next/static/media/star-bottom.7253800d.svg)
Unlock your academic potential
© 2024 | Zucol Services PVT LTD | All rights reserved.