Individual Project: Analyzing Earlswood Station Passenger Data
VerifiedAdded on 2021/02/20
|8
|1158
|104
Project
AI Summary
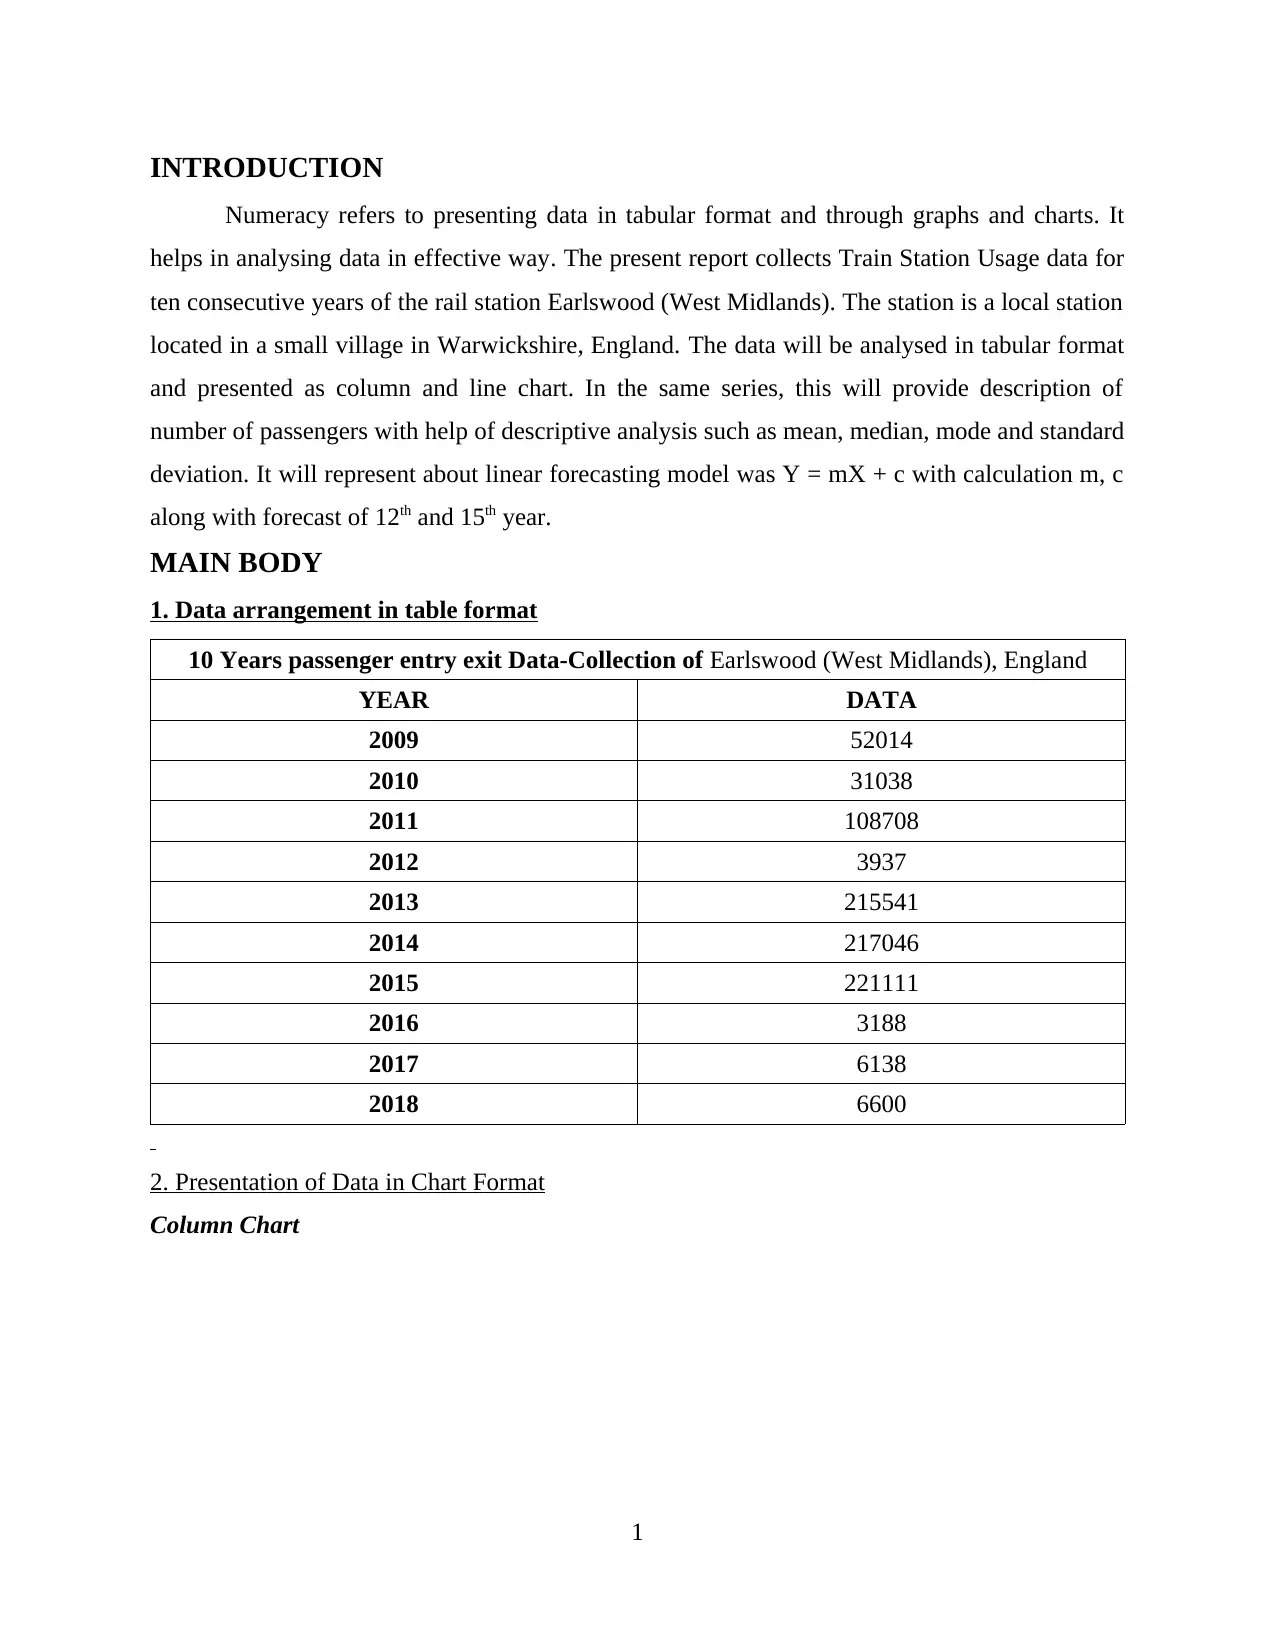
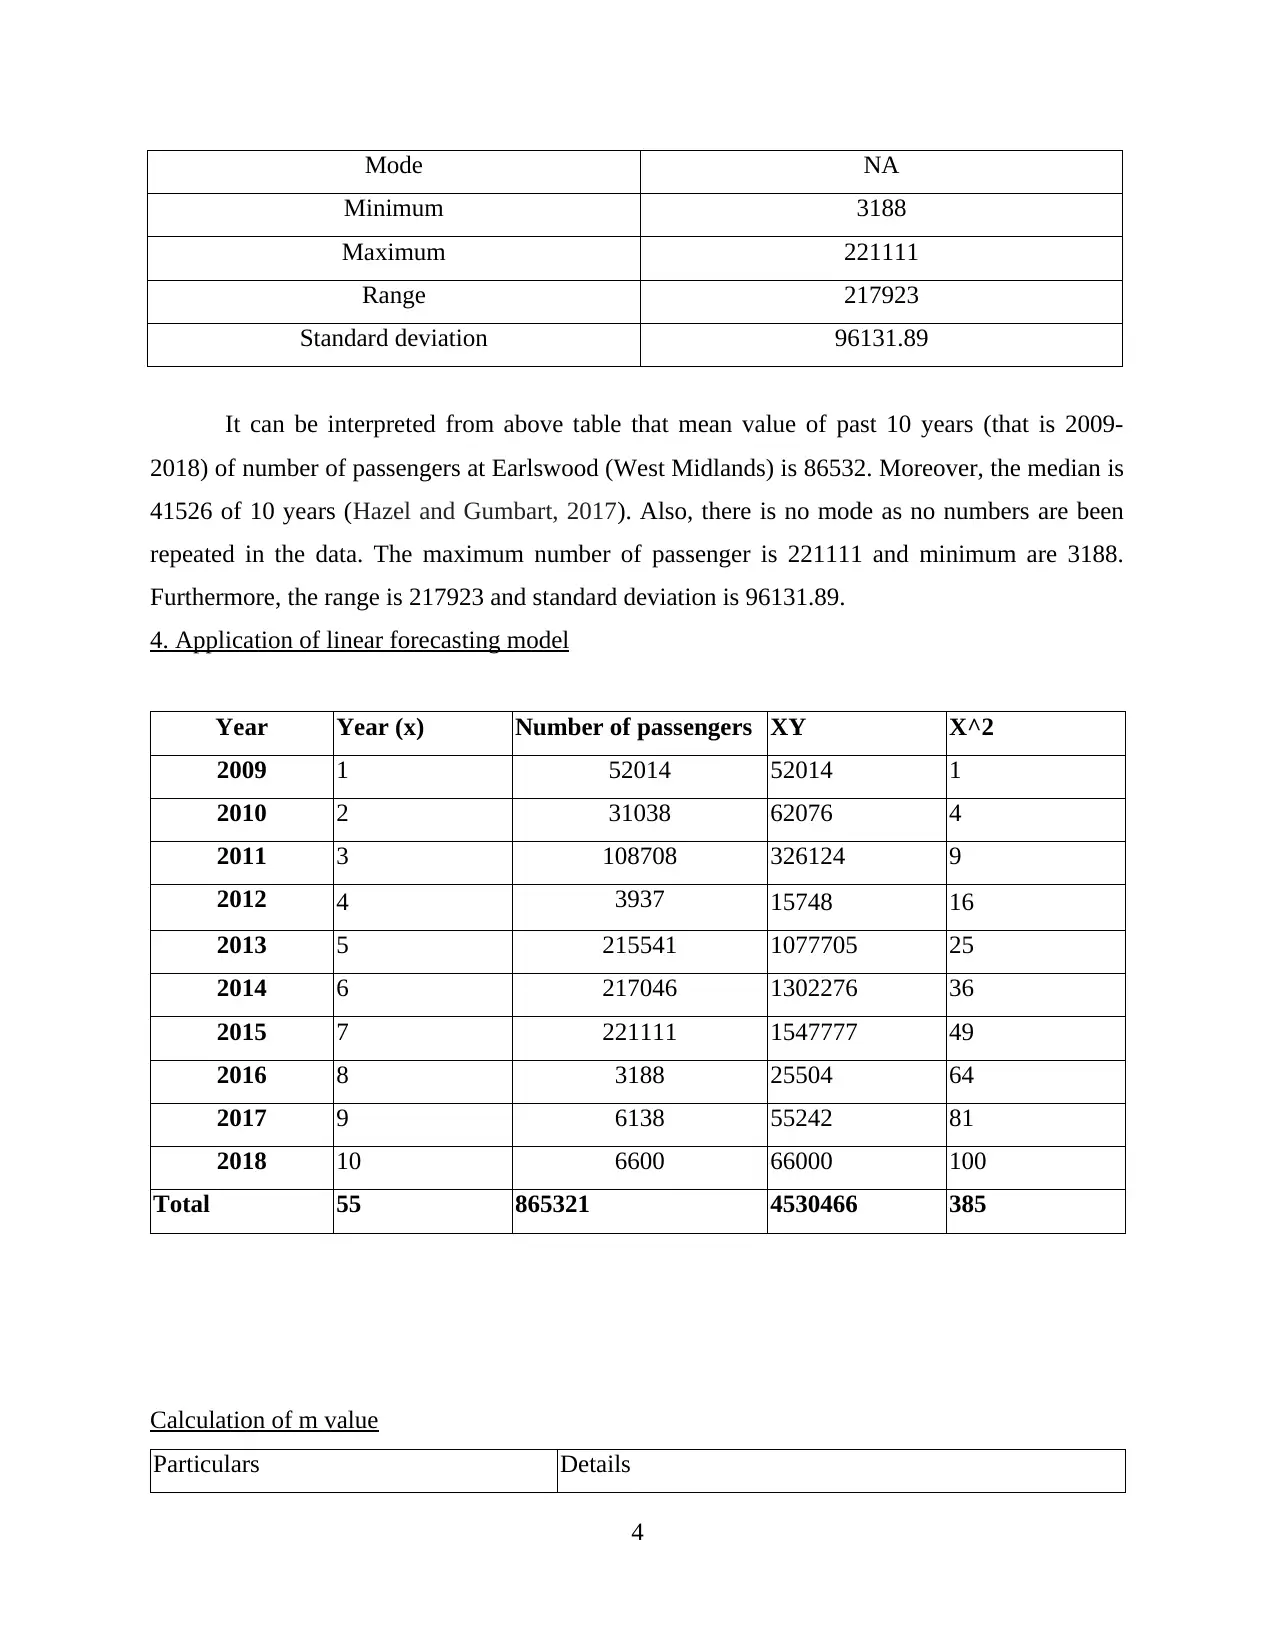
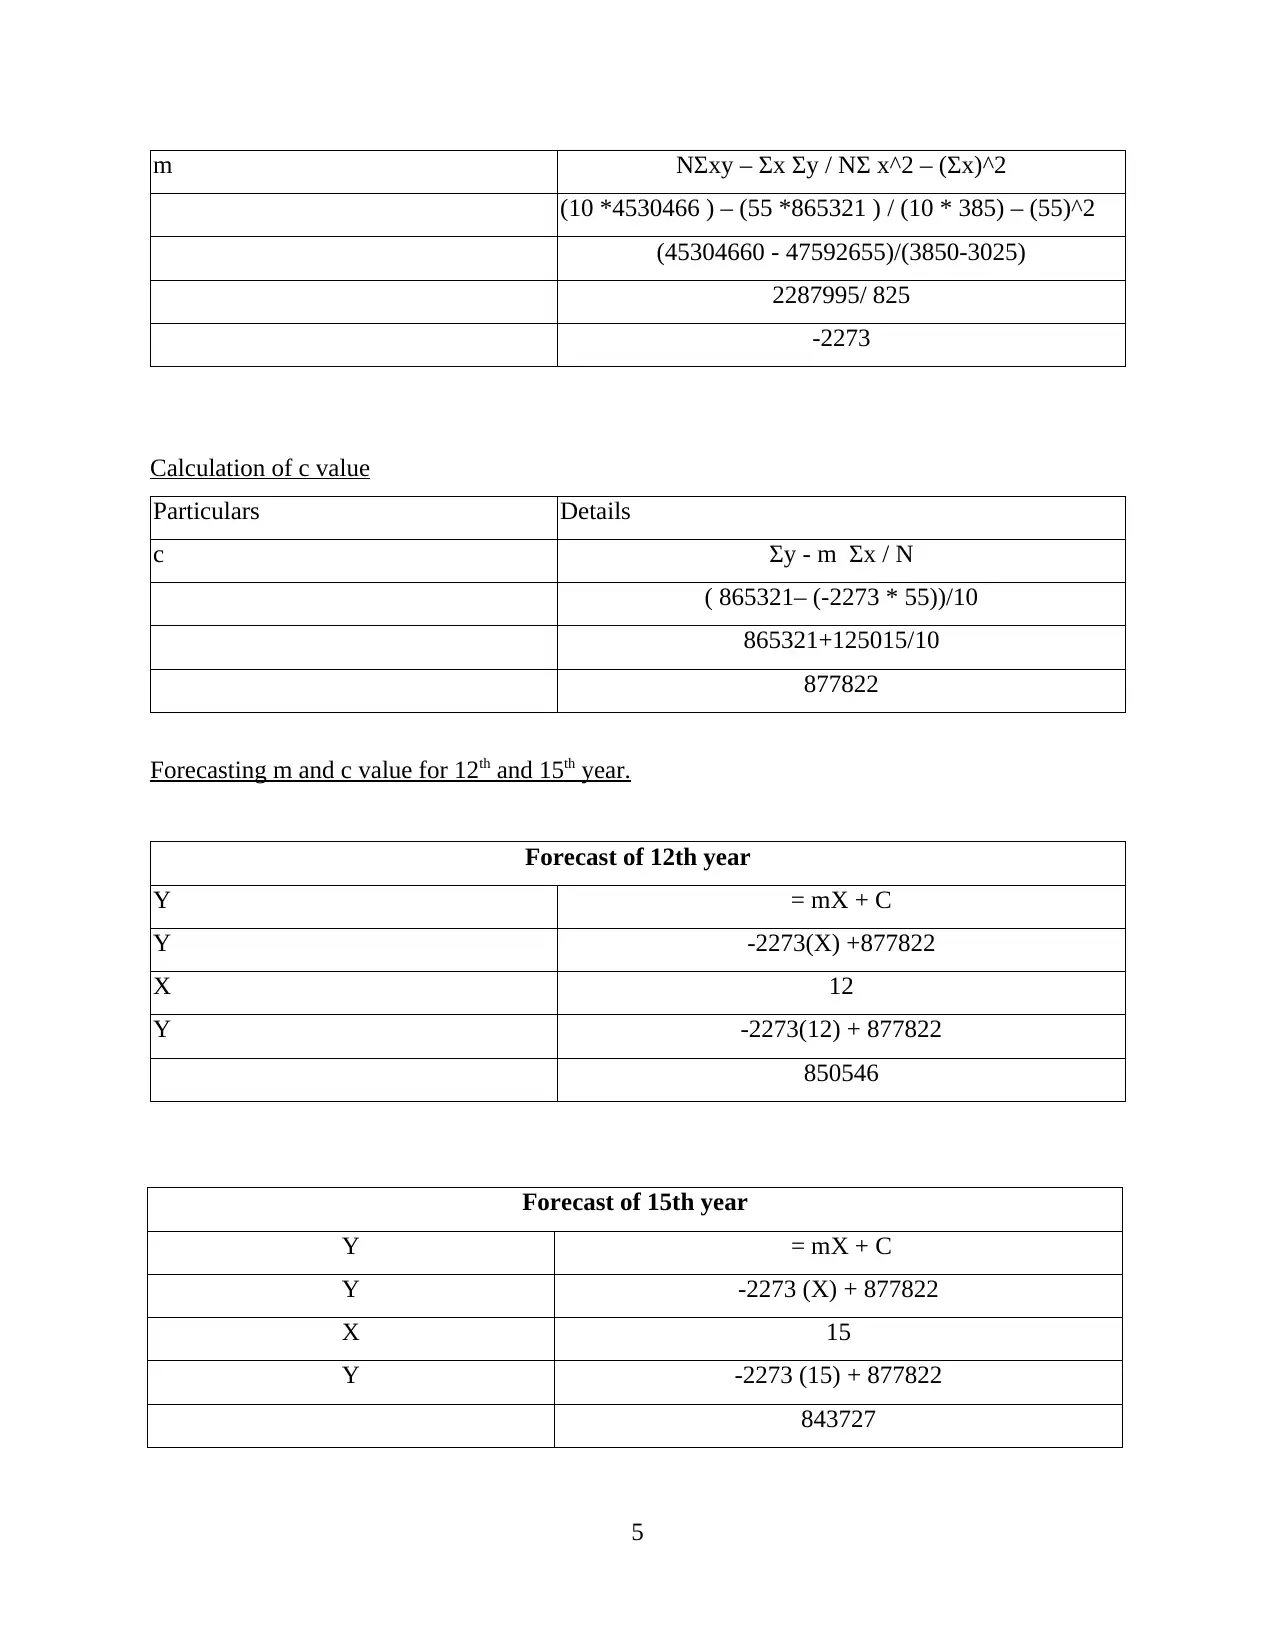
This individual project analyzes passenger data from Earlswood (West Midlands) rail station over a ten-year period. The project begins by arranging the data in a tabular format and presenting it visually through column and line charts. It then delves into descriptive statistics, calculating the mean, median, mode, range, and standard deviation to understand the data's characteristics. Furthermore, the project applies a linear forecasting model (Y = mX + c) to predict passenger numbers, calculating the values of 'm' and 'c' and forecasting passenger numbers for the 12th and 15th years. The report concludes by summarizing the findings and highlighting the significance of numeracy and data analysis in interpreting and predicting trends. The project utilizes data analysis techniques to present the data in tabular and visual formats, and to calculate descriptive statistics and linear forecasting.


1 out of 8
Related Documents


Your All-in-One AI-Powered Toolkit for Academic Success.
+13062052269
info@desklib.com
Available 24*7 on WhatsApp / Email
![[object Object]](/_next/static/media/star-bottom.7253800d.svg)
Copyright © 2020–2026 A2Z Services. All Rights Reserved. Developed and managed by ZUCOL.