Statistical Inference and Regression Analysis : Assignment
Added on 2020-05-16
14 Pages2621 Words99 Views
Running Head: STATISTICAL INFERENCE AND REGRESSION ANALYSISStatistical Inference and Regression AnalysisName of the StudentName of the UniversityAuthor Note
STATISTICAL INFERENCE AND REGRESSION ANALYSIS1Table of Contents1.0 Introduction................................................................................................................................22.0 Comparison of Stock Returns....................................................................................................22.1 Graphical Display..................................................................................................................22.2 Computation of Returns.........................................................................................................32.3 Summary of Returns..............................................................................................................52.4 Hypothesis Testing on Stock Returns....................................................................................62.5 Comparison of Risks..............................................................................................................72.6 Comparison of mean Return..................................................................................................72.7 Calculation of Excess Returns...............................................................................................82.8 Estimation of CAPM for IBM...............................................................................................92.9 Determination of Neutral Stock...........................................................................................11Bibliography..................................................................................................................................13
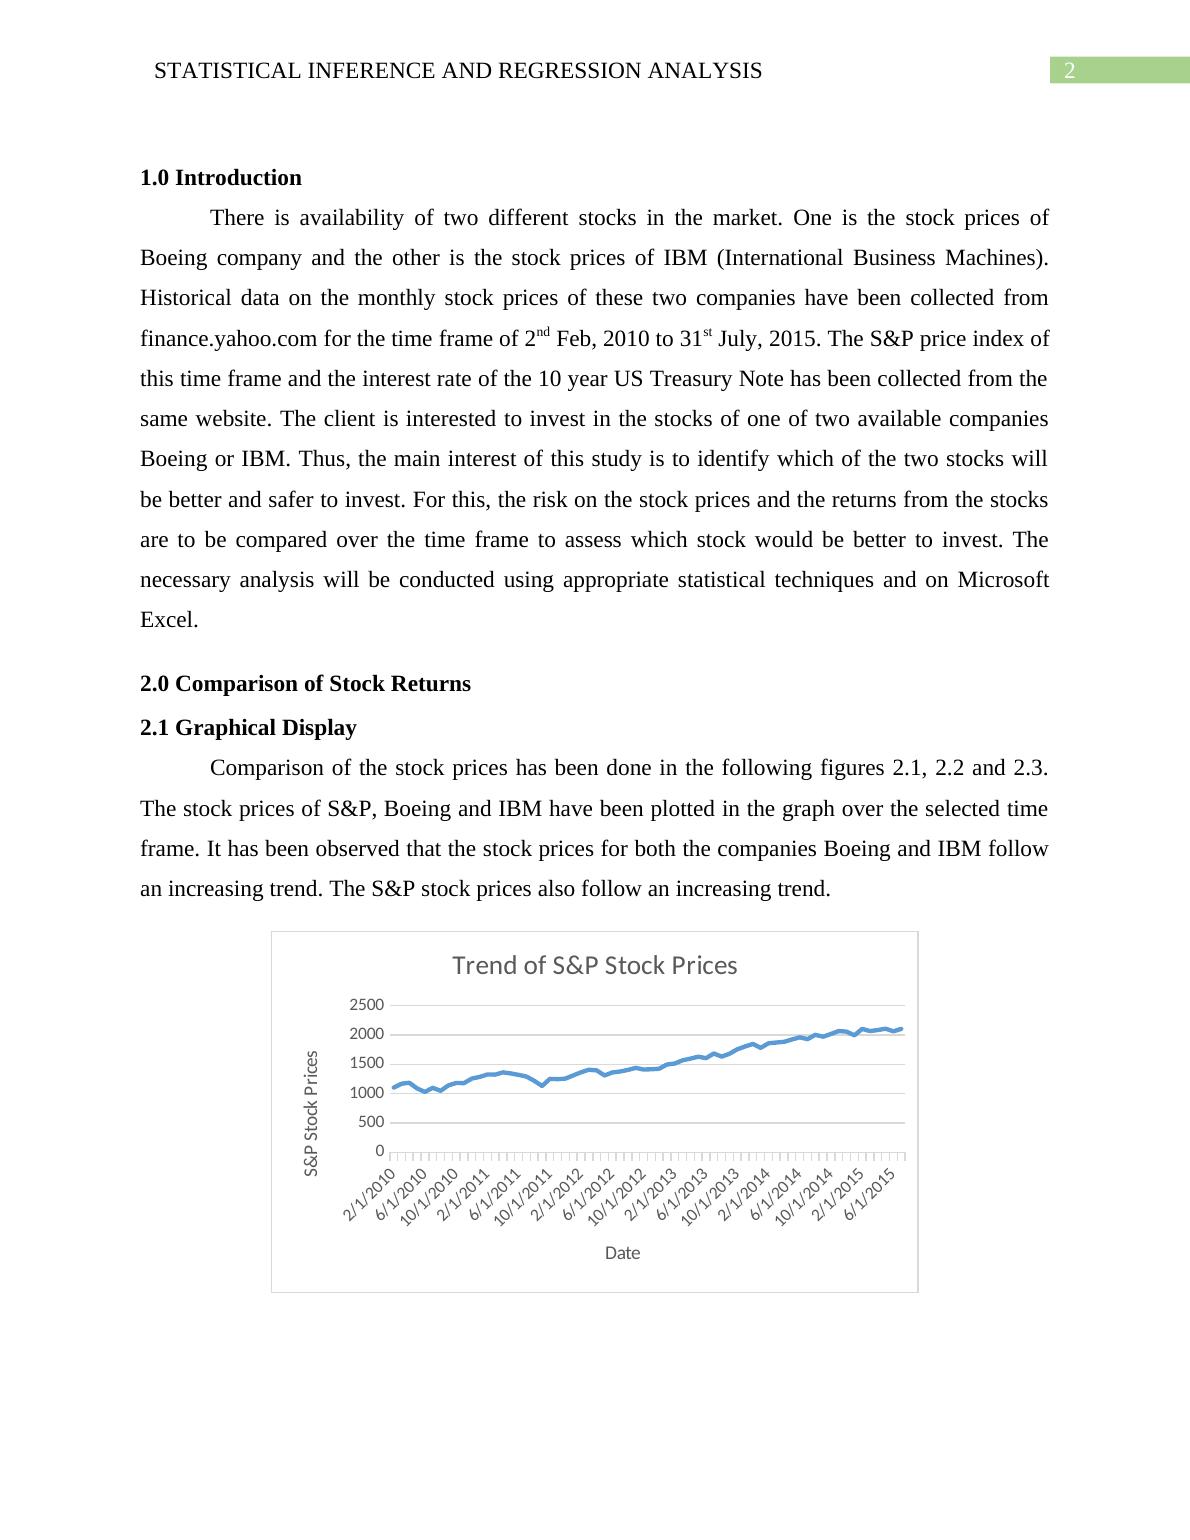
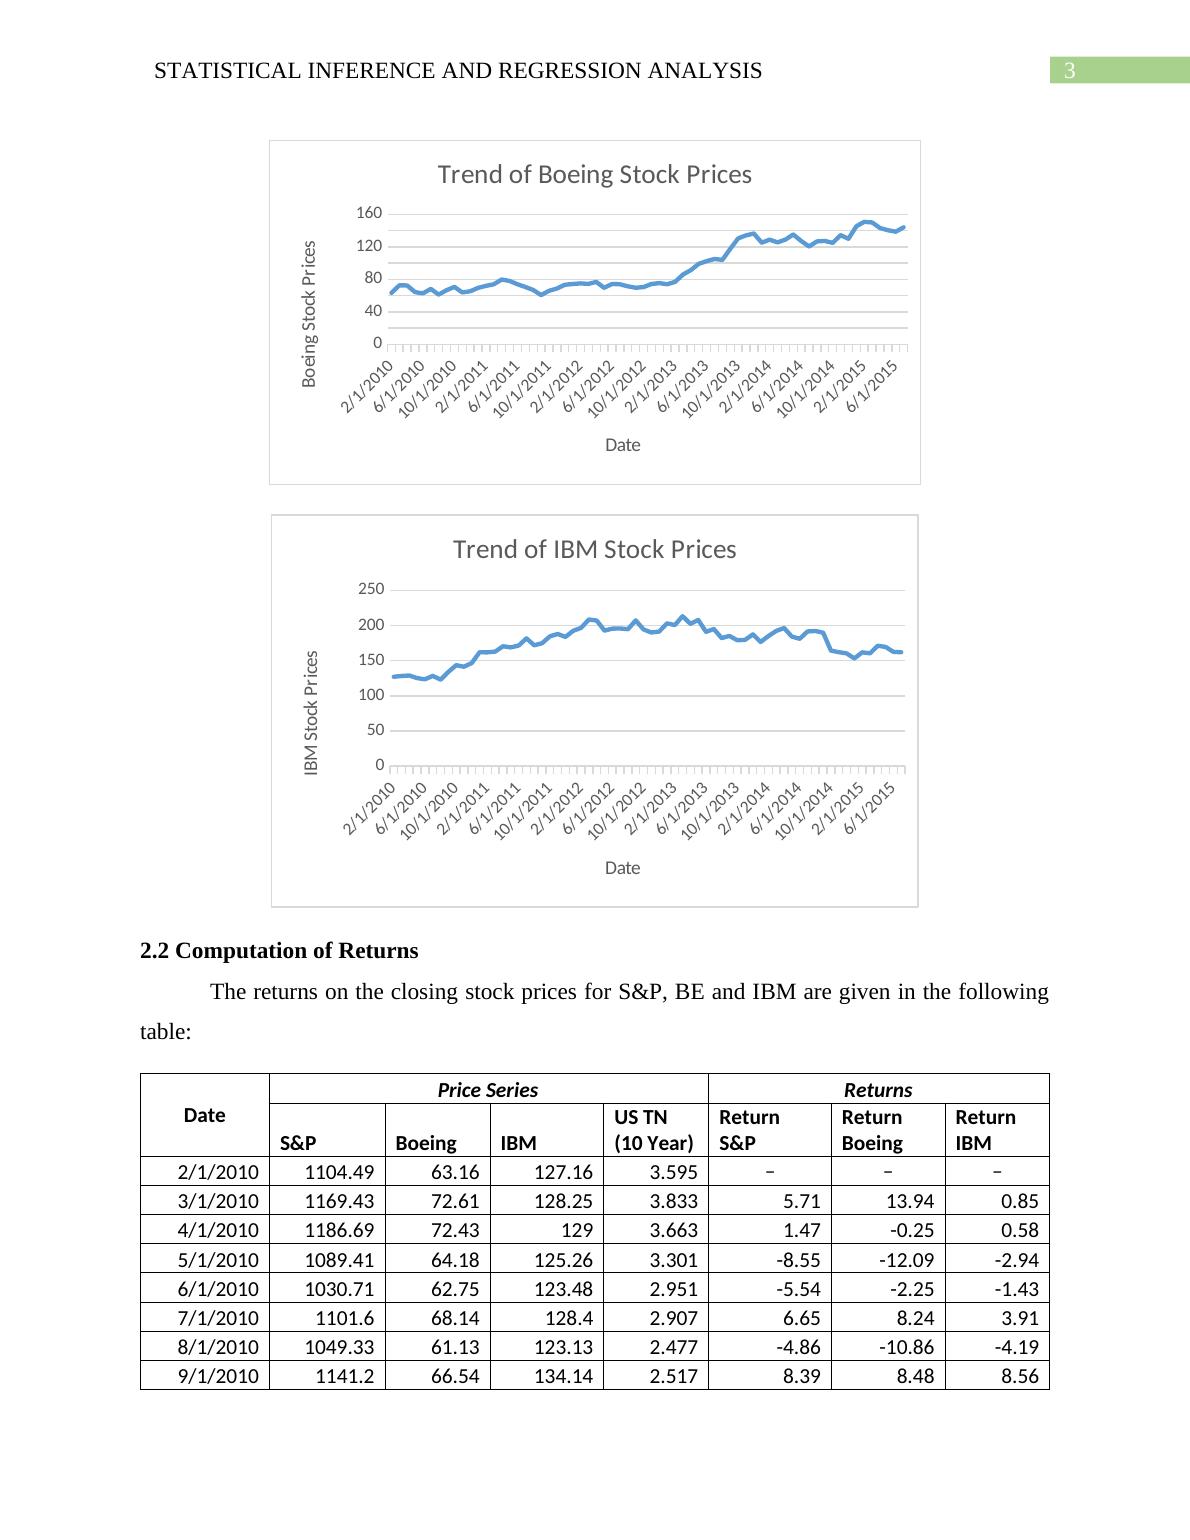
STATISTICAL INFERENCE AND REGRESSION ANALYSIS21.0 IntroductionThere is availability of two different stocks in the market. One is the stock prices ofBoeing company and the other is the stock prices of IBM (International Business Machines).Historical data on the monthly stock prices of these two companies have been collected fromfinance.yahoo.com for the time frame of 2nd Feb, 2010 to 31st July, 2015. The S&P price index ofthis time frame and the interest rate of the 10 year US Treasury Note has been collected from thesame website. The client is interested to invest in the stocks of one of two available companiesBoeing or IBM. Thus, the main interest of this study is to identify which of the two stocks willbe better and safer to invest. For this, the risk on the stock prices and the returns from the stocksare to be compared over the time frame to assess which stock would be better to invest. Thenecessary analysis will be conducted using appropriate statistical techniques and on MicrosoftExcel.2.0 Comparison of Stock Returns2.1 Graphical DisplayComparison of the stock prices has been done in the following figures 2.1, 2.2 and 2.3.The stock prices of S&P, Boeing and IBM have been plotted in the graph over the selected timeframe. It has been observed that the stock prices for both the companies Boeing and IBM followan increasing trend. The S&P stock prices also follow an increasing trend. 2/1/20106/1/201010/1/20102/1/20116/1/201110/1/20112/1/20126/1/201210/1/20122/1/20136/1/201310/1/20132/1/20146/1/201410/1/20142/1/20156/1/201505001000150020002500Trend of S&P Stock PricesDateS&PStockPrices
STATISTICAL INFERENCE AND REGRESSION ANALYSIS32/1/20106/1/201010/1/20102/1/20116/1/201110/1/20112/1/20126/1/201210/1/20122/1/20136/1/201310/1/20132/1/20146/1/201410/1/20142/1/20156/1/201504080120160Trend of Boeing Stock PricesDateBoeingStockPrices2/1/20106/1/201010/1/20102/1/20116/1/201110/1/20112/1/20126/1/201210/1/20122/1/20136/1/201310/1/20132/1/20146/1/201410/1/20142/1/20156/1/2015050100150200250Trend of IBM Stock PricesDateIBMStockPrices2.2 Computation of ReturnsThe returns on the closing stock prices for S&P, BE and IBM are given in the followingtable:DatePrice SeriesReturnsS&PBoeingIBMUS TN (10 Year)Return S&PReturn BoeingReturn IBM2/1/20101104.4963.16127.163.595– ––3/1/20101169.4372.61128.253.8335.7113.940.854/1/20101186.6972.431293.6631.47-0.250.585/1/20101089.4164.18125.263.301-8.55-12.09-2.946/1/20101030.7162.75123.482.951-5.54-2.25-1.437/1/20101101.668.14128.42.9076.658.243.918/1/20101049.3361.13123.132.477-4.86-10.86-4.199/1/20101141.266.54134.142.5178.398.488.56
End of preview
Want to access all the pages? Upload your documents or become a member.
Related Documents
Business and Finance Statistics for Business and Financelg...
|13
|3814
|251
Statistical Inference & Regression PDFlg...
|9
|2780
|61
Report On Analysis Of Stockslg...
|13
|1932
|52
Statistics Assignment | Stock Valuationlg...
|17
|2377
|69
Stock Returns: Boeing & IBM Analysis Reportlg...
|14
|2616
|155
STATISTICS FOR FINANCE AND BUSINESS Statistics for Finance and Business Name of the University Authorlg...
|11
|1628
|389