Fuel Price Statistical Analysis Project Part C: MAT10251 Data
VerifiedAdded on 2023/06/03
|15
|2521
|395
Project
AI Summary
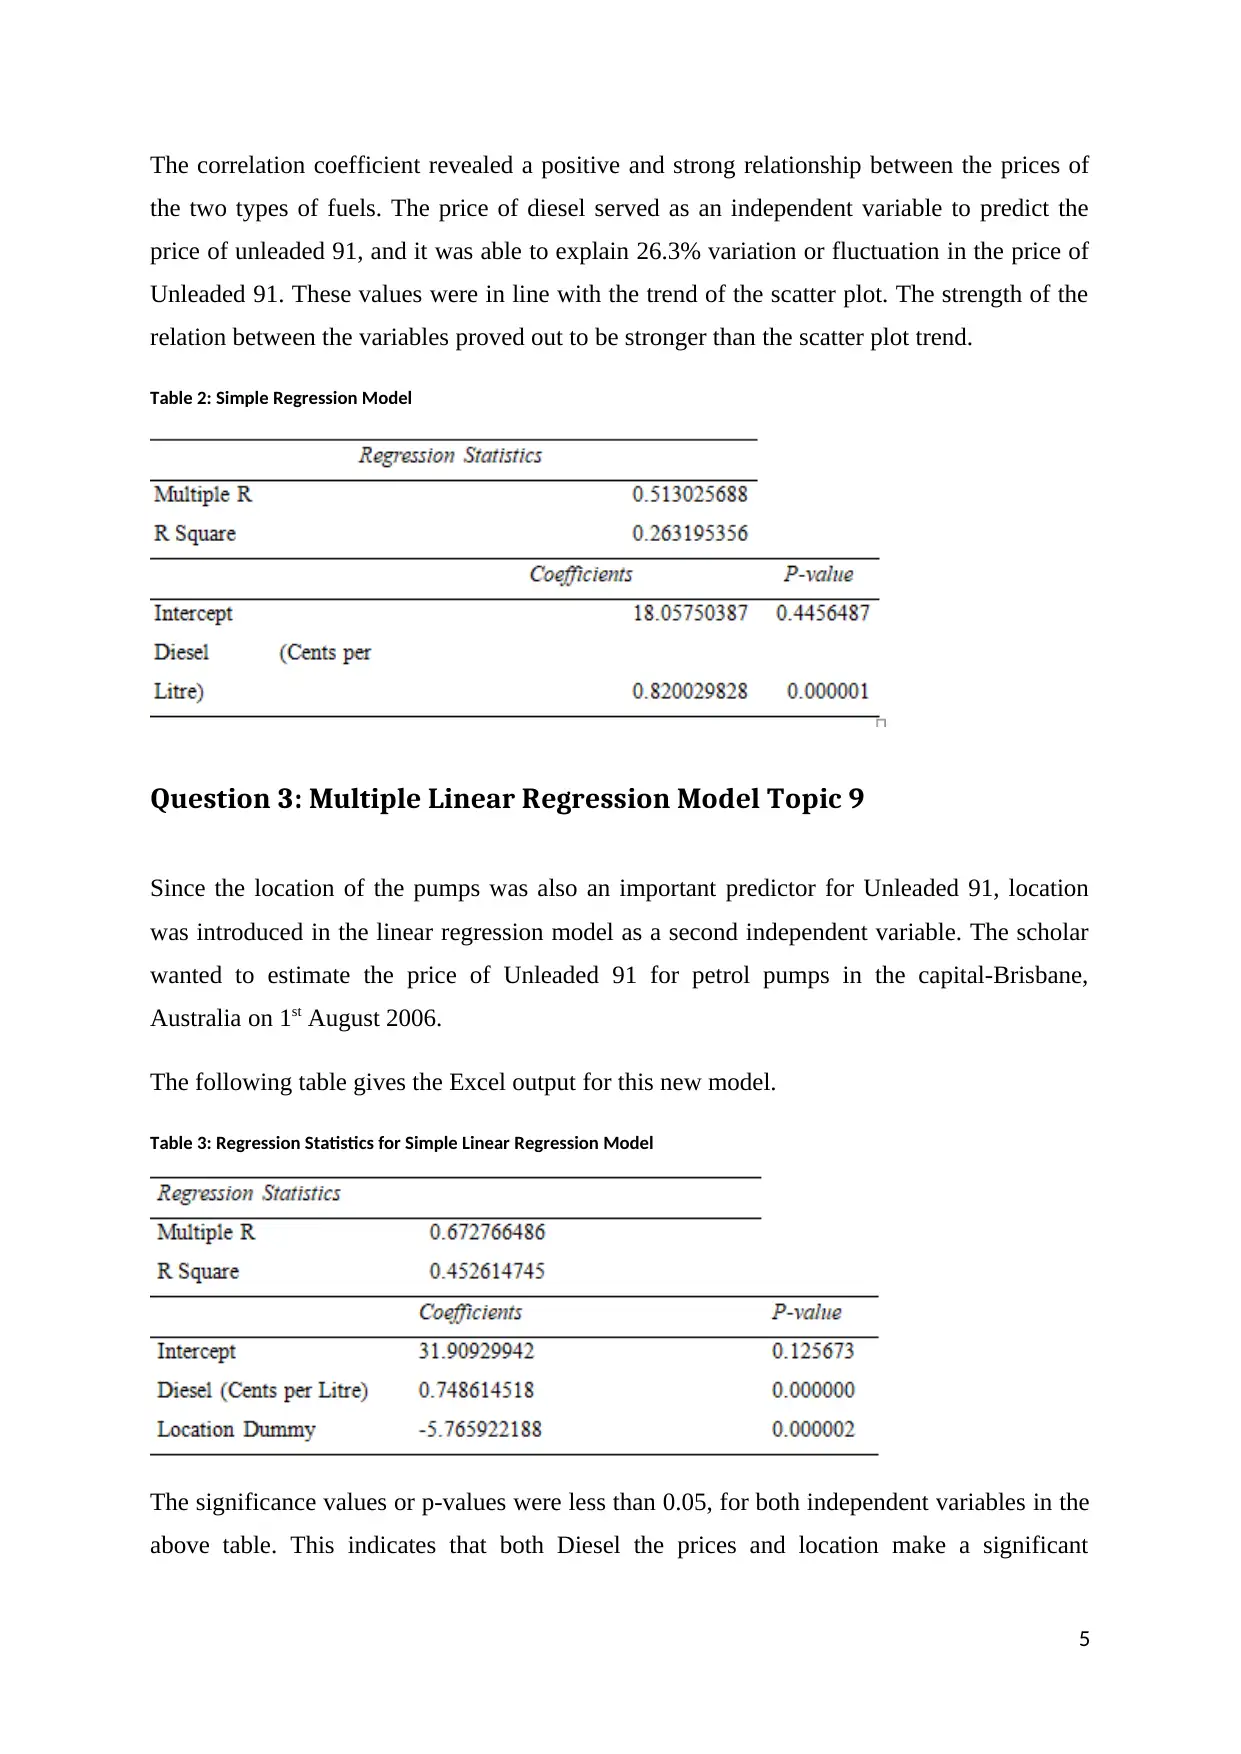
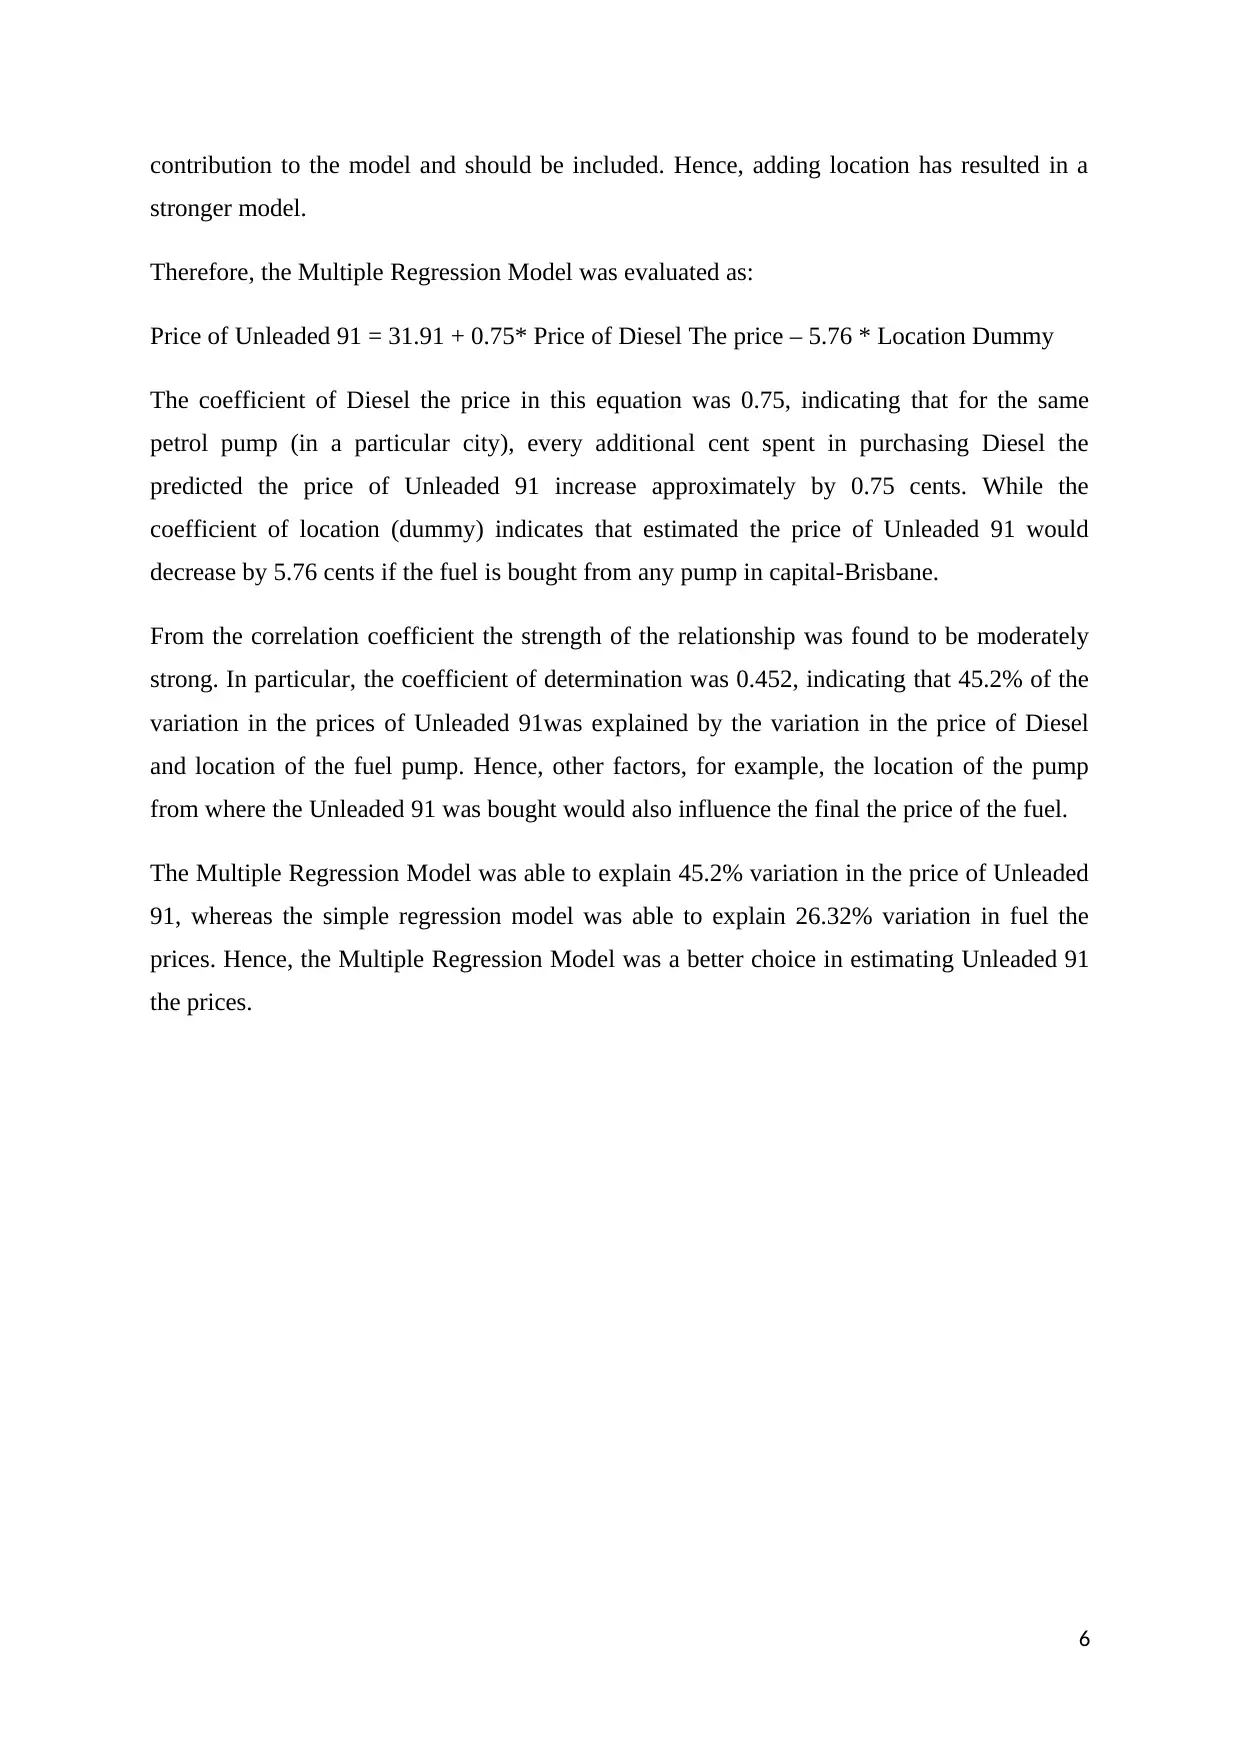
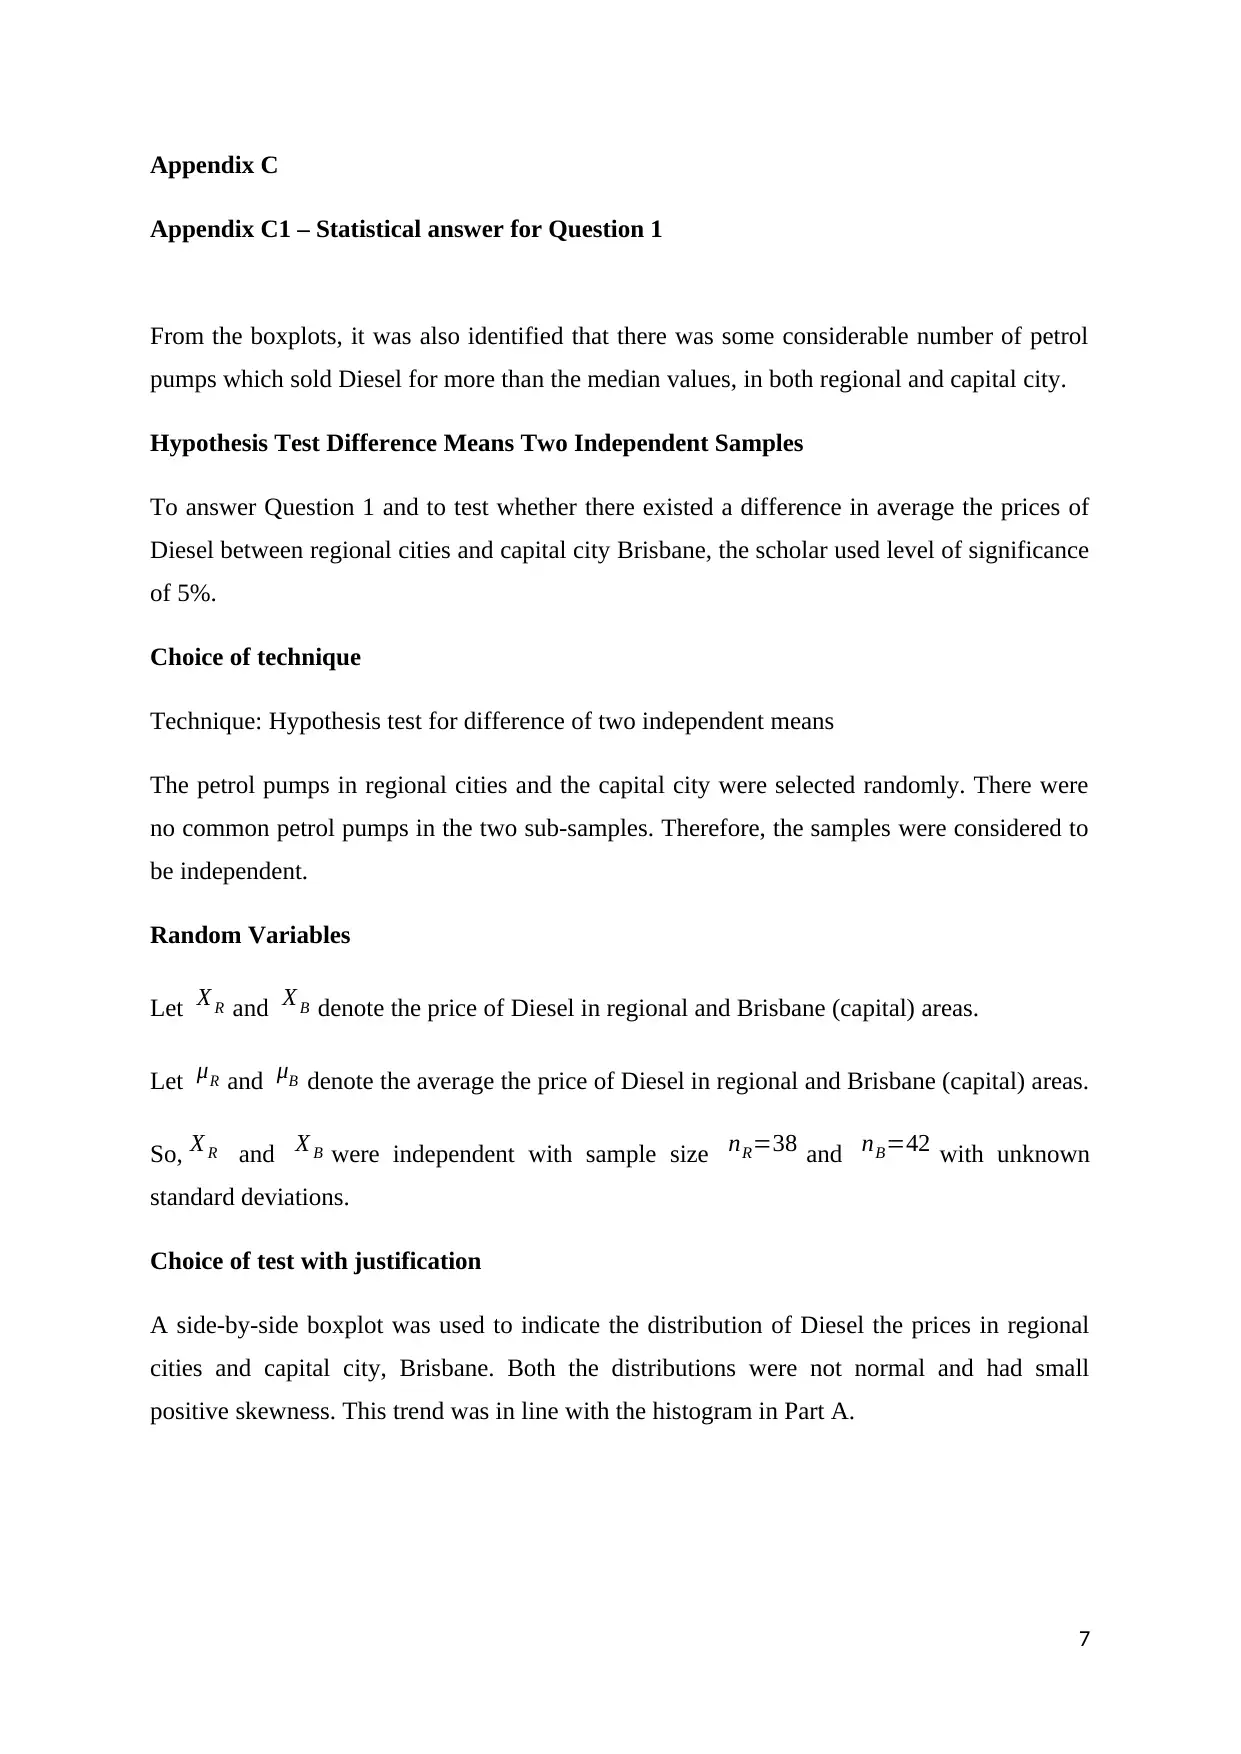
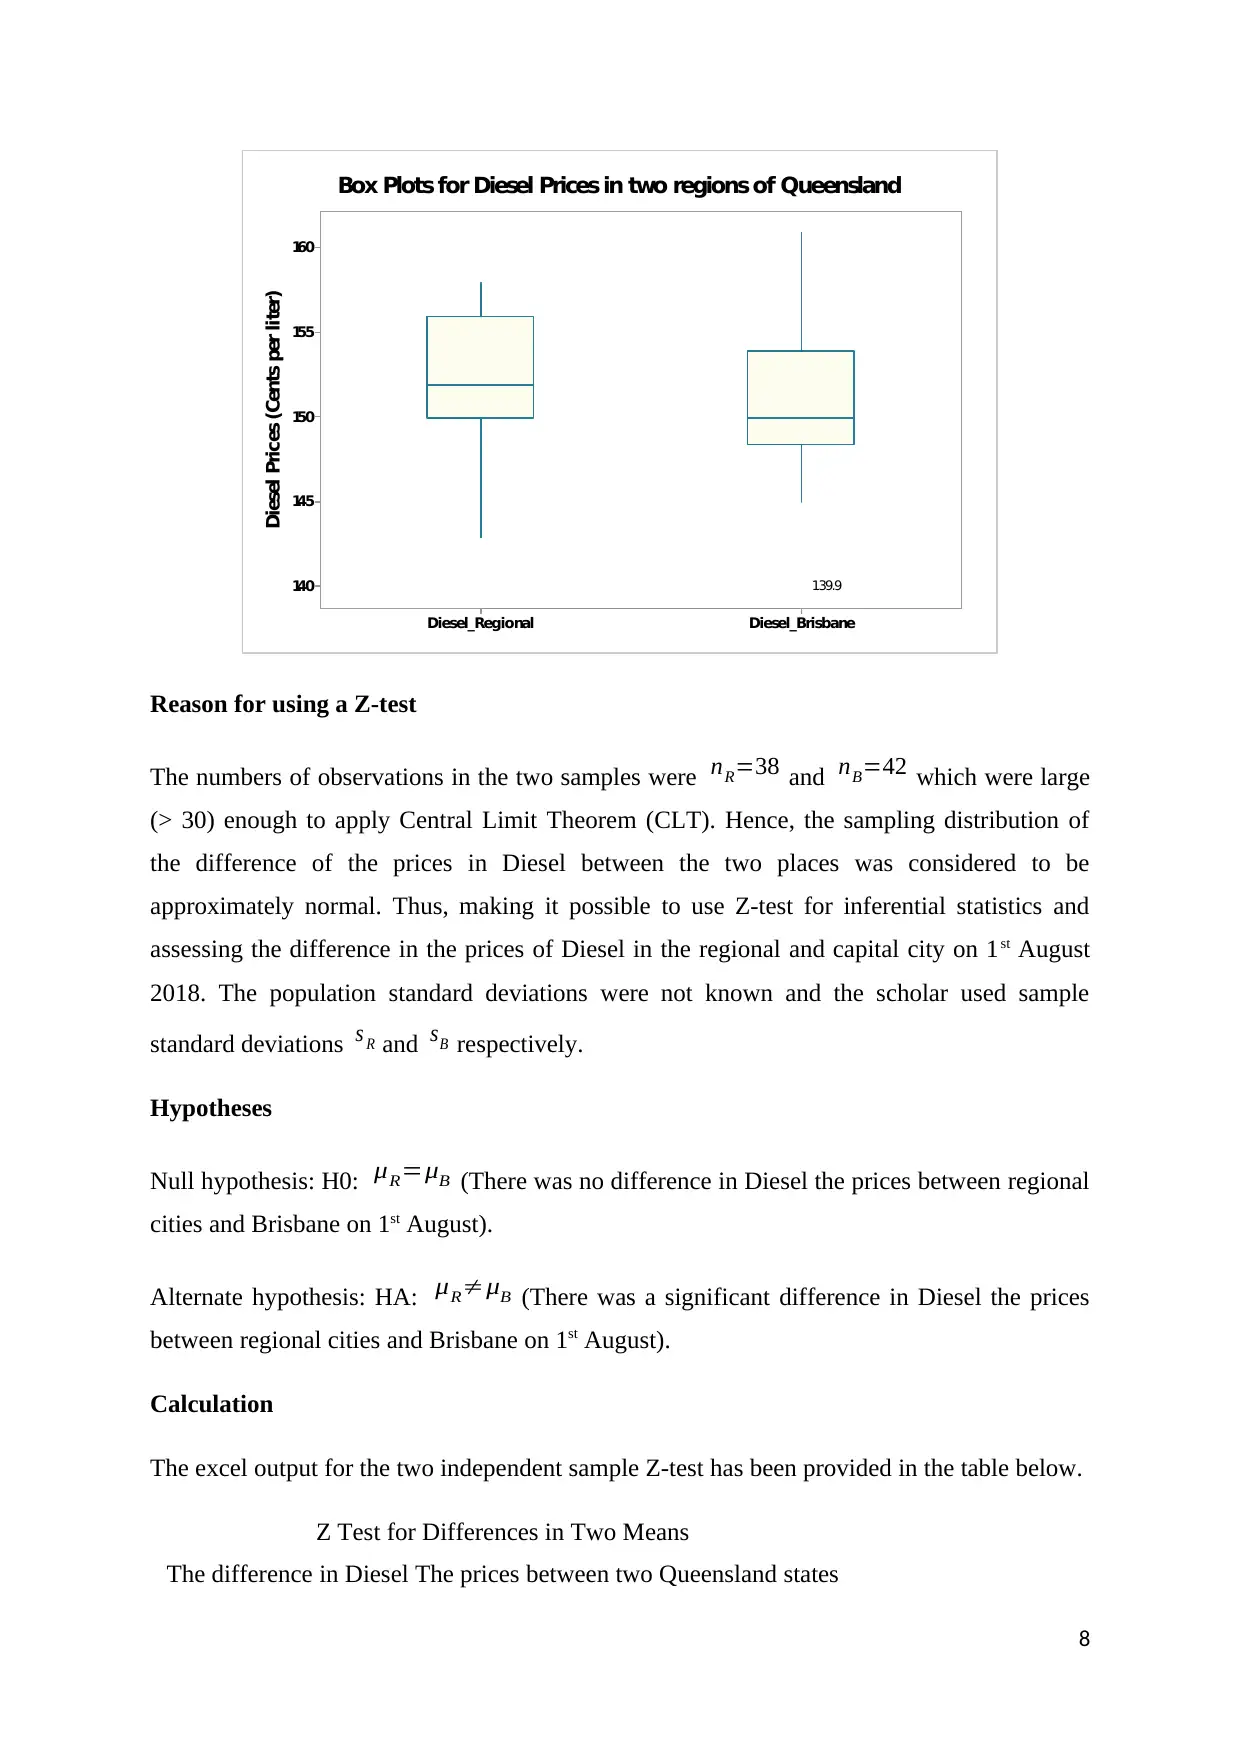
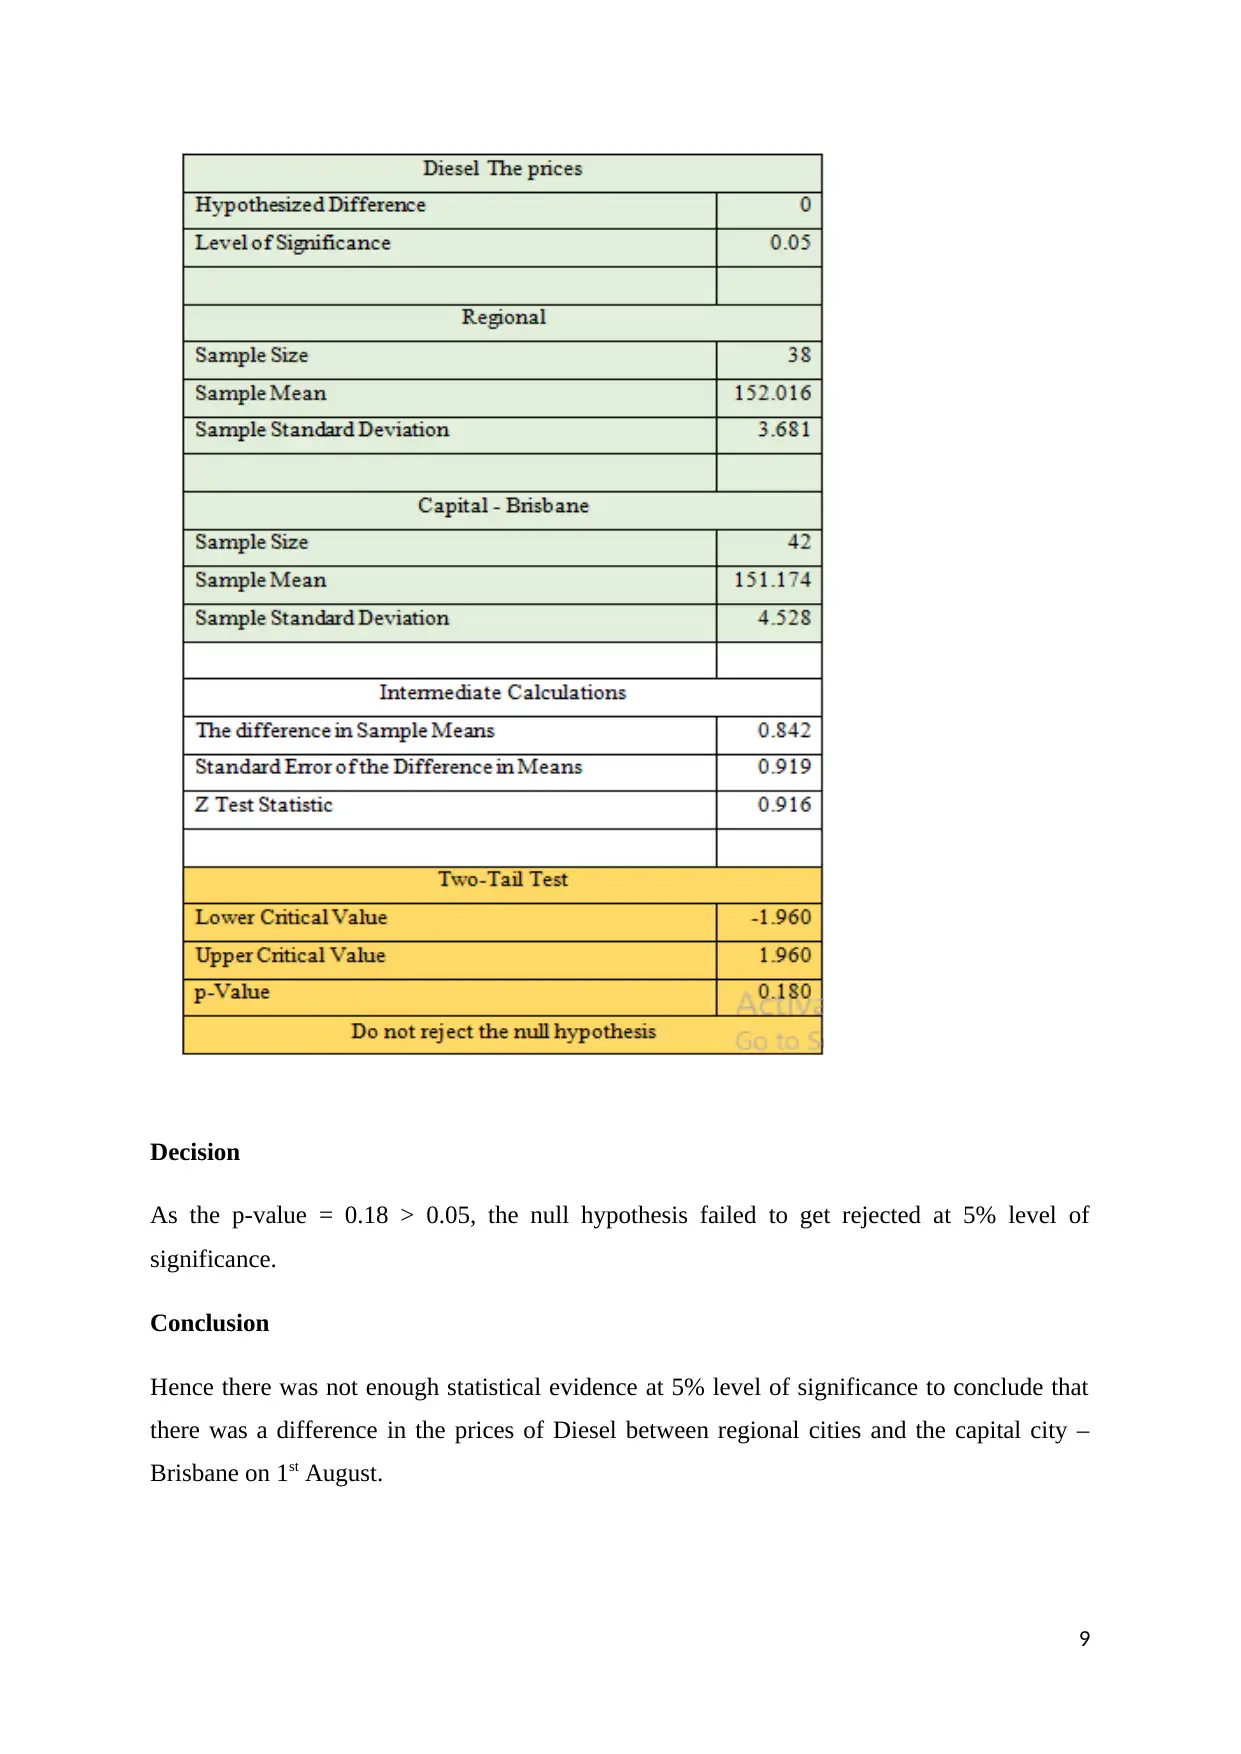
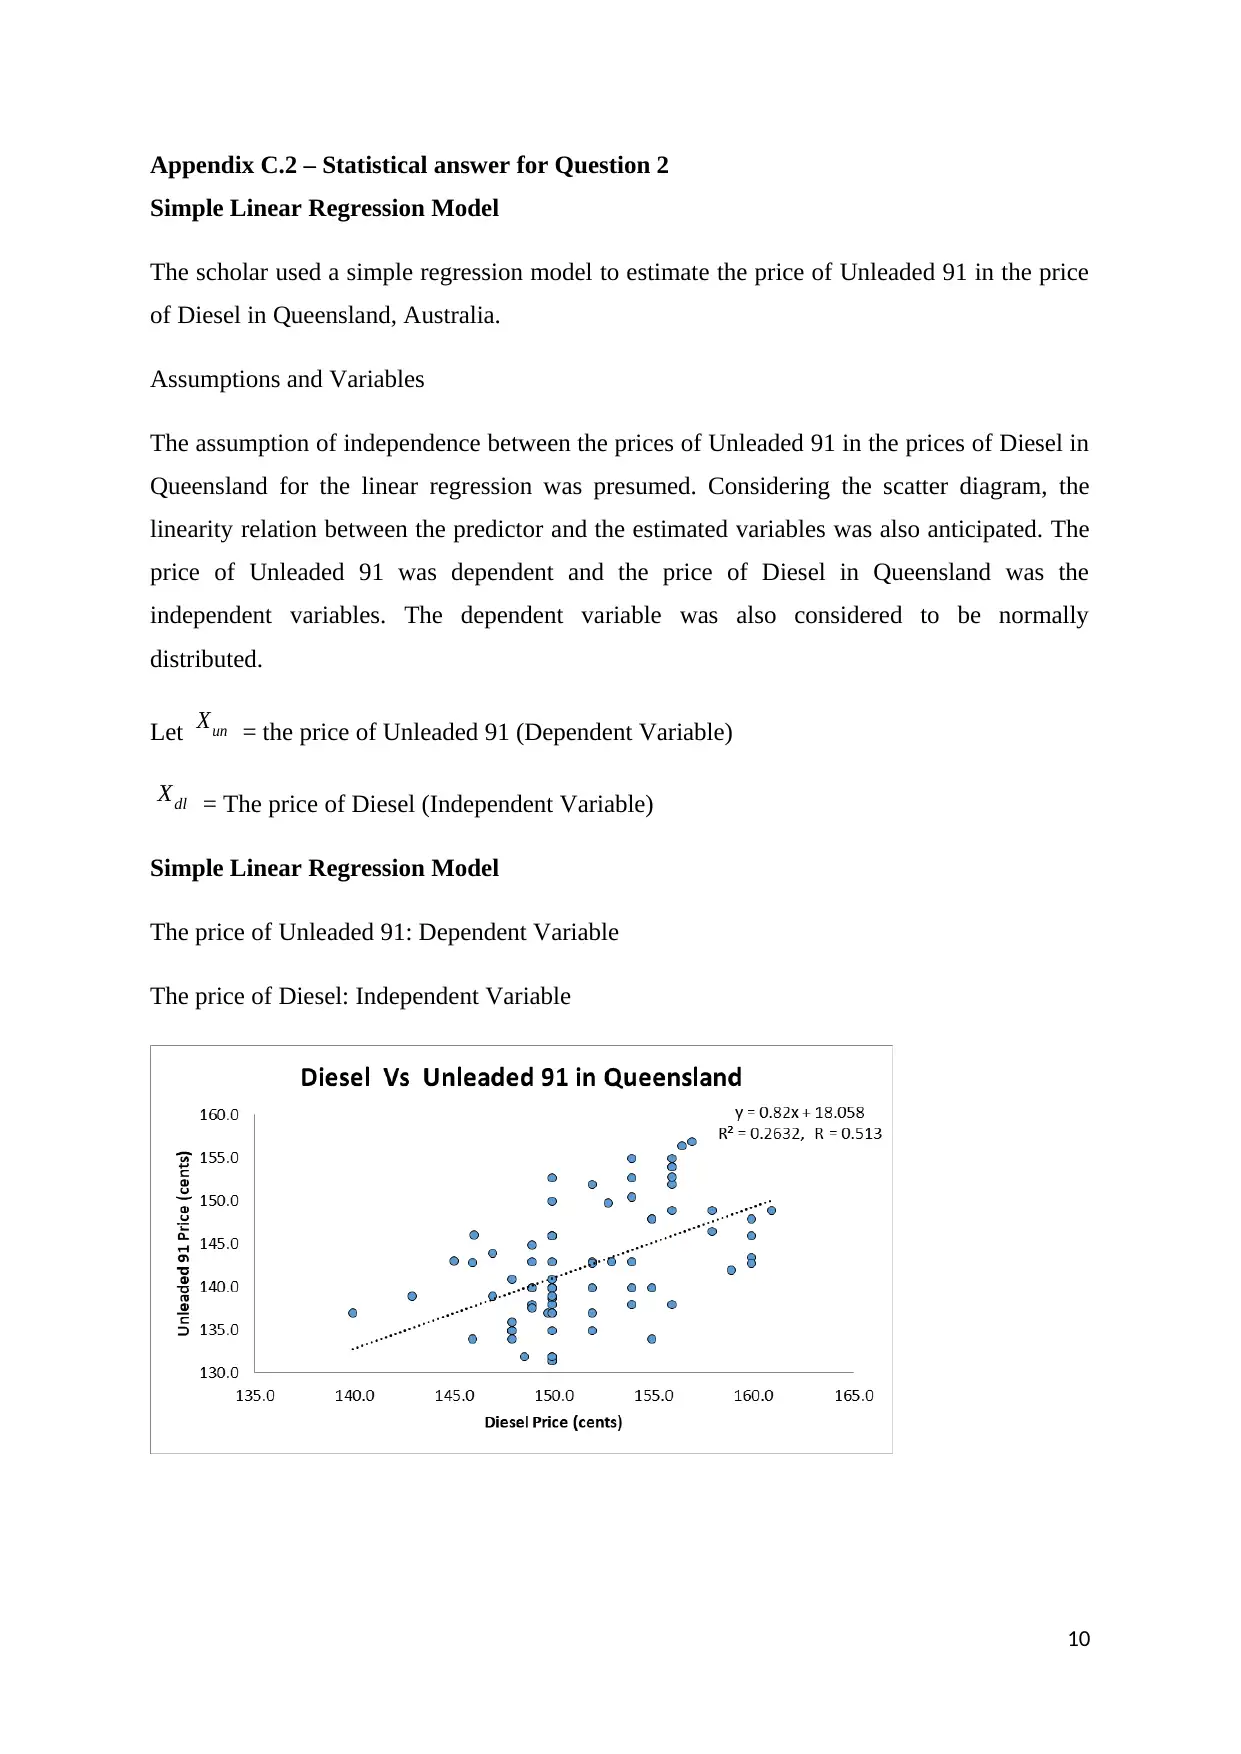
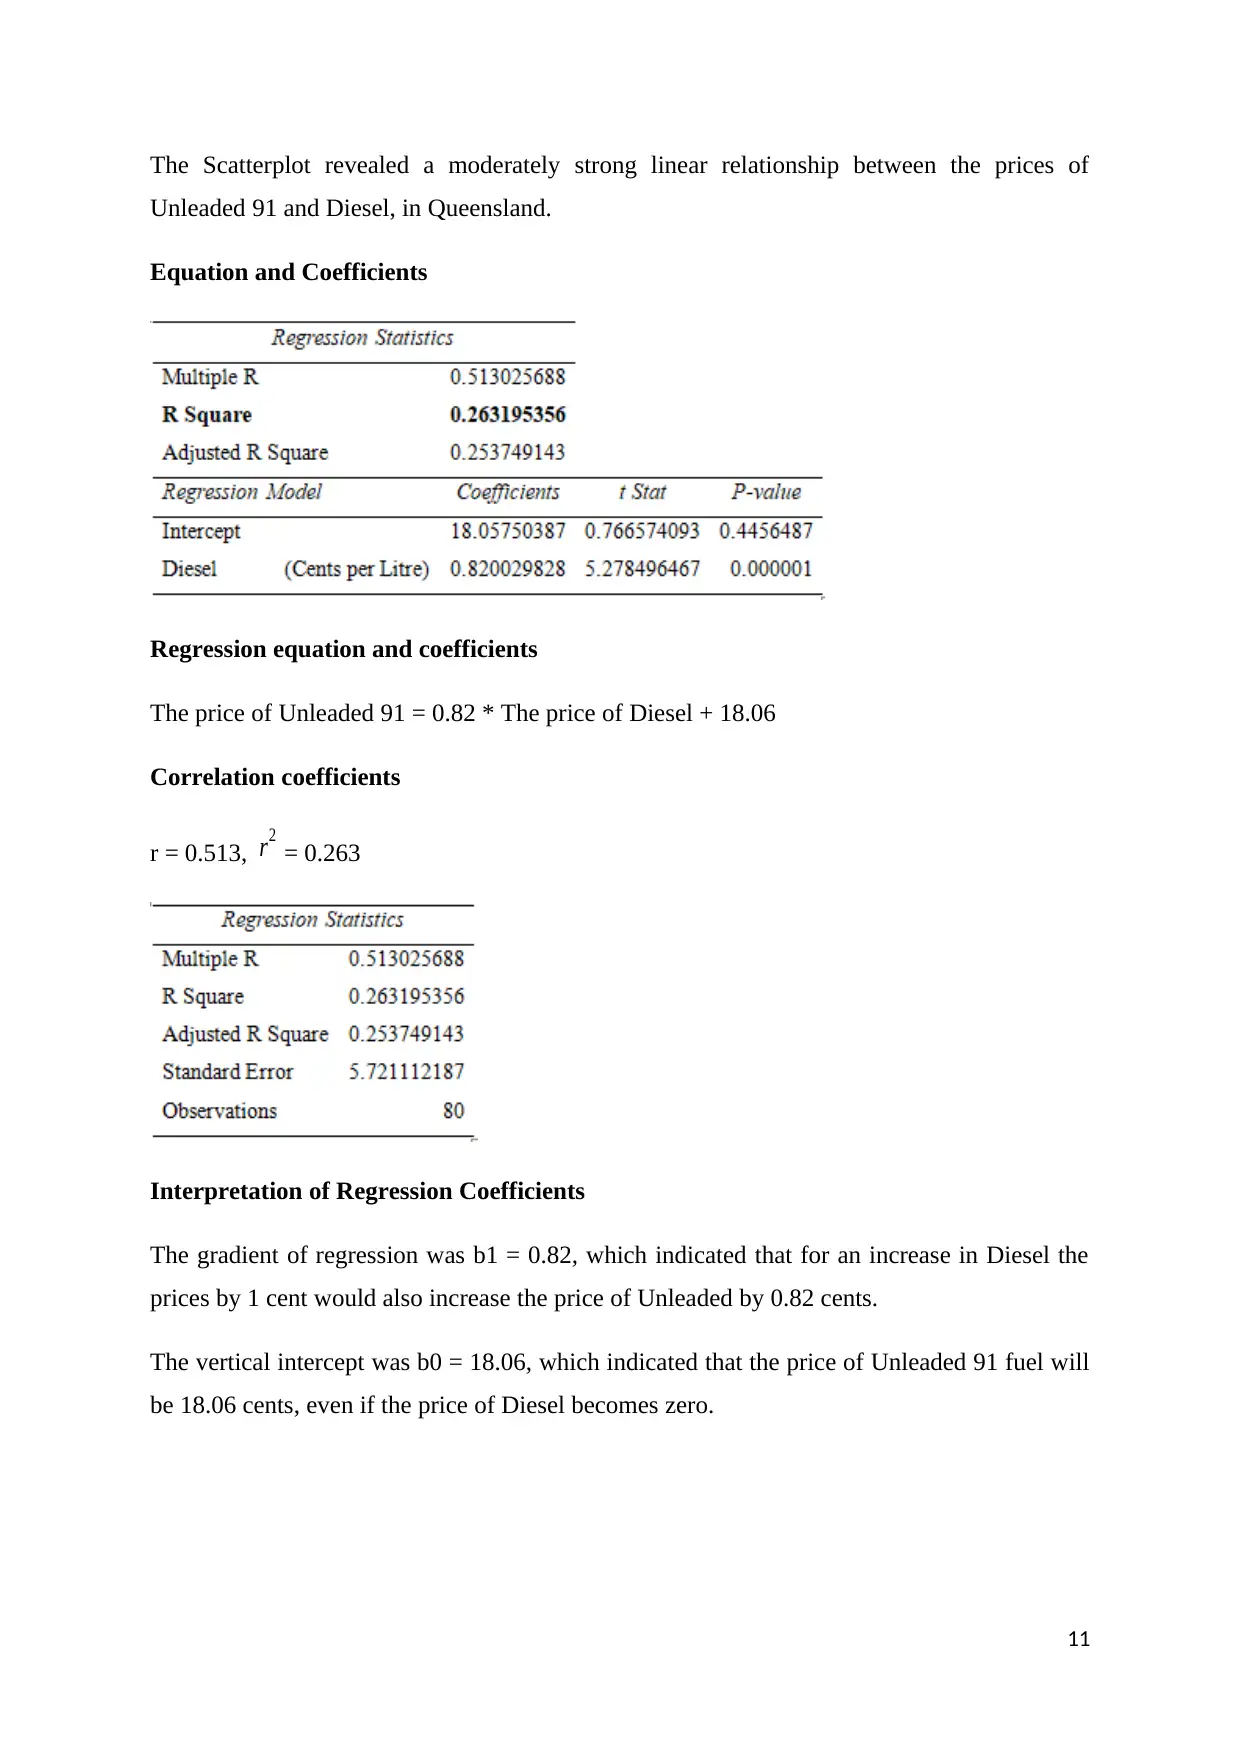
This assignment presents a statistical analysis of fuel price data, focusing on diesel and unleaded 91 prices in Queensland, Australia. It includes a hypothesis test to determine if there's a significant difference in diesel prices between regional cities and Brisbane, using a Z-test. Simple linear regression is employed to explore the relationship between unleaded 91 and diesel prices, with diesel price as the independent variable. Further, a multiple linear regression model incorporates location as a second independent variable to predict unleaded 91 prices, demonstrating an improved model fit compared to the simple linear regression. Appendices provide detailed statistical answers and justifications for the methods used, including assumptions, variable definitions, and interpretations of regression coefficients and correlation coefficients.
1 out of 15
Related Documents


Your All-in-One AI-Powered Toolkit for Academic Success.
+13062052269
info@desklib.com
Available 24*7 on WhatsApp / Email
![[object Object]](/_next/static/media/star-bottom.7253800d.svg)
Copyright © 2020–2026 A2Z Services. All Rights Reserved. Developed and managed by ZUCOL.