Statistical Analysis of Gender Earnings Using Stata and T-test
VerifiedAdded on 2022/12/29
|9
|939
|74
Report
AI Summary
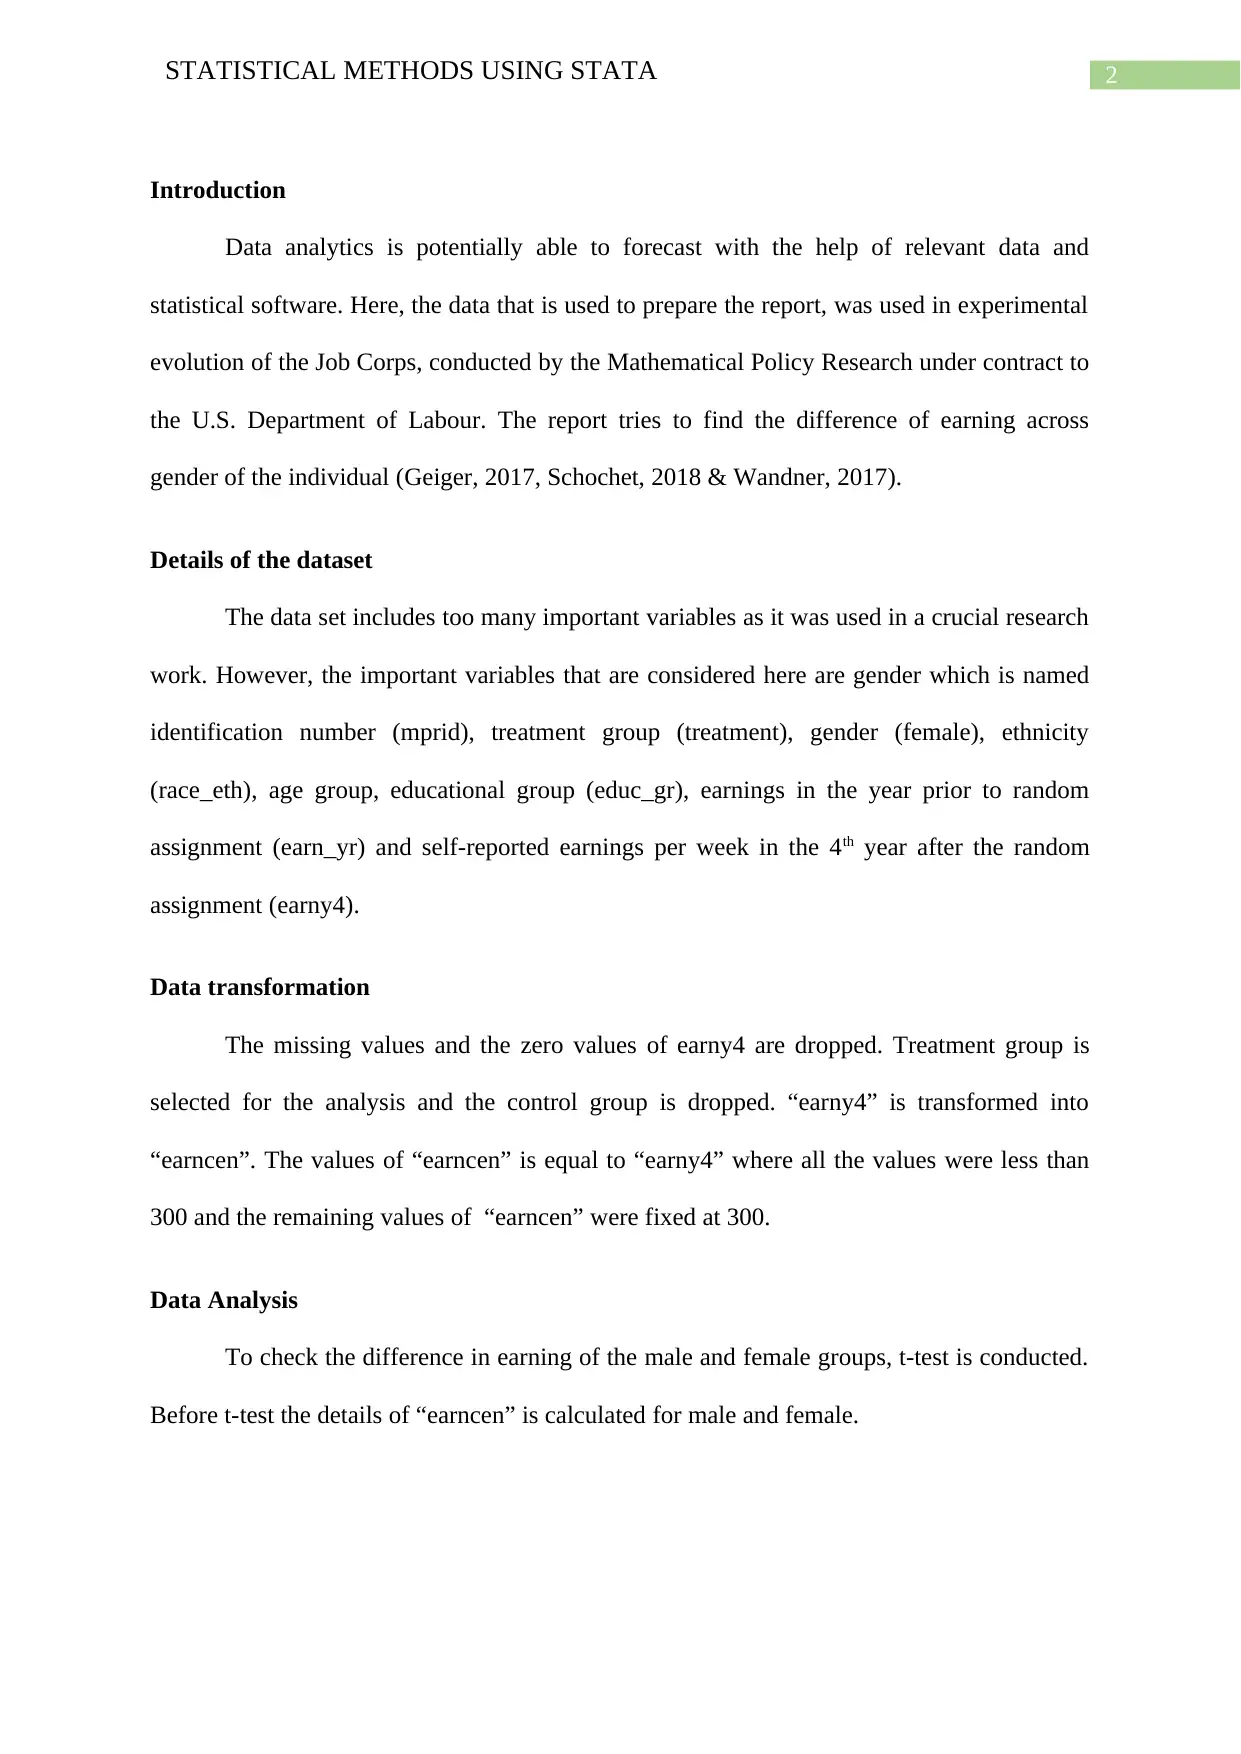
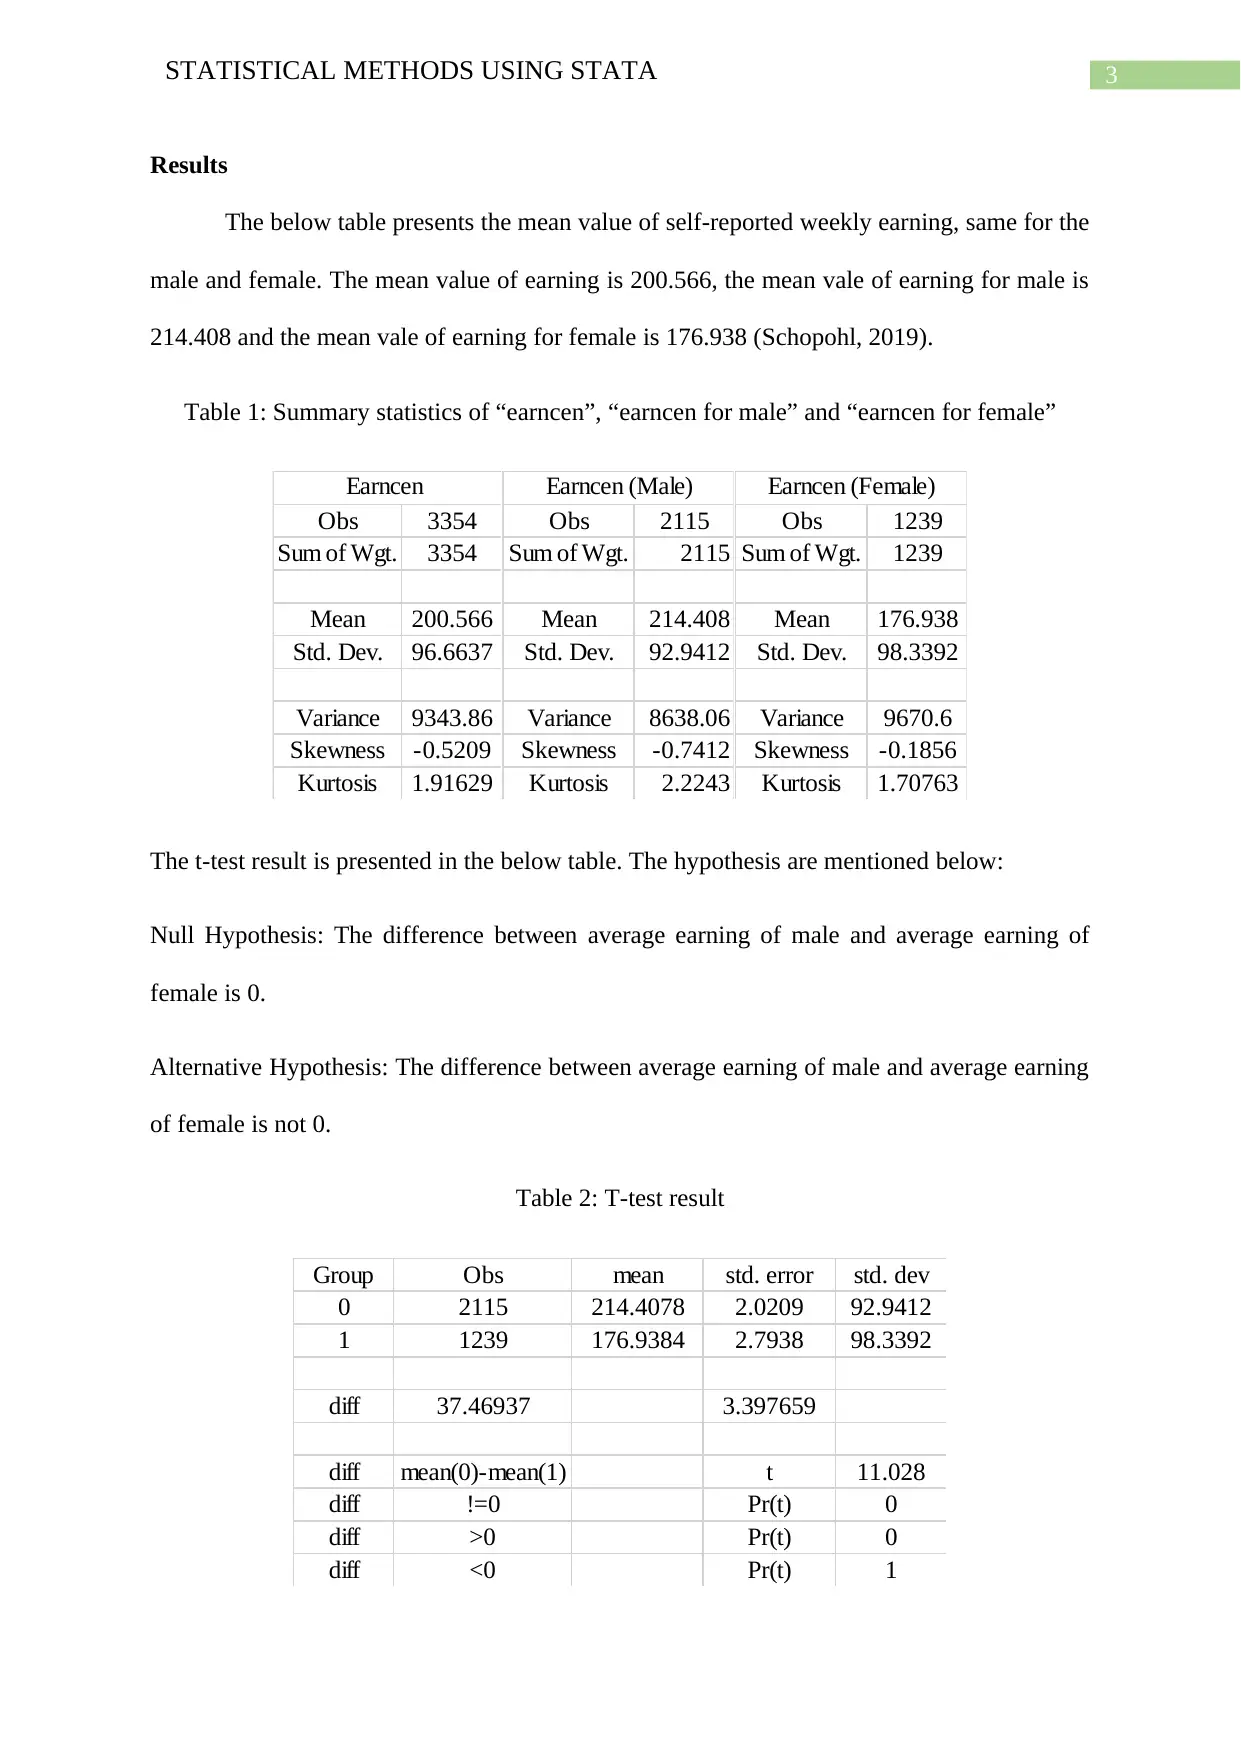
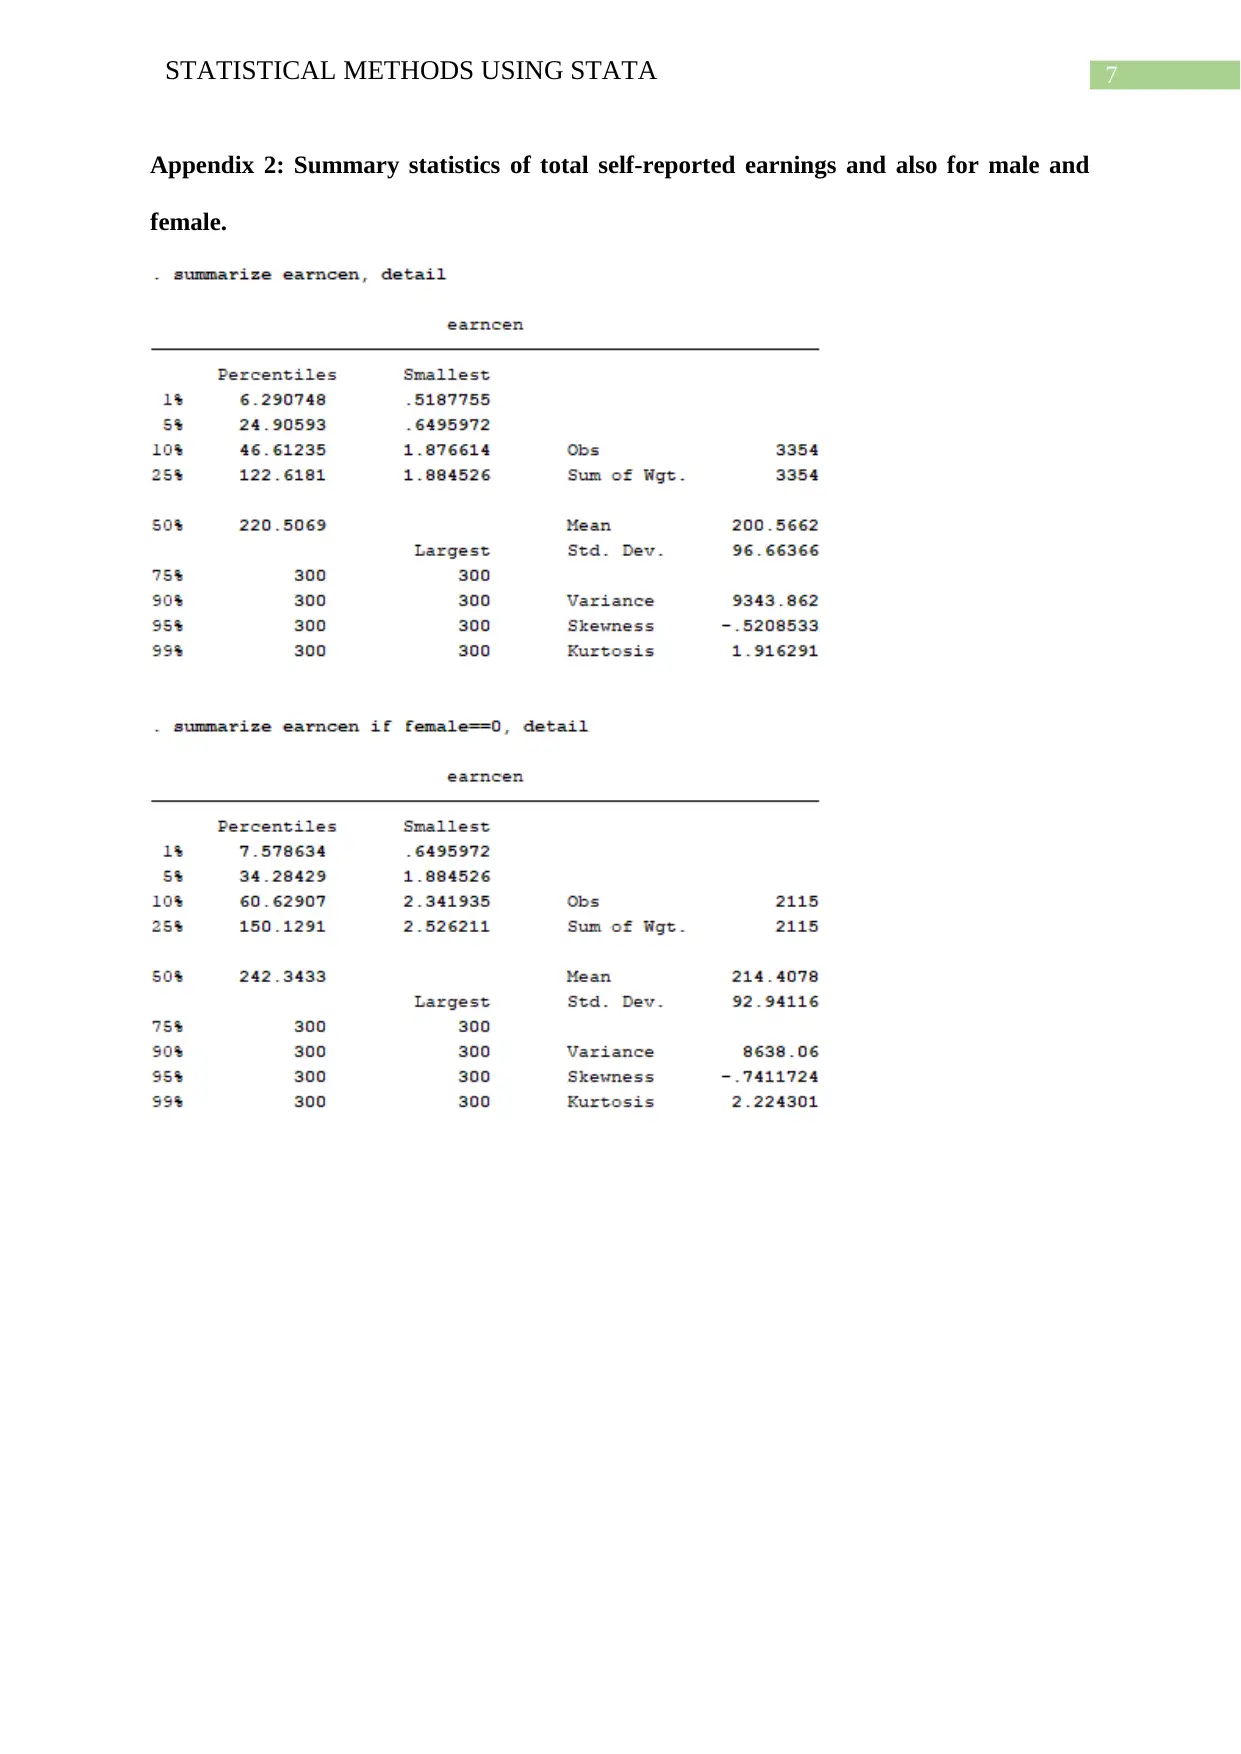
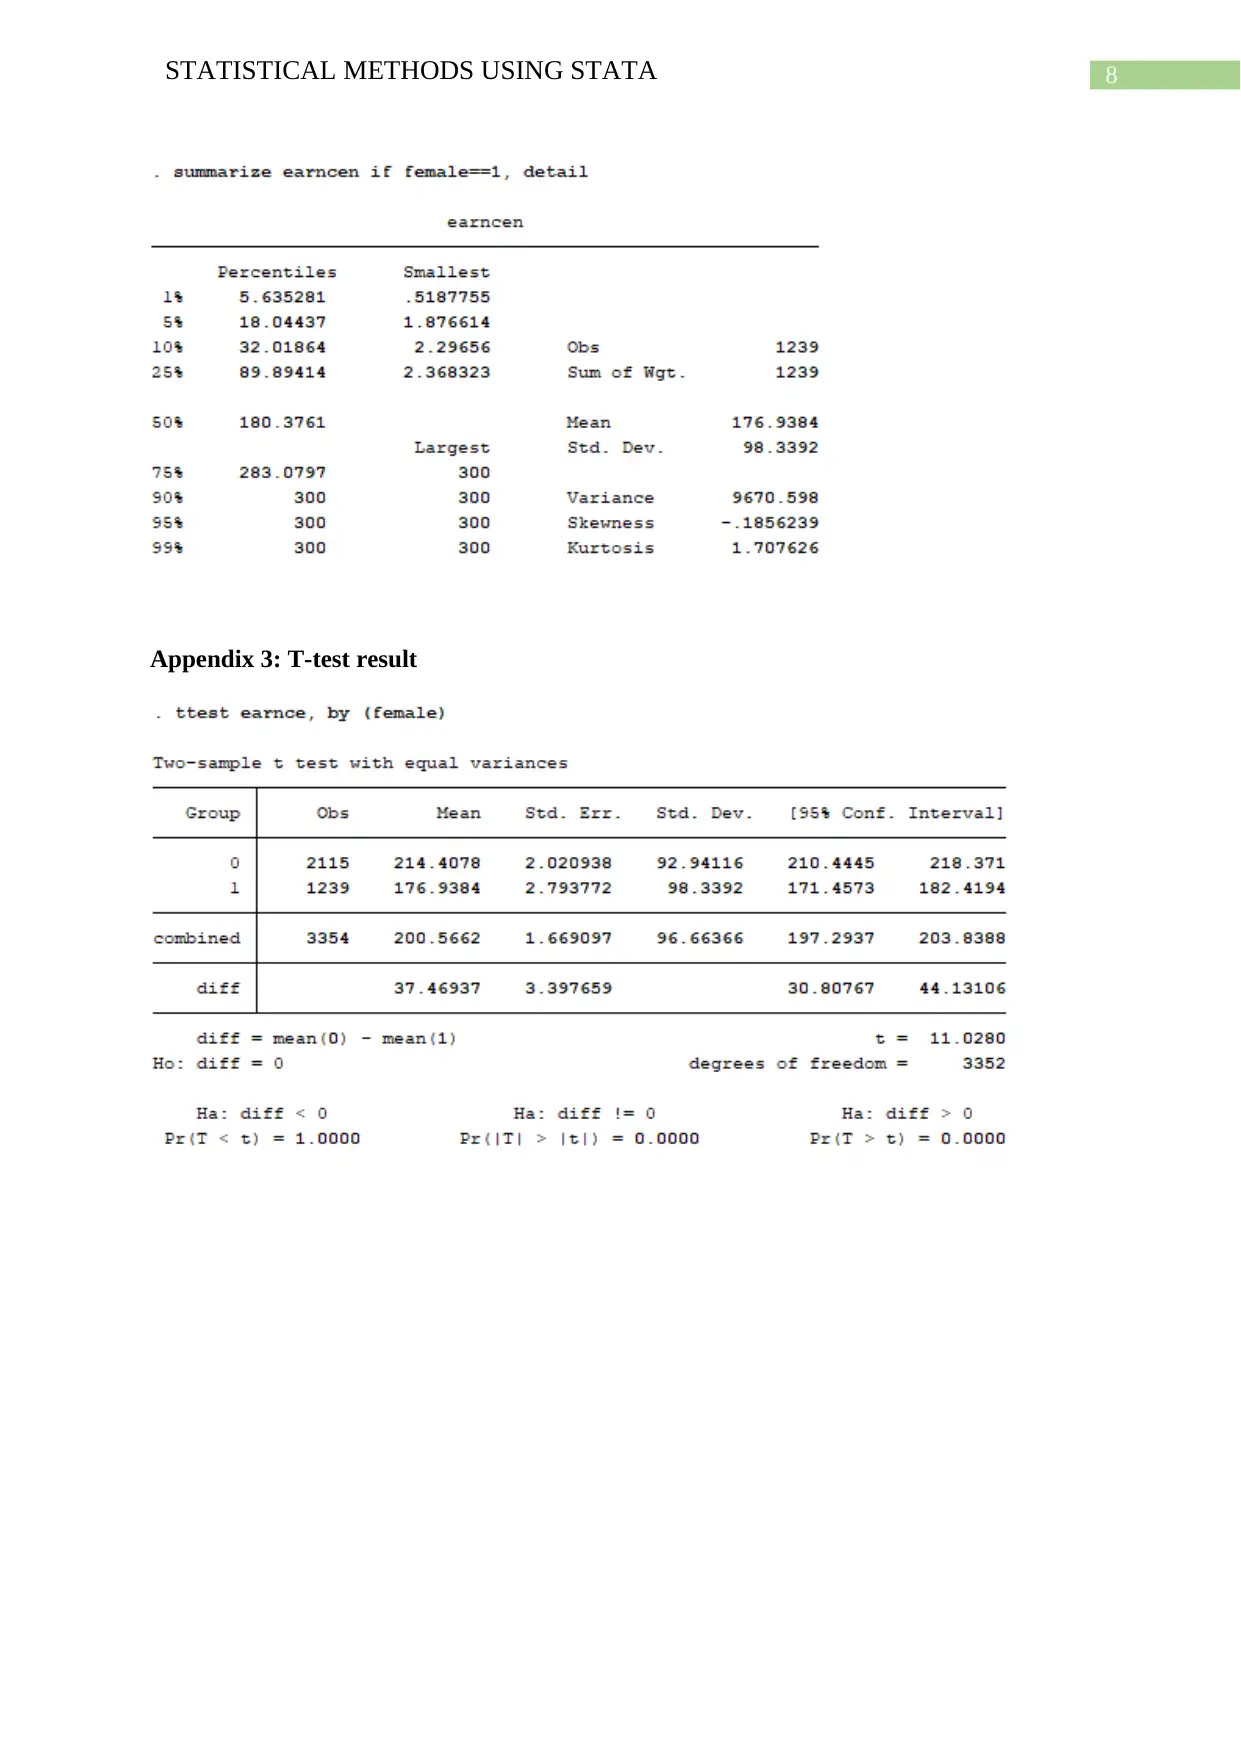
This report presents a statistical analysis of gender-based earnings using the Stata software. The study utilizes data from the Job Corps experimental evolution project, focusing on variables such as gender, treatment group, ethnicity, and earnings. The analysis begins with data transformation, addressing missing and zero values, and creating a new variable named 'earncen'. A t-test is conducted to compare the earnings between male and female groups. The results reveal a significant difference in earnings, with males earning more than females. The t-test yielded a t-statistic of 11.028 and a p-value of 0, leading to the rejection of the null hypothesis. The report concludes that there is a statistically significant difference in earnings between genders, supported by the Stata analysis and t-test results.
1 out of 9
Related Documents


Your All-in-One AI-Powered Toolkit for Academic Success.
+13062052269
info@desklib.com
Available 24*7 on WhatsApp / Email
![[object Object]](/_next/static/media/star-bottom.7253800d.svg)
Copyright © 2020–2026 A2Z Services. All Rights Reserved. Developed and managed by ZUCOL.