Statistical Modelling Report: Analysis of Gender Pay Gap in Australia
VerifiedAdded on 2021/06/16
|11
|2197
|61
Report
AI Summary
This report presents a statistical analysis of the gender pay gap in Australia, utilizing two datasets to investigate salary differences between genders. The study employs descriptive statistics, including column charts and tables, to illustrate the distribution of genders across different occupations and income levels, revealing significant disparities. Inferential statistics, such as confidence intervals and hypothesis testing (z-tests and t-tests), are used to assess the statistical significance of the gender pay gap and the representation of females in specific occupations. The findings from Dataset 1 support the existence of a gender pay gap, while Dataset 2 does not. The report concludes by emphasizing the need for further research to explore the underlying reasons for these disparities and recommends a more detailed investigation into the factors contributing to the gender pay gap across various occupations, especially focusing on occupations with low female representation.

STATISTICAL MODELLING
STUDENT ID:
[Pick the date]
STUDENT ID:
[Pick the date]
Paraphrase This Document
Need a fresh take? Get an instant paraphrase of this document with our AI Paraphraser
Section 1: Introduction
a) Gender gap refers to the salary differential between males and females where the females
are at the disadvantaged end since they are paid a lower salary level. This exists despite
the presence of various laws and regulations for ensuring equality between the two
genders. There is evidence to suggest that gender gap also exists in Australia. Continuing
of this gap can potentially have adverse consequences over the longer term since this
would discourage the females from participating in the workforce and thereby lead to
labour shortages (Livsey, 2017). In order to ensure that this problem is resolved, it is
imperative to conduct research on this critical topic and identify the contributory reasons
which are responsible for the same. The objective of the underlying research is to analyse
if it supports the presence of gender gap and the role occupations play in this regards.
b) One dataset which has been provided comprises of information about 1,000 taxpayers as
collected by the ATO and is named Dataset 1. Considering that it contains data collected
by the ATO, hence it would be appropriate to label this as secondary and not primary
(Hilleir, 2016). This dataset has information about four key variables namely gender of
taxpayer (categorical variable), occupation of taxpayer (categorical variable), annual
salary amount (quantitative variable) and deduction of gift amount (quantitative variable).
For the variables labelled as categorical, the measurement scale used is nominal while for
the variables as quantitative, the measurement scale in interval (Flick, 2015). For the
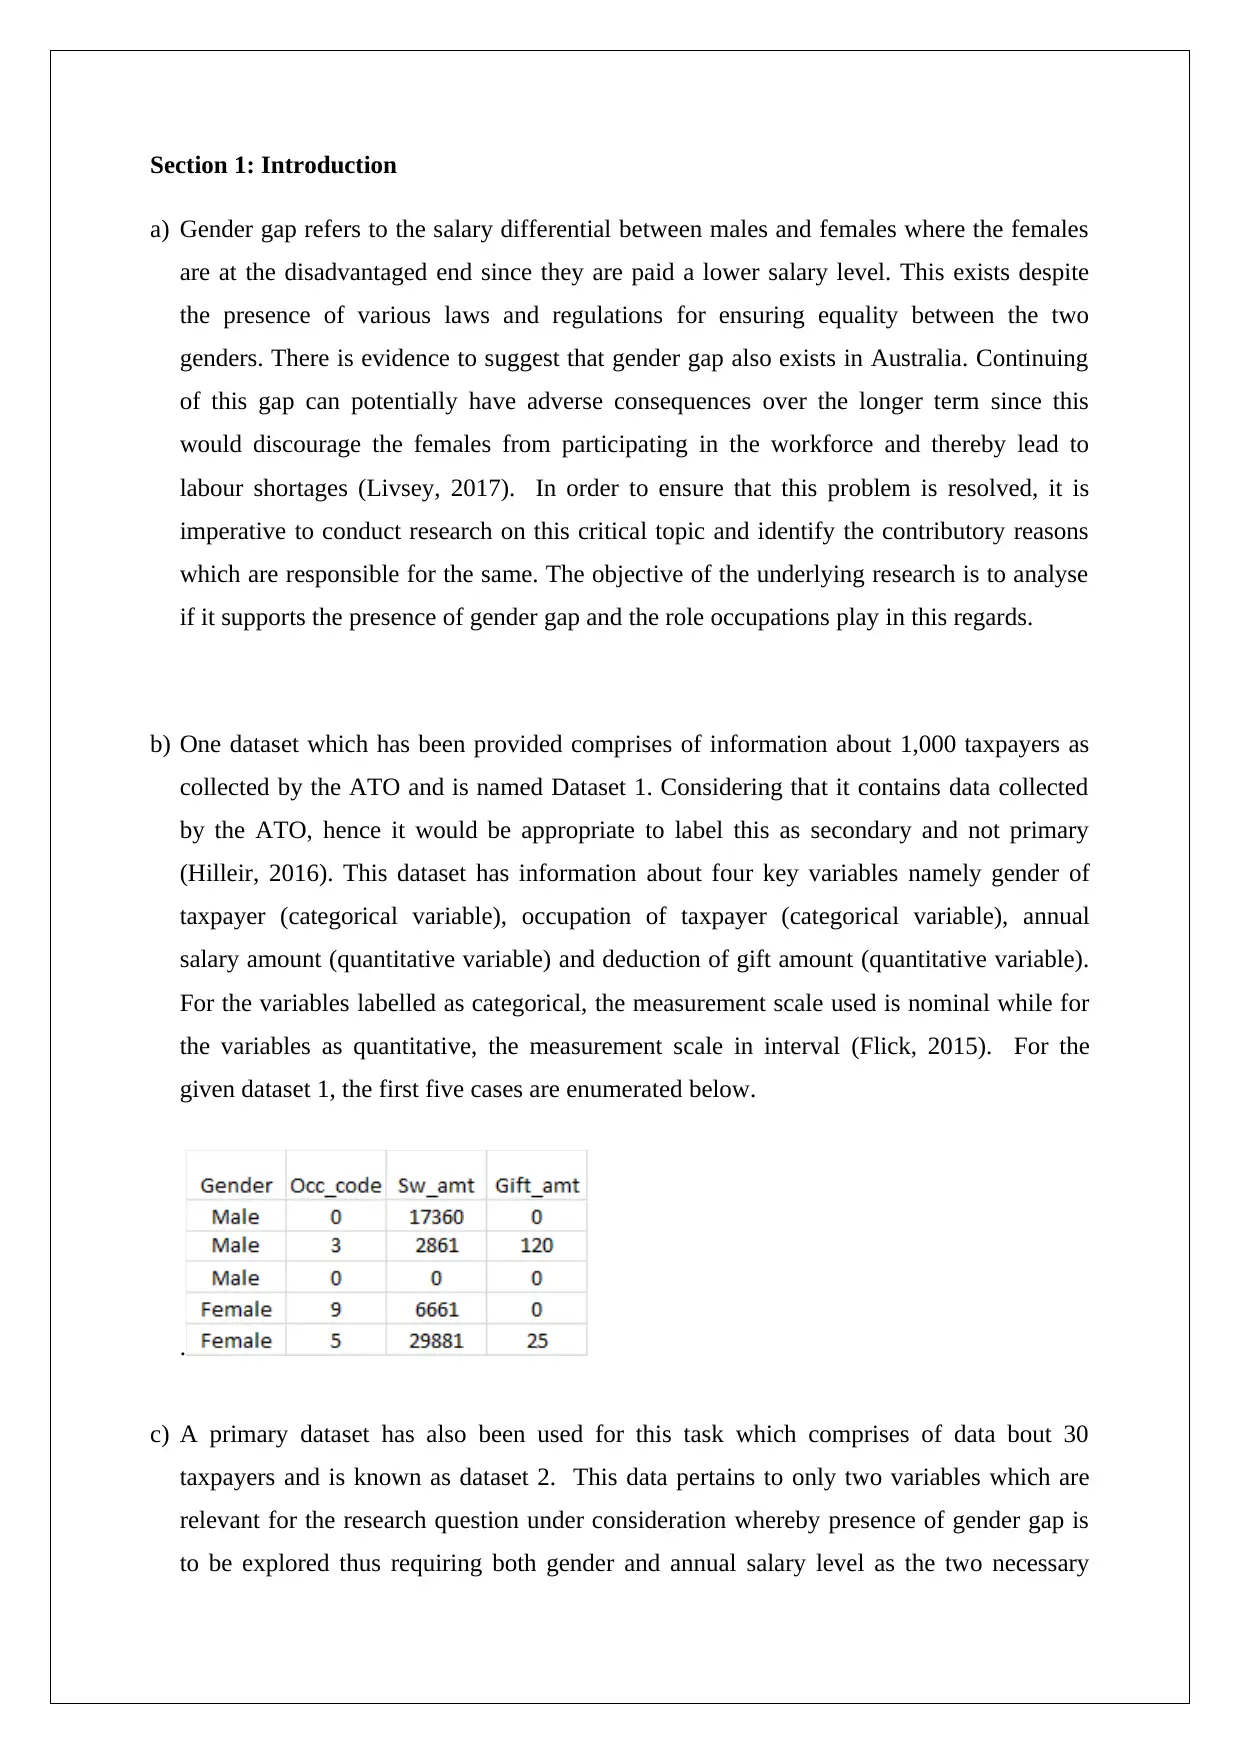
given dataset 1, the first five cases are enumerated below.
.
c) A primary dataset has also been used for this task which comprises of data bout 30
taxpayers and is known as dataset 2. This data pertains to only two variables which are
relevant for the research question under consideration whereby presence of gender gap is
to be explored thus requiring both gender and annual salary level as the two necessary
a) Gender gap refers to the salary differential between males and females where the females
are at the disadvantaged end since they are paid a lower salary level. This exists despite
the presence of various laws and regulations for ensuring equality between the two
genders. There is evidence to suggest that gender gap also exists in Australia. Continuing
of this gap can potentially have adverse consequences over the longer term since this
would discourage the females from participating in the workforce and thereby lead to
labour shortages (Livsey, 2017). In order to ensure that this problem is resolved, it is
imperative to conduct research on this critical topic and identify the contributory reasons
which are responsible for the same. The objective of the underlying research is to analyse
if it supports the presence of gender gap and the role occupations play in this regards.
b) One dataset which has been provided comprises of information about 1,000 taxpayers as
collected by the ATO and is named Dataset 1. Considering that it contains data collected
by the ATO, hence it would be appropriate to label this as secondary and not primary
(Hilleir, 2016). This dataset has information about four key variables namely gender of
taxpayer (categorical variable), occupation of taxpayer (categorical variable), annual
salary amount (quantitative variable) and deduction of gift amount (quantitative variable).
For the variables labelled as categorical, the measurement scale used is nominal while for
the variables as quantitative, the measurement scale in interval (Flick, 2015). For the
given dataset 1, the first five cases are enumerated below.
.
c) A primary dataset has also been used for this task which comprises of data bout 30
taxpayers and is known as dataset 2. This data pertains to only two variables which are
relevant for the research question under consideration whereby presence of gender gap is
to be explored thus requiring both gender and annual salary level as the two necessary
variables. However, there are certain shortcomings to this approach which are explained as
follows. The first issue is the underlying sampling method used to identify the respondents
which is convenience sampling and can lead to biased samples especially in current case
since the sample size is also quite small. Considering that the sample might not be
representative of the underlying population under study, thus focus would be more on
dataset 1 which is likely to give a more accurate result (Eriksson and Kovalainen, 2015).
Section 2: Descriptive Statistics
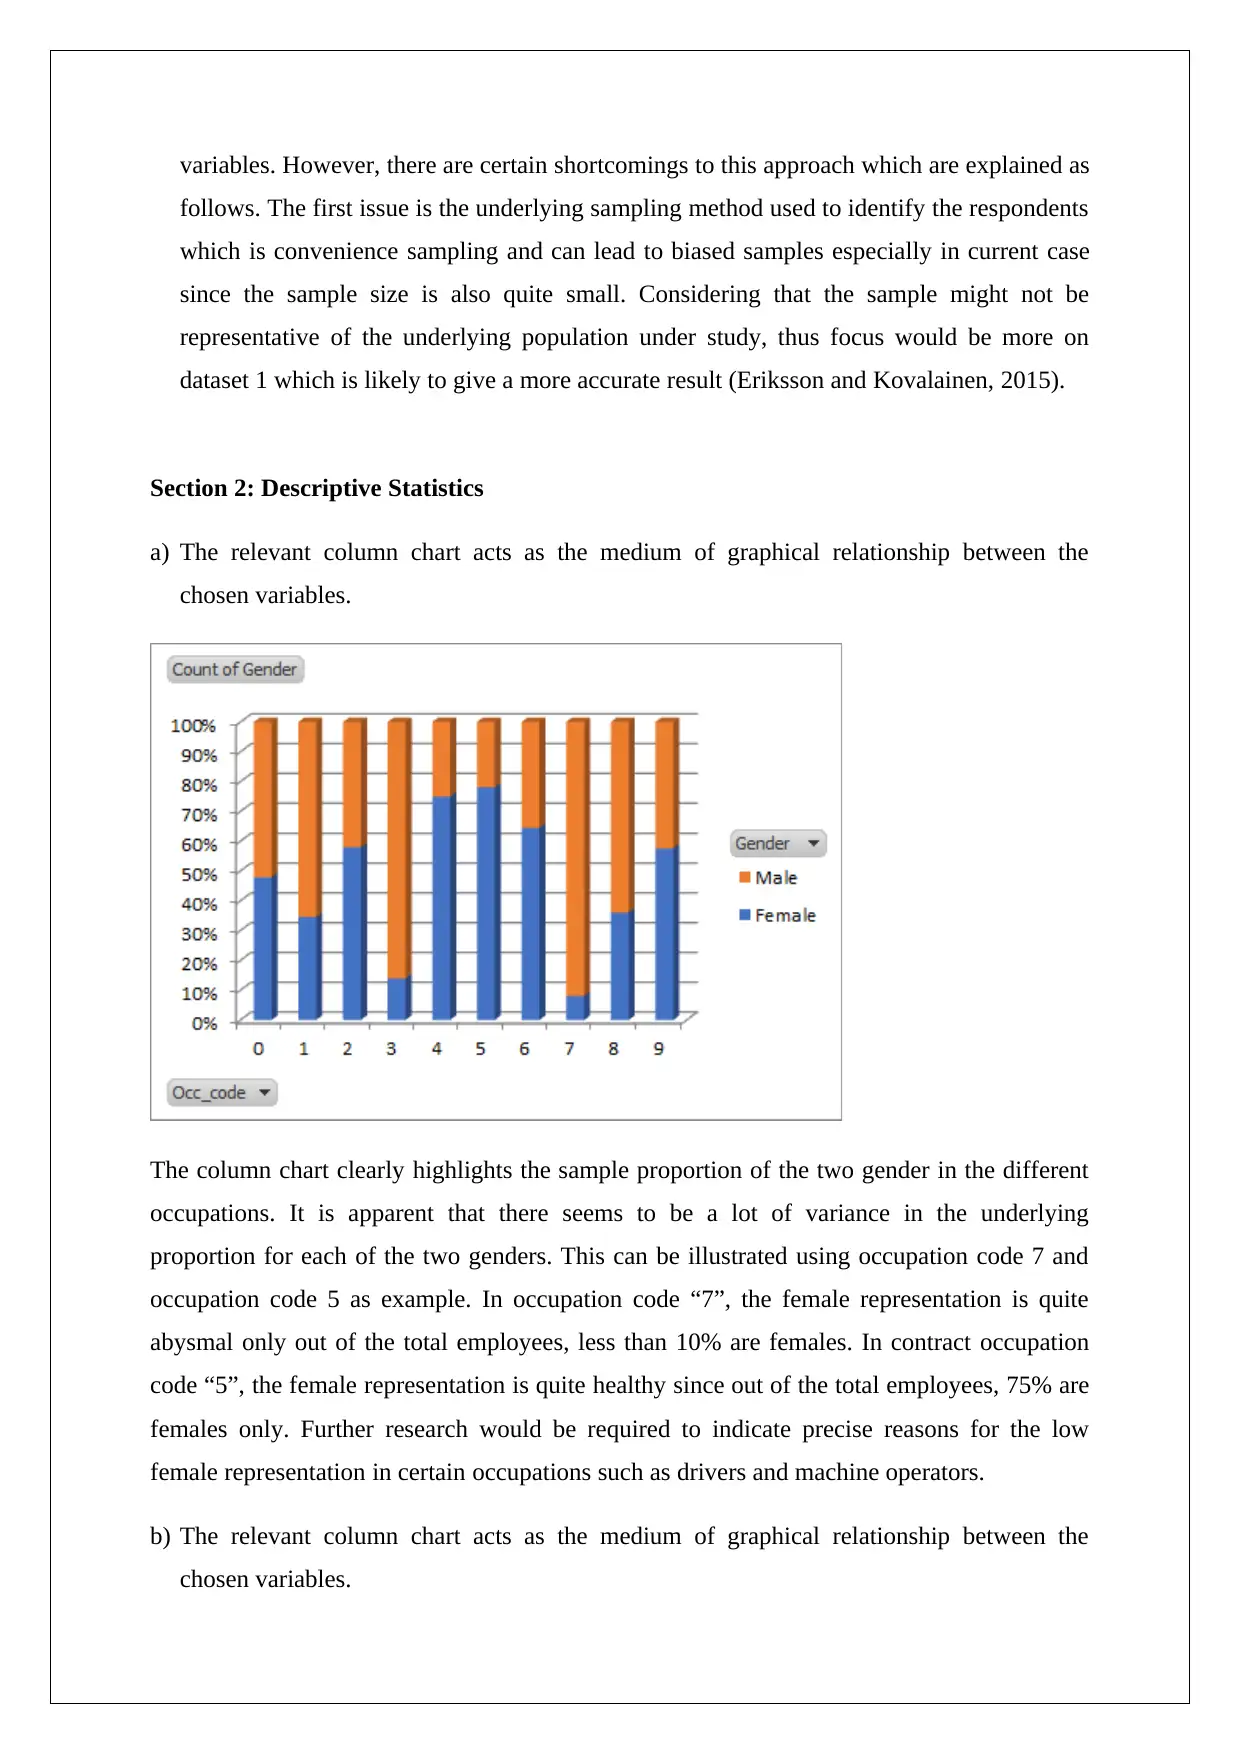
a) The relevant column chart acts as the medium of graphical relationship between the
chosen variables.
The column chart clearly highlights the sample proportion of the two gender in the different
occupations. It is apparent that there seems to be a lot of variance in the underlying
proportion for each of the two genders. This can be illustrated using occupation code 7 and
occupation code 5 as example. In occupation code “7”, the female representation is quite
abysmal only out of the total employees, less than 10% are females. In contract occupation
code “5”, the female representation is quite healthy since out of the total employees, 75% are
females only. Further research would be required to indicate precise reasons for the low
female representation in certain occupations such as drivers and machine operators.
b) The relevant column chart acts as the medium of graphical relationship between the
chosen variables.
follows. The first issue is the underlying sampling method used to identify the respondents
which is convenience sampling and can lead to biased samples especially in current case
since the sample size is also quite small. Considering that the sample might not be
representative of the underlying population under study, thus focus would be more on
dataset 1 which is likely to give a more accurate result (Eriksson and Kovalainen, 2015).
Section 2: Descriptive Statistics
a) The relevant column chart acts as the medium of graphical relationship between the
chosen variables.
The column chart clearly highlights the sample proportion of the two gender in the different
occupations. It is apparent that there seems to be a lot of variance in the underlying
proportion for each of the two genders. This can be illustrated using occupation code 7 and
occupation code 5 as example. In occupation code “7”, the female representation is quite
abysmal only out of the total employees, less than 10% are females. In contract occupation
code “5”, the female representation is quite healthy since out of the total employees, 75% are
females only. Further research would be required to indicate precise reasons for the low
female representation in certain occupations such as drivers and machine operators.
b) The relevant column chart acts as the medium of graphical relationship between the
chosen variables.
⊘ This is a preview!⊘
Do you want full access?
Subscribe today to unlock all pages.
Trusted by 1+ million students worldwide
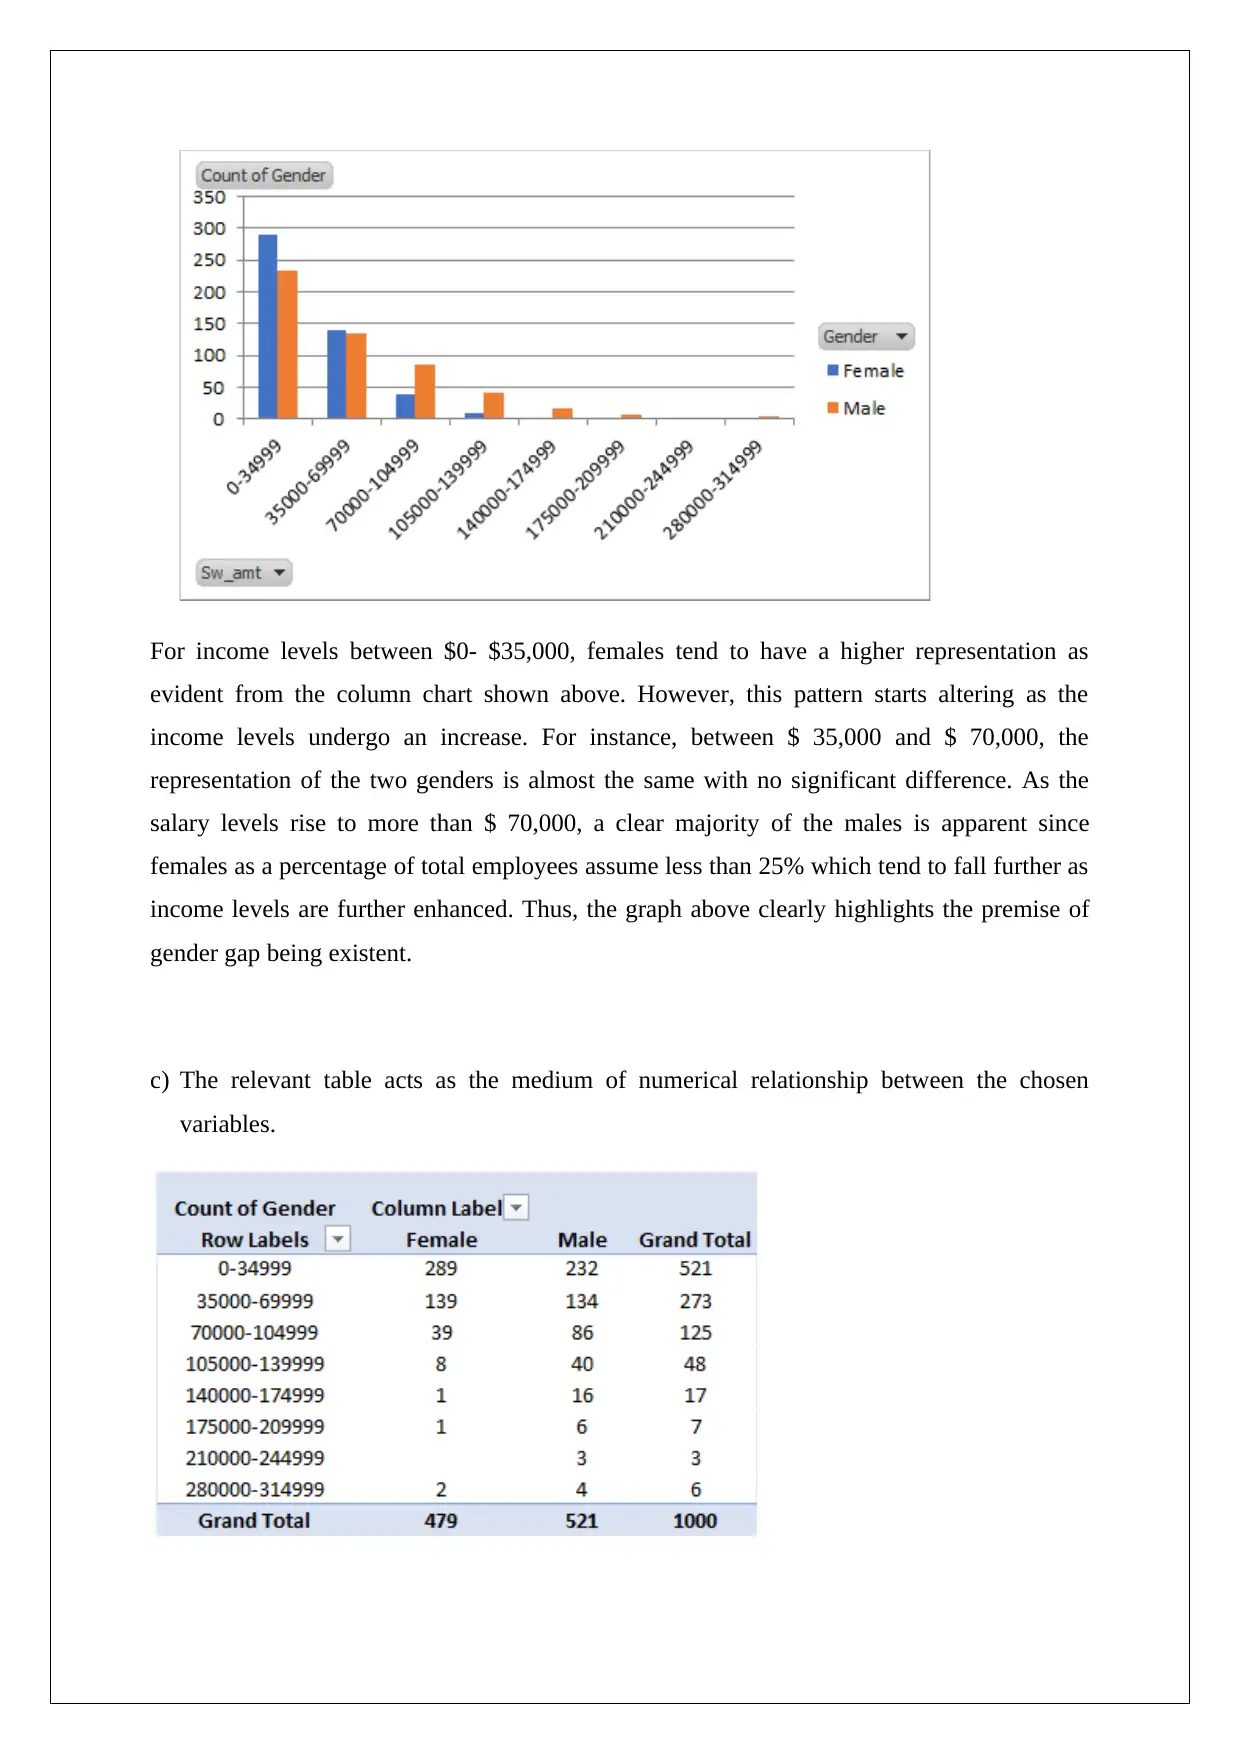
For income levels between $0- $35,000, females tend to have a higher representation as
evident from the column chart shown above. However, this pattern starts altering as the
income levels undergo an increase. For instance, between $ 35,000 and $ 70,000, the
representation of the two genders is almost the same with no significant difference. As the
salary levels rise to more than $ 70,000, a clear majority of the males is apparent since
females as a percentage of total employees assume less than 25% which tend to fall further as
income levels are further enhanced. Thus, the graph above clearly highlights the premise of
gender gap being existent.
c) The relevant table acts as the medium of numerical relationship between the chosen
variables.
Paraphrase This Document
Need a fresh take? Get an instant paraphrase of this document with our AI Paraphraser
The presence of the gender gap is further confirmed by the above table, Besides, the
escalation of this gap at higher salary levels is also clearly visible. For instance, between $
70,000 and $ 105,000, the female representation is about 33%. However, when the next
salary level i.e. $ 105,000 to $ 140,000 is taken into consideration, then the representation of
female is dropped to less than 20%. This trend continues as the salary levels tend to rise.
Thus, in wake of the above gender gap there is pertinent question as to what contributes to
lower salary levels for females. One possible explanation is that females in matters of being
paid are discriminated against and thus derive lower salary than males. However, it might be
possible that since women have more representation in low paying jobs, hence they tend to
have an average salary level lower than the males.
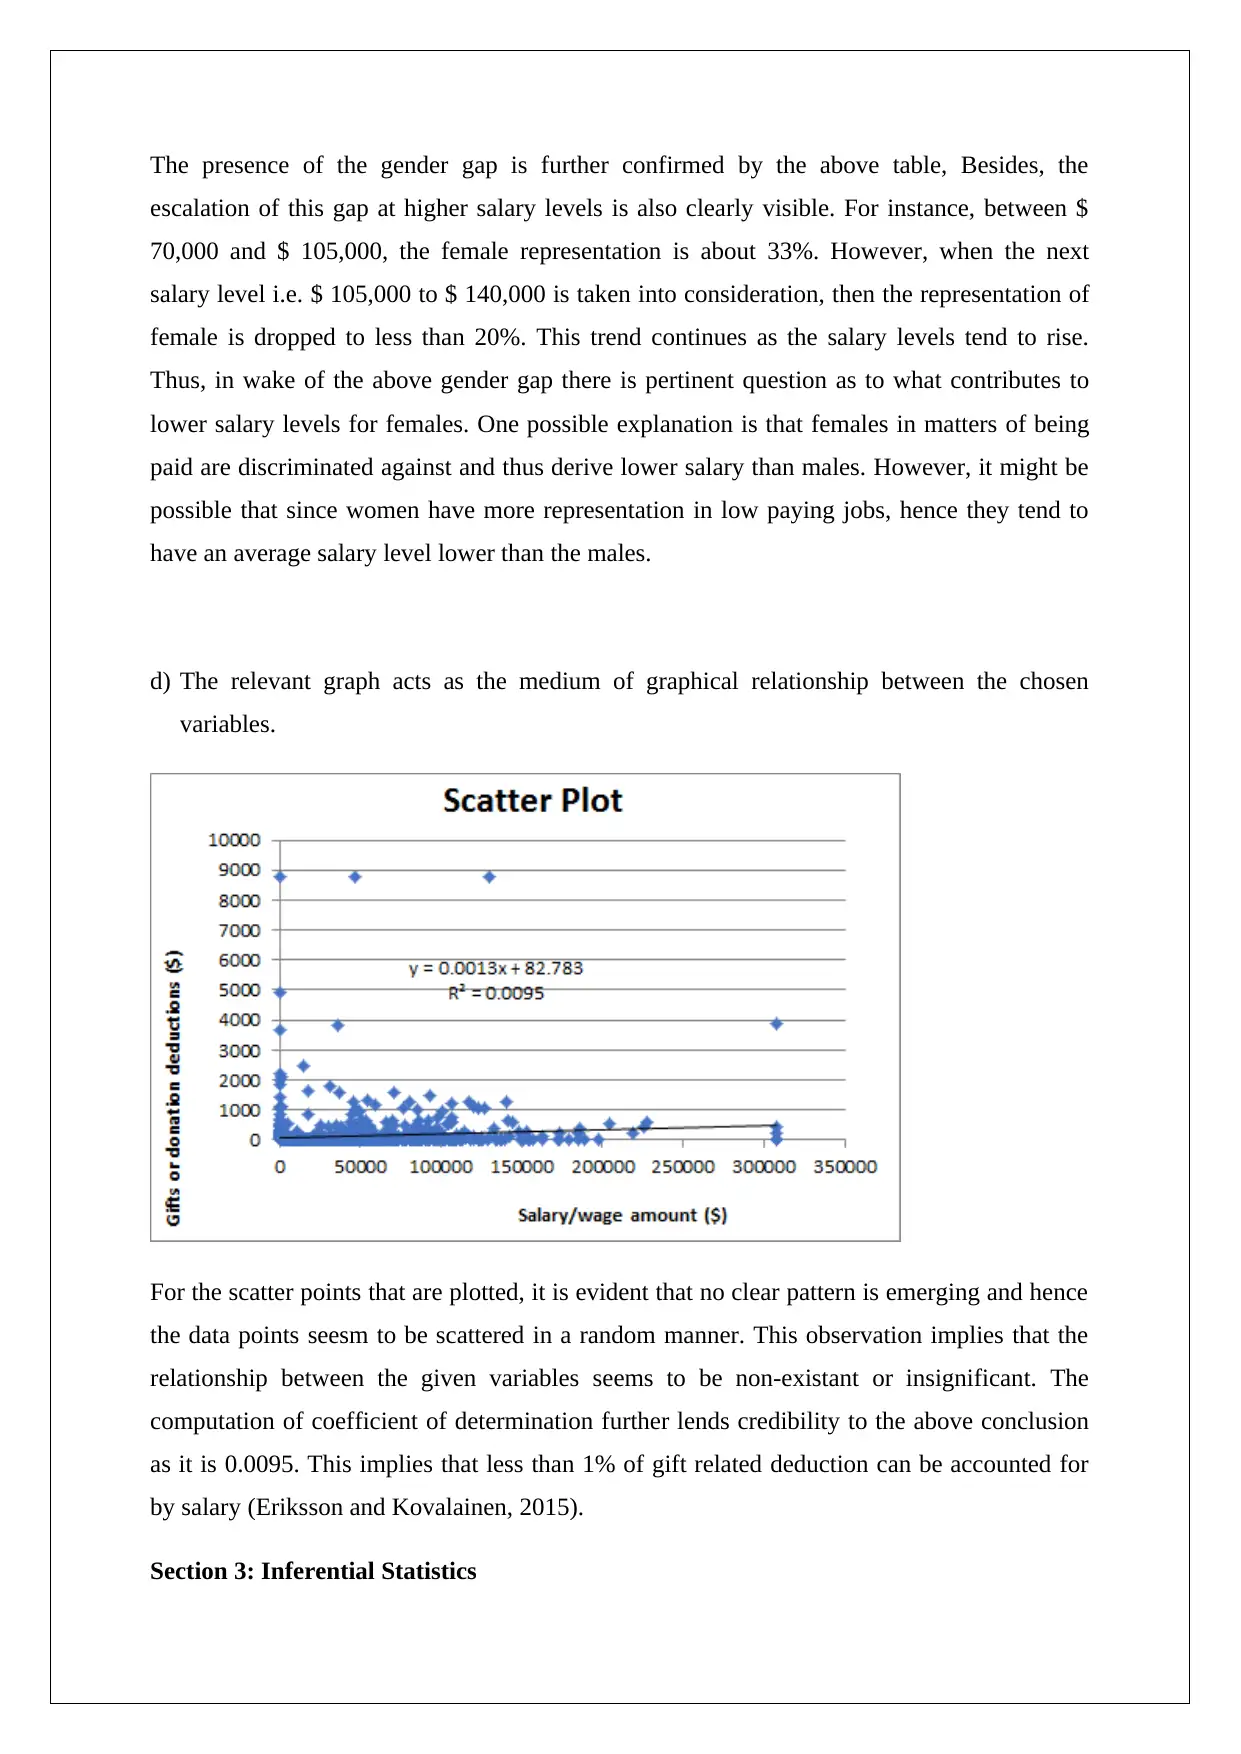
d) The relevant graph acts as the medium of graphical relationship between the chosen
variables.
For the scatter points that are plotted, it is evident that no clear pattern is emerging and hence
the data points seesm to be scattered in a random manner. This observation implies that the
relationship between the given variables seems to be non-existant or insignificant. The
computation of coefficient of determination further lends credibility to the above conclusion
as it is 0.0095. This implies that less than 1% of gift related deduction can be accounted for
by salary (Eriksson and Kovalainen, 2015).
Section 3: Inferential Statistics
escalation of this gap at higher salary levels is also clearly visible. For instance, between $
70,000 and $ 105,000, the female representation is about 33%. However, when the next
salary level i.e. $ 105,000 to $ 140,000 is taken into consideration, then the representation of
female is dropped to less than 20%. This trend continues as the salary levels tend to rise.
Thus, in wake of the above gender gap there is pertinent question as to what contributes to
lower salary levels for females. One possible explanation is that females in matters of being
paid are discriminated against and thus derive lower salary than males. However, it might be
possible that since women have more representation in low paying jobs, hence they tend to
have an average salary level lower than the males.
d) The relevant graph acts as the medium of graphical relationship between the chosen
variables.
For the scatter points that are plotted, it is evident that no clear pattern is emerging and hence
the data points seesm to be scattered in a random manner. This observation implies that the
relationship between the given variables seems to be non-existant or insignificant. The
computation of coefficient of determination further lends credibility to the above conclusion
as it is 0.0095. This implies that less than 1% of gift related deduction can be accounted for
by salary (Eriksson and Kovalainen, 2015).
Section 3: Inferential Statistics
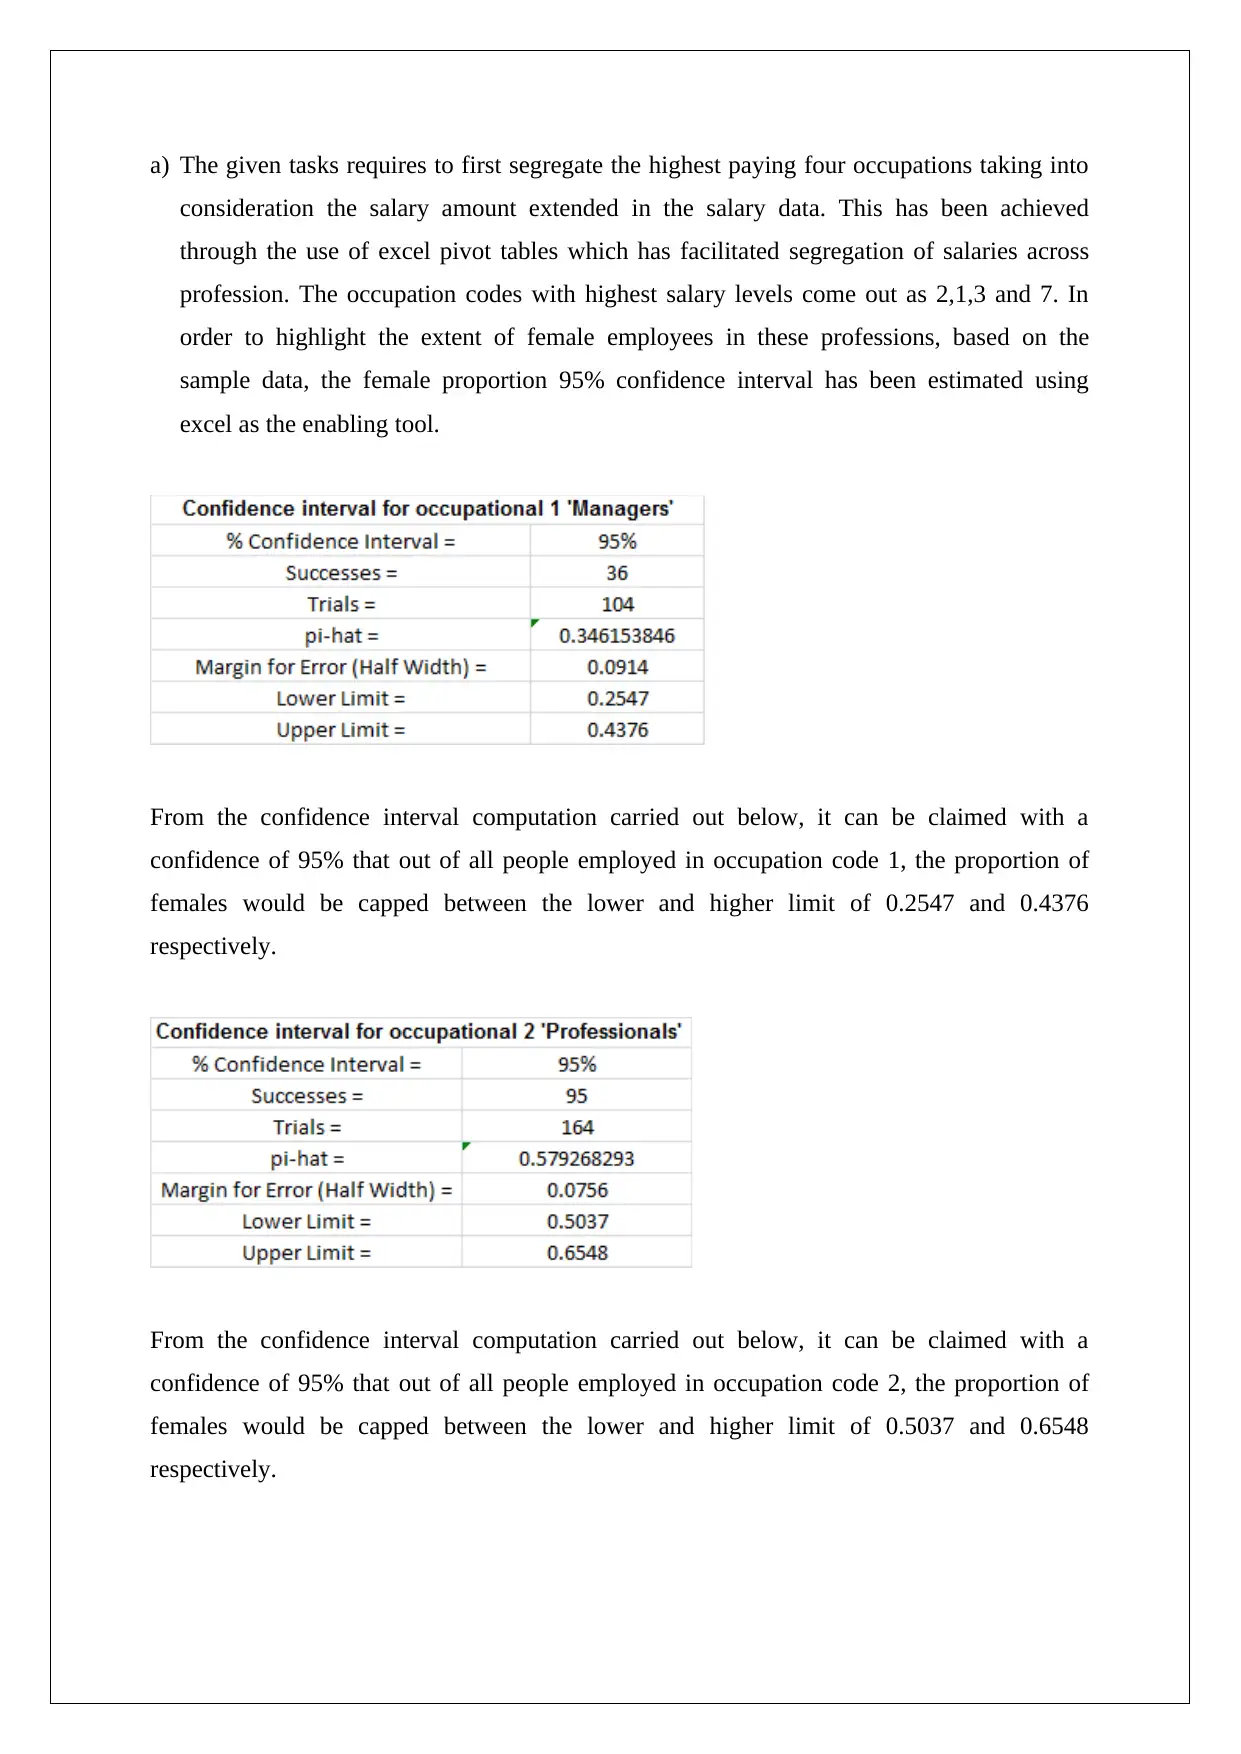
a) The given tasks requires to first segregate the highest paying four occupations taking into
consideration the salary amount extended in the salary data. This has been achieved
through the use of excel pivot tables which has facilitated segregation of salaries across
profession. The occupation codes with highest salary levels come out as 2,1,3 and 7. In
order to highlight the extent of female employees in these professions, based on the
sample data, the female proportion 95% confidence interval has been estimated using
excel as the enabling tool.
From the confidence interval computation carried out below, it can be claimed with a
confidence of 95% that out of all people employed in occupation code 1, the proportion of
females would be capped between the lower and higher limit of 0.2547 and 0.4376
respectively.
From the confidence interval computation carried out below, it can be claimed with a
confidence of 95% that out of all people employed in occupation code 2, the proportion of
females would be capped between the lower and higher limit of 0.5037 and 0.6548
respectively.
⊘ This is a preview!⊘
Do you want full access?
Subscribe today to unlock all pages.
Trusted by 1+ million students worldwide
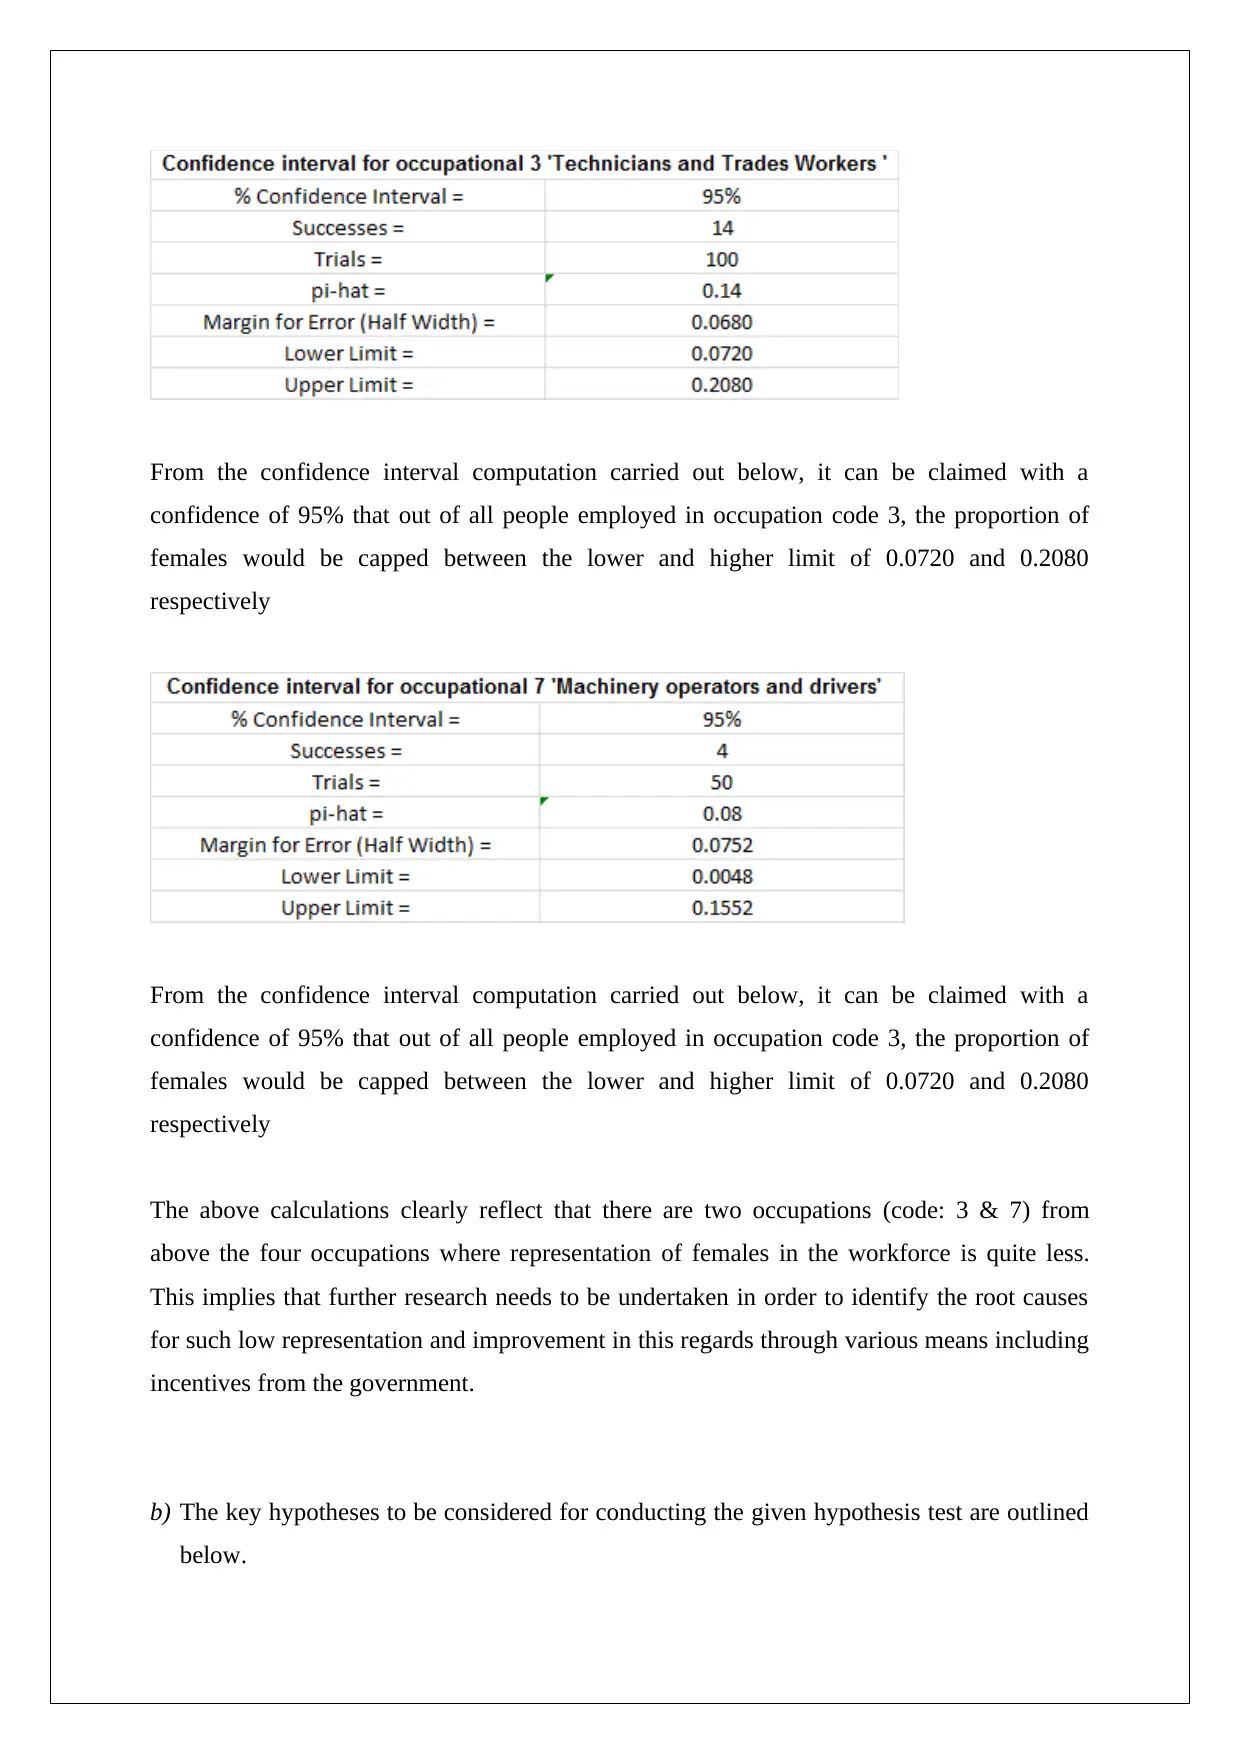
From the confidence interval computation carried out below, it can be claimed with a
confidence of 95% that out of all people employed in occupation code 3, the proportion of
females would be capped between the lower and higher limit of 0.0720 and 0.2080
respectively
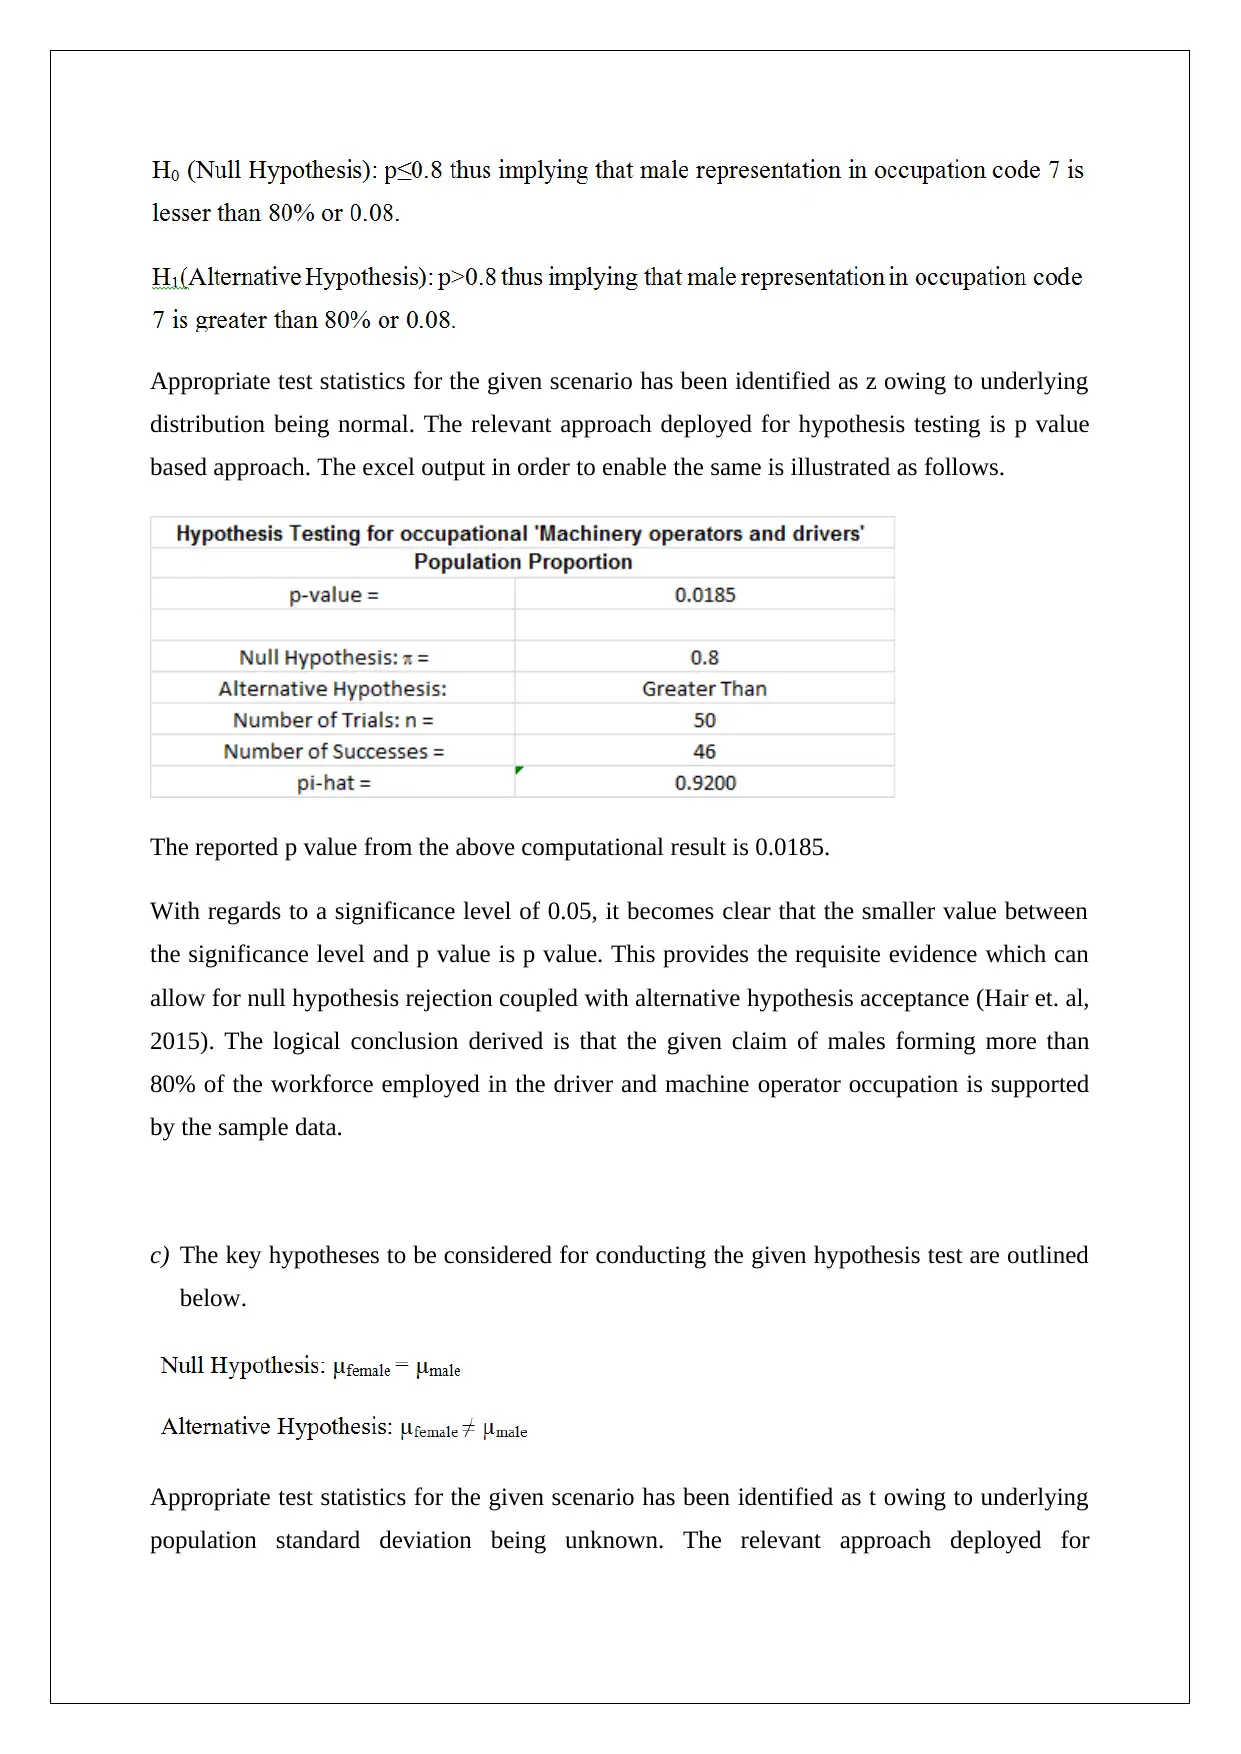
From the confidence interval computation carried out below, it can be claimed with a
confidence of 95% that out of all people employed in occupation code 3, the proportion of
females would be capped between the lower and higher limit of 0.0720 and 0.2080
respectively
The above calculations clearly reflect that there are two occupations (code: 3 & 7) from
above the four occupations where representation of females in the workforce is quite less.
This implies that further research needs to be undertaken in order to identify the root causes
for such low representation and improvement in this regards through various means including
incentives from the government.
b) The key hypotheses to be considered for conducting the given hypothesis test are outlined
below.
confidence of 95% that out of all people employed in occupation code 3, the proportion of
females would be capped between the lower and higher limit of 0.0720 and 0.2080
respectively
From the confidence interval computation carried out below, it can be claimed with a
confidence of 95% that out of all people employed in occupation code 3, the proportion of
females would be capped between the lower and higher limit of 0.0720 and 0.2080
respectively
The above calculations clearly reflect that there are two occupations (code: 3 & 7) from
above the four occupations where representation of females in the workforce is quite less.
This implies that further research needs to be undertaken in order to identify the root causes
for such low representation and improvement in this regards through various means including
incentives from the government.
b) The key hypotheses to be considered for conducting the given hypothesis test are outlined
below.
Paraphrase This Document
Need a fresh take? Get an instant paraphrase of this document with our AI Paraphraser
Appropriate test statistics for the given scenario has been identified as z owing to underlying
distribution being normal. The relevant approach deployed for hypothesis testing is p value
based approach. The excel output in order to enable the same is illustrated as follows.
The reported p value from the above computational result is 0.0185.
With regards to a significance level of 0.05, it becomes clear that the smaller value between
the significance level and p value is p value. This provides the requisite evidence which can
allow for null hypothesis rejection coupled with alternative hypothesis acceptance (Hair et. al,
2015). The logical conclusion derived is that the given claim of males forming more than
80% of the workforce employed in the driver and machine operator occupation is supported
by the sample data.
c) The key hypotheses to be considered for conducting the given hypothesis test are outlined
below.
Appropriate test statistics for the given scenario has been identified as t owing to underlying
population standard deviation being unknown. The relevant approach deployed for
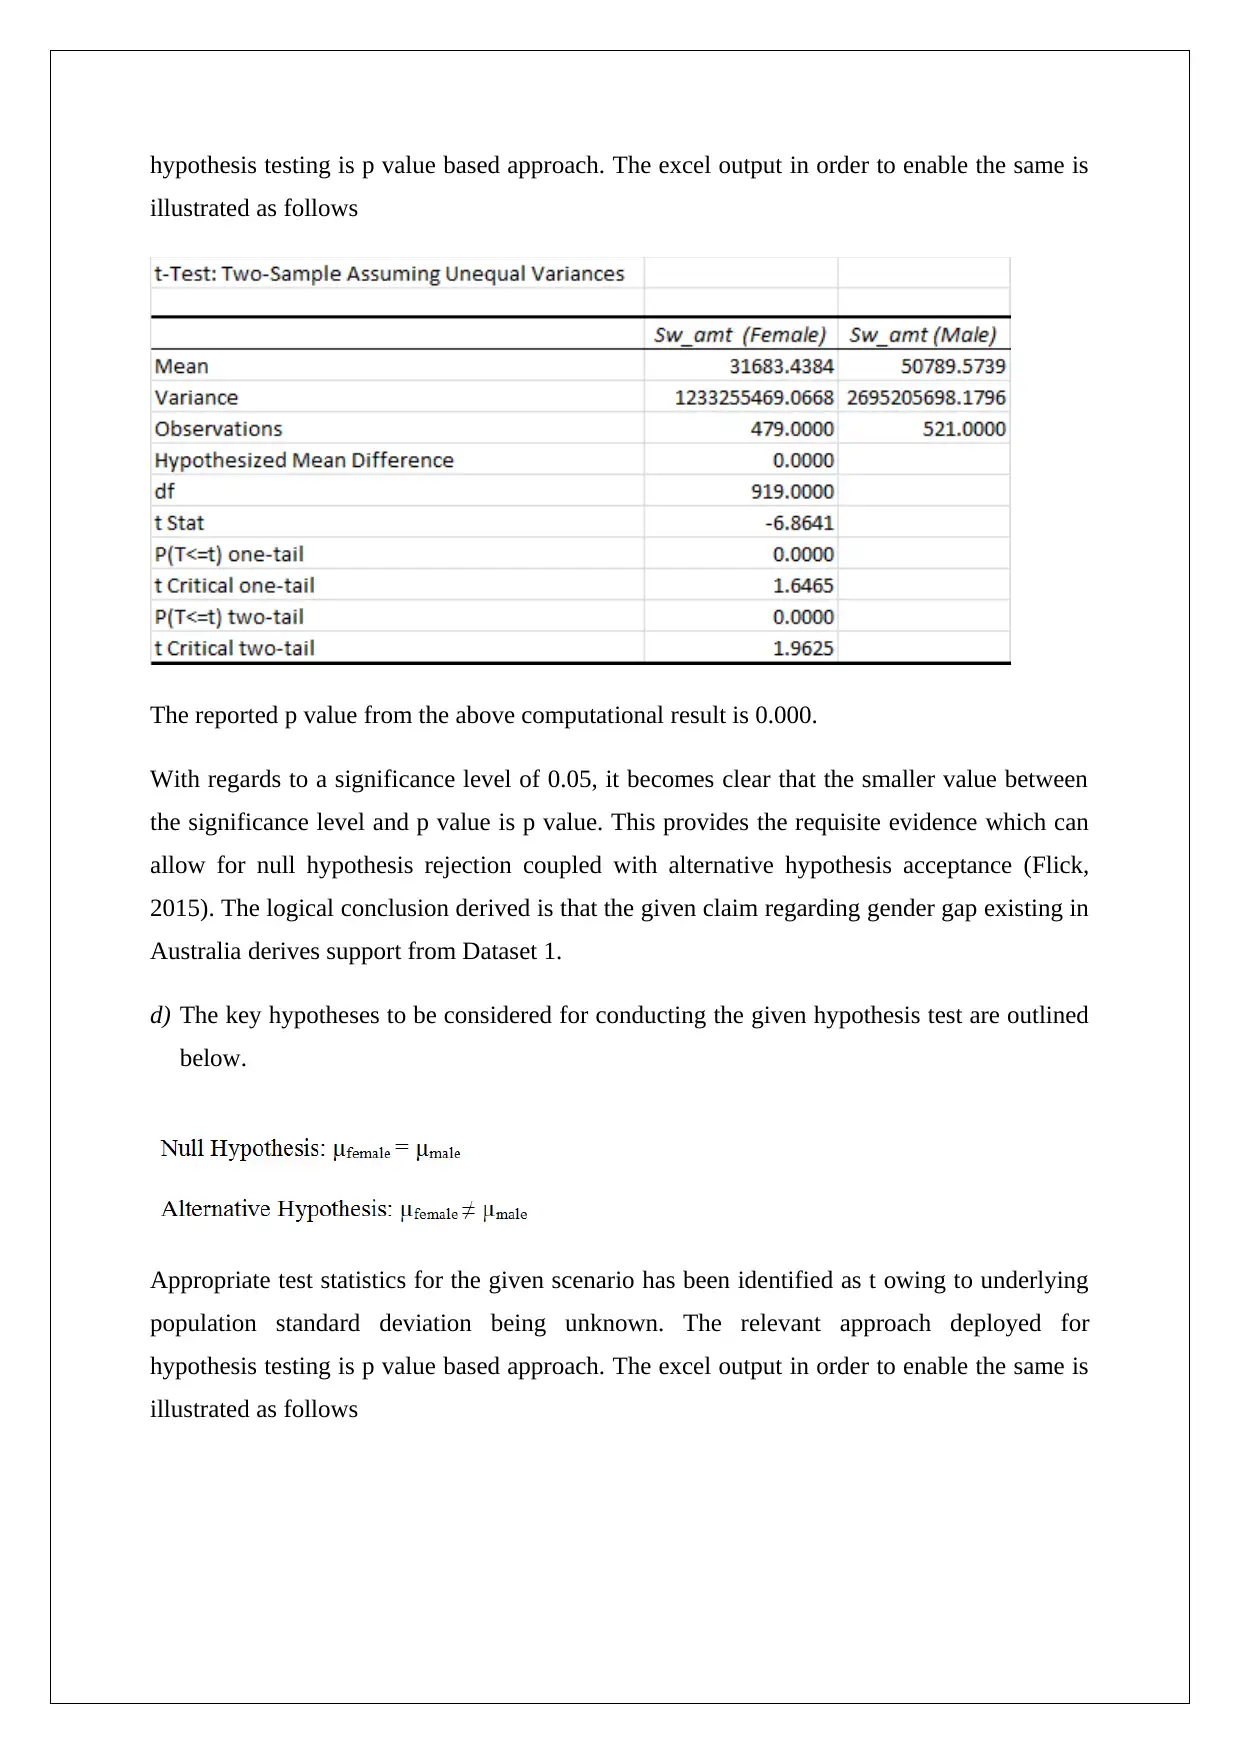
hypothesis testing is p value based approach. The excel output in order to enable the same is
illustrated as follows
The reported p value from the above computational result is 0.000.
With regards to a significance level of 0.05, it becomes clear that the smaller value between
the significance level and p value is p value. This provides the requisite evidence which can
allow for null hypothesis rejection coupled with alternative hypothesis acceptance (Flick,
2015). The logical conclusion derived is that the given claim regarding gender gap existing in
Australia derives support from Dataset 1.
d) The key hypotheses to be considered for conducting the given hypothesis test are outlined
below.
Appropriate test statistics for the given scenario has been identified as t owing to underlying
population standard deviation being unknown. The relevant approach deployed for
hypothesis testing is p value based approach. The excel output in order to enable the same is
illustrated as follows
illustrated as follows
The reported p value from the above computational result is 0.000.
With regards to a significance level of 0.05, it becomes clear that the smaller value between
the significance level and p value is p value. This provides the requisite evidence which can
allow for null hypothesis rejection coupled with alternative hypothesis acceptance (Flick,
2015). The logical conclusion derived is that the given claim regarding gender gap existing in
Australia derives support from Dataset 1.
d) The key hypotheses to be considered for conducting the given hypothesis test are outlined
below.
Appropriate test statistics for the given scenario has been identified as t owing to underlying
population standard deviation being unknown. The relevant approach deployed for
hypothesis testing is p value based approach. The excel output in order to enable the same is
illustrated as follows
⊘ This is a preview!⊘
Do you want full access?
Subscribe today to unlock all pages.
Trusted by 1+ million students worldwide
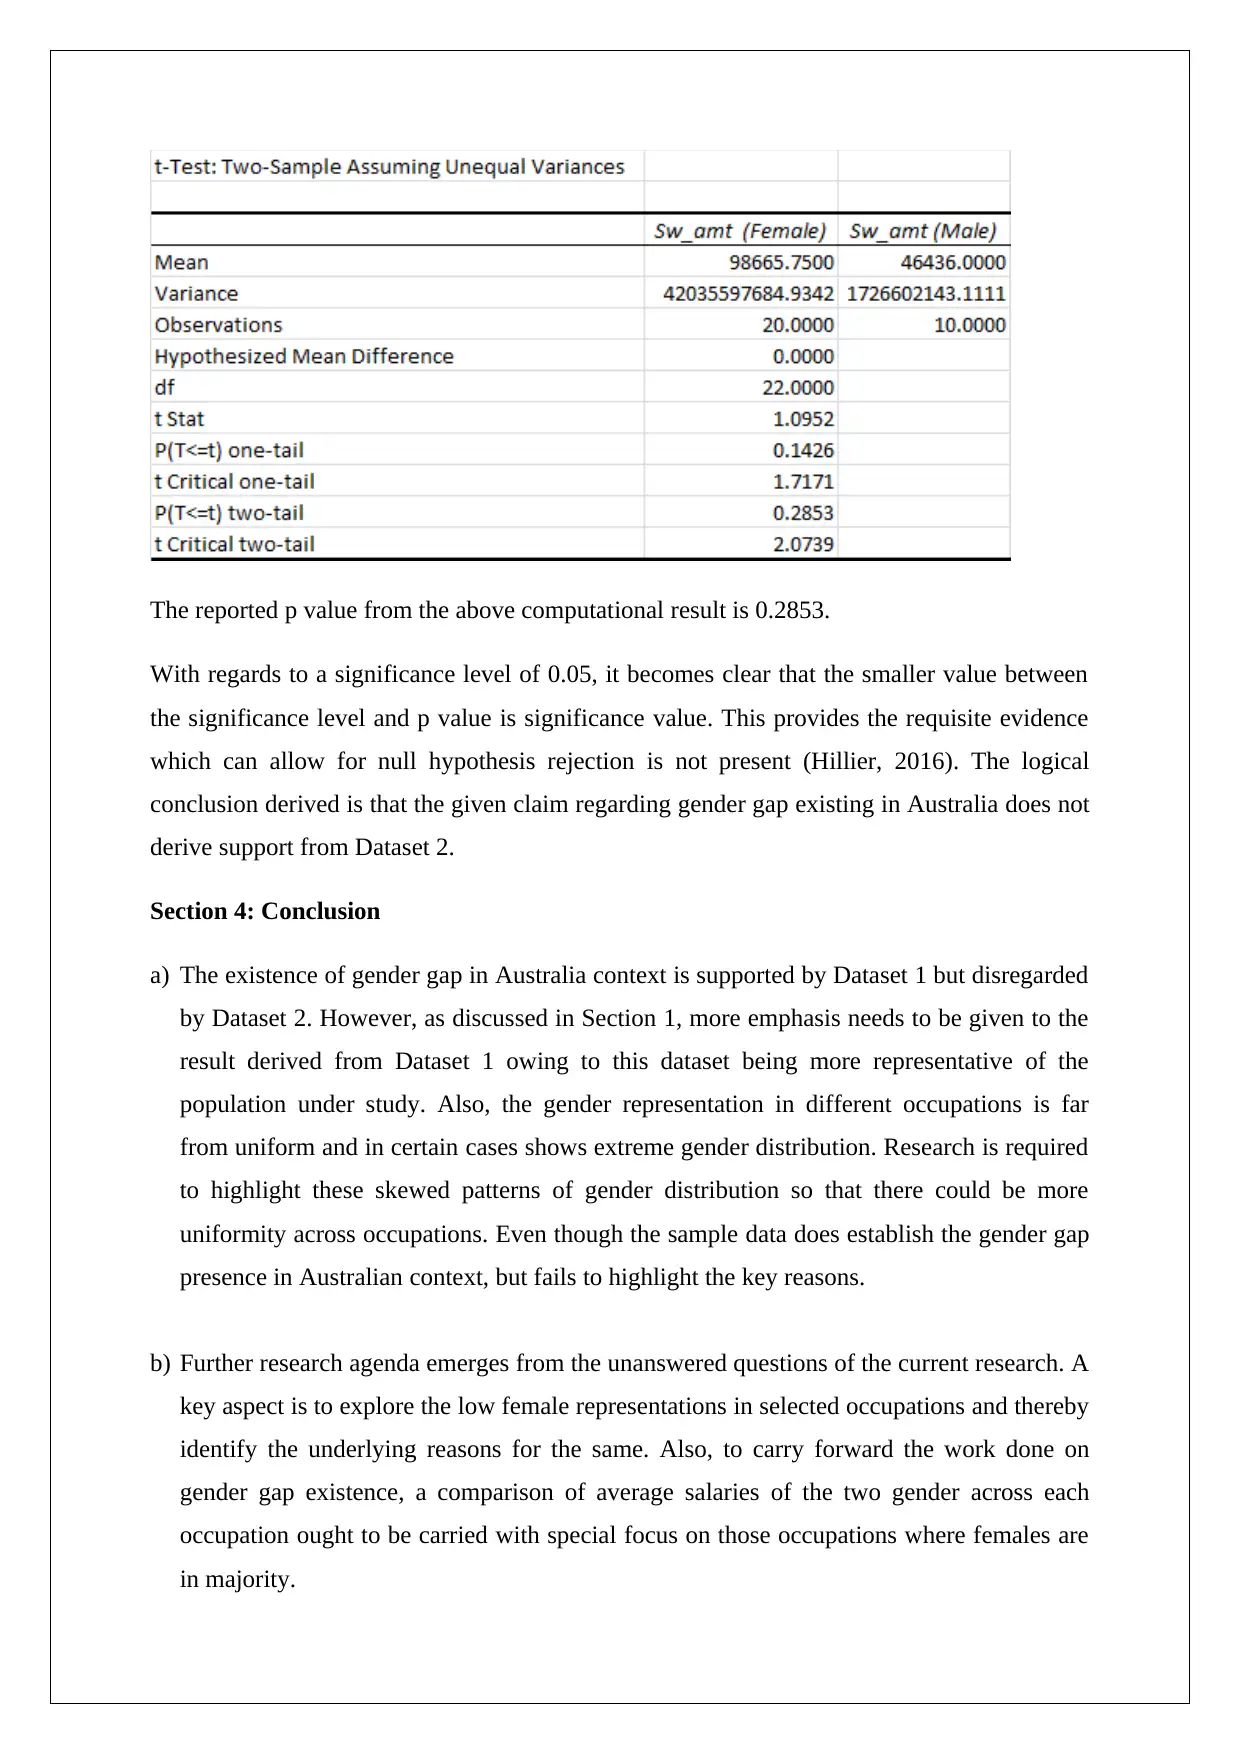
The reported p value from the above computational result is 0.2853.
With regards to a significance level of 0.05, it becomes clear that the smaller value between
the significance level and p value is significance value. This provides the requisite evidence
which can allow for null hypothesis rejection is not present (Hillier, 2016). The logical
conclusion derived is that the given claim regarding gender gap existing in Australia does not
derive support from Dataset 2.
Section 4: Conclusion
a) The existence of gender gap in Australia context is supported by Dataset 1 but disregarded
by Dataset 2. However, as discussed in Section 1, more emphasis needs to be given to the
result derived from Dataset 1 owing to this dataset being more representative of the
population under study. Also, the gender representation in different occupations is far
from uniform and in certain cases shows extreme gender distribution. Research is required
to highlight these skewed patterns of gender distribution so that there could be more
uniformity across occupations. Even though the sample data does establish the gender gap
presence in Australian context, but fails to highlight the key reasons.
b) Further research agenda emerges from the unanswered questions of the current research. A
key aspect is to explore the low female representations in selected occupations and thereby
identify the underlying reasons for the same. Also, to carry forward the work done on
gender gap existence, a comparison of average salaries of the two gender across each
occupation ought to be carried with special focus on those occupations where females are
in majority.
Paraphrase This Document
Need a fresh take? Get an instant paraphrase of this document with our AI Paraphraser
References
Eriksson, P. and Kovalainen, A. (2015) Quantitative methods in business research 3rd ed.
London: Sage Publications.
Flick, U. (2015) Introducing research methodology: A beginner's guide to doing a research
project. 4th ed. New York: Sage Publications.
Hair, J. F., Wolfinbarger, M., Money, A. H., Samouel, P., and Page, M. J. (2015) Essentials
of business research methods. 2nd ed. New York: Routledge.
Hillier, F. (2016) Introduction to Operations Research 6th ed. New York: McGraw Hill
Publications.
Livsey, A (2017) Australia's gender pay gap: why do women still earn less than men?
Retrieved from
https://www.theguardian.com/australia-news/datablog/2017/oct/18/australia-gender-
pay-gap-why-do-women-still-earn-less-than-men
1 out of 11
Related Documents


Your All-in-One AI-Powered Toolkit for Academic Success.
+13062052269
info@desklib.com
Available 24*7 on WhatsApp / Email
![[object Object]](/_next/static/media/star-bottom.7253800d.svg)
Unlock your academic potential
Copyright © 2020–2026 A2Z Services. All Rights Reserved. Developed and managed by ZUCOL.