BUS708 Statistical Modelling: Petrol Price Analysis for NRMA Report
VerifiedAdded on 2023/04/03
|13
|2317
|358
Report
AI Summary
This report presents a statistical analysis of petrol prices, motivated by the need to provide insights to NRMA for a media report. The analysis utilizes two datasets, one provided and one collected, focusing on variables such as petrol station address, brand, fuel code, and price. The report includes descriptive statistics, frequency tables, and histograms to understand the price distribution. A t-test is conducted to determine if the average petrol price differs significantly from a specified value. Furthermore, an ANOVA test is performed to examine price differences across various petrol brands like 7-Eleven, Caltex, Caltex Woolworths, and Coles Express. The report also explores student preferences for different petrol brands based on primary data collected. The findings suggest that petrol prices are not normally distributed, vary across brands, and that students tend to prefer Caltex Woolworths, potentially due to its lower average price. The report concludes with a discussion of the limitations and suggestions for future research, such as incorporating fuel codes and expanding the dataset for more robust conclusions. Desklib provides access to this and other student-contributed assignments.
Running head: STATISTICAL MODELLING
Statistical Modelling
Name of the Student:
Name of the University:
Author Note:
Statistical Modelling
Name of the Student:
Name of the University:
Author Note:
Paraphrase This Document
Need a fresh take? Get an instant paraphrase of this document with our AI Paraphraser
1
STATISTICAL MODELLING
Table of Contents
Section 1: Introduction...............................................................................................................2
Section 2: Summary, Description of Price and T-test................................................................3
Section 3: Price across Brands and ANOVA Test.....................................................................6
Section 4: Students Preference...................................................................................................9
Section 5: Discussion and Conclusion.....................................................................................10
Reference and Bibliography.....................................................................................................11
2
STATISTICAL MODELLING
Section 1: Introduction
There are several studies on the petrol and gasoline prices that changes depending on
the dynamic nature of the market. In the last couple of decades Spanish petrol market
experienced a restructuration process that influenced by the privatization and liberalisation.
Prior to the liberalisation, the petrol market was monopoly in Spain. To increase the petrol
station networking, reduction of the minimum distance among the petrol distance was
focused and it raised the competition too. This research studied the market of petrol price
using a dynamic price model, current economic situations and did an empirical study
(Escribano, and Torrado 2018). The used data in the study was on retail prices, the spot prices
and the demand for the petrol and gasoline. The motive of the paper is to analyse the effects
of demand and cost on current margins.
In this study the data is secondary and collected form government website. A subset
off data is used here for the analysis and the extracted data contains few important variables.
The data contains the variables like, the address of the petrol station, suburb and postcode,
Brand of the petrol, fuel code and price of the petrol. This data is used to check whether the
prices of the petrol produced by different brands is same or different and if it is different then
which brand price is lower.
The second data set is primary data that is collected on the variable that are brand of
the petrol, price of the petrol and the address of the service station. The analysis used only the
variable brand name to check which one is mostly used. The limitation of the data set is it
contains less amount of observation which is just not small but 30 observations (Quinlan et
al. 2019). The data contains only the brand name of petrol which only can tell about the
preference of brad among the students.
⊘ This is a preview!⊘
Do you want full access?
Subscribe today to unlock all pages.
Trusted by 1+ million students worldwide
3
STATISTICAL MODELLING
The paper shows the summary of the price in section 2, section 3 discuses about the
average price of different brands that are different, the section discusses the preference of the
brand and the last part contains a summary of the study and a suggestion for further study.
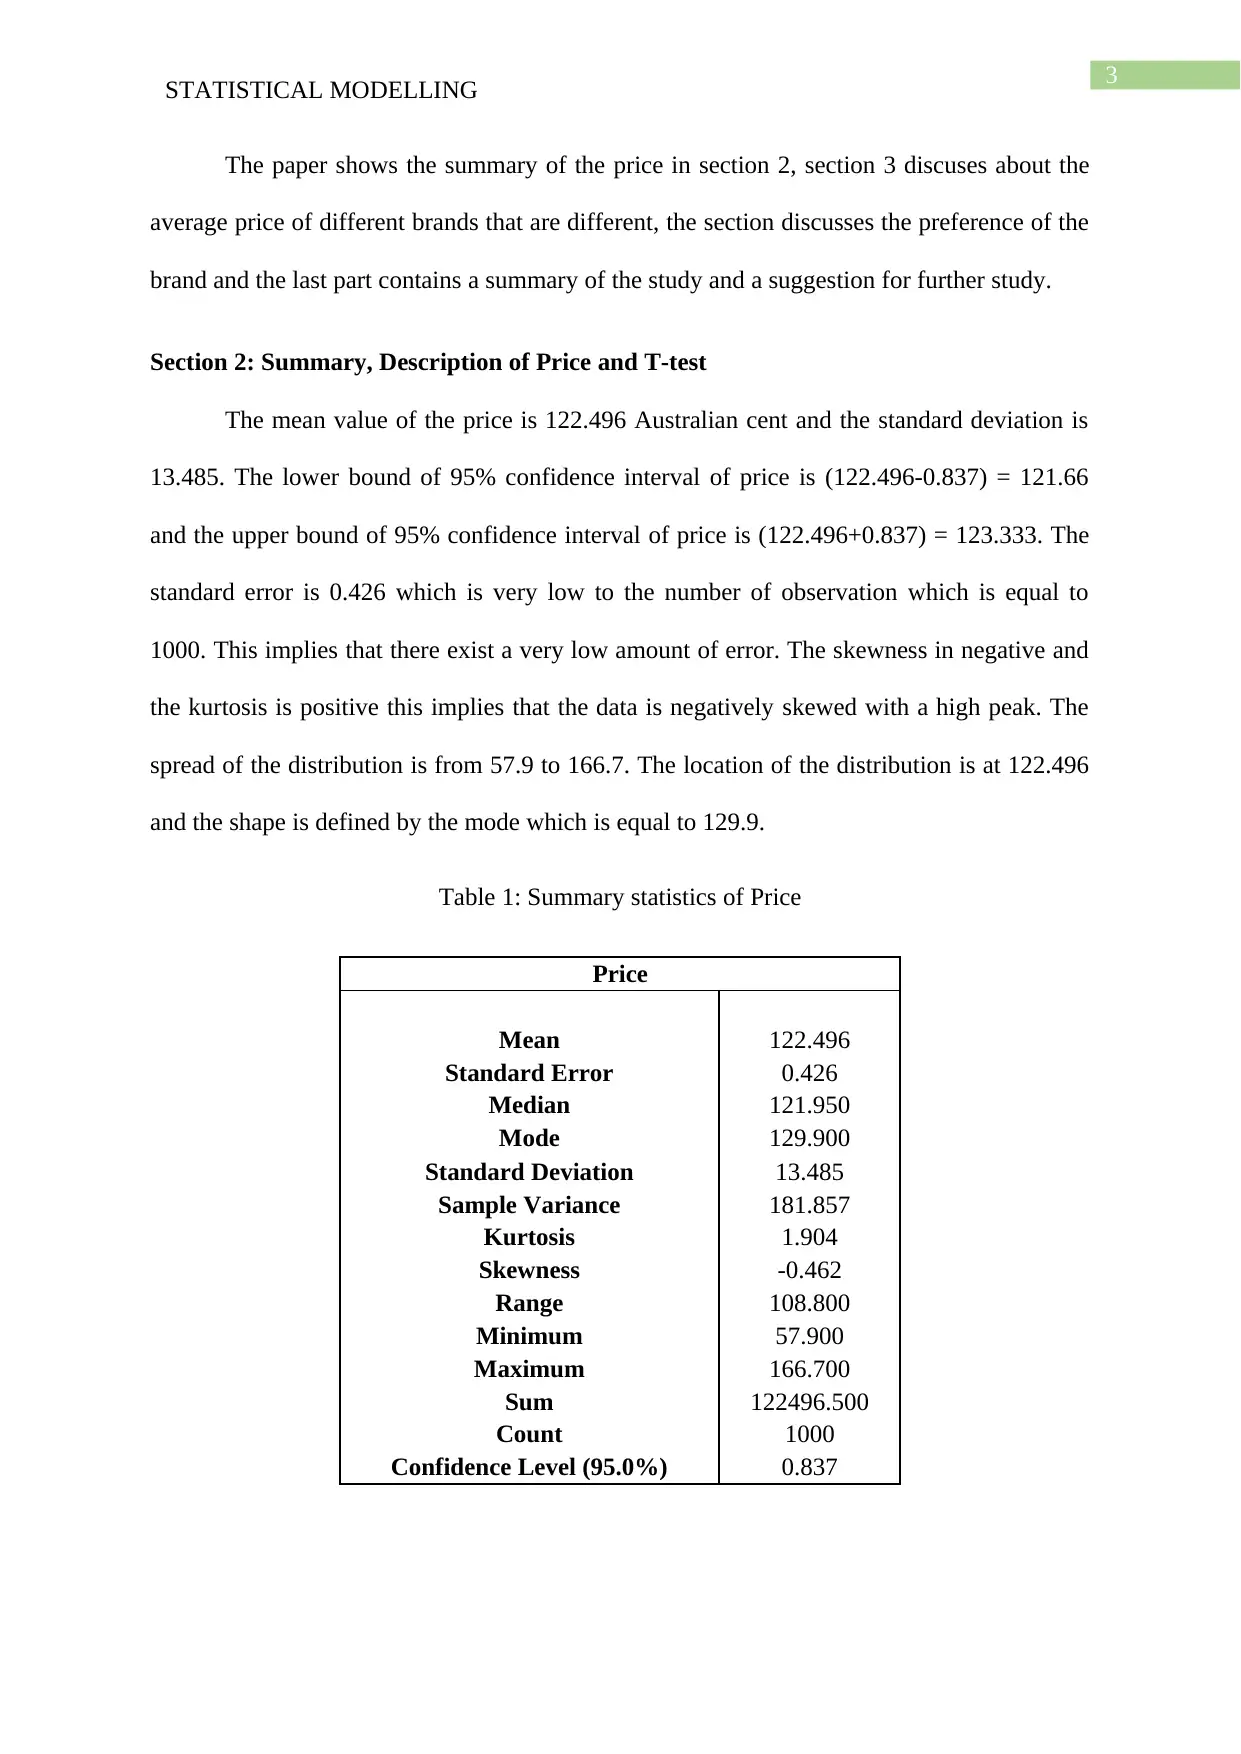
Section 2: Summary, Description of Price and T-test
The mean value of the price is 122.496 Australian cent and the standard deviation is
13.485. The lower bound of 95% confidence interval of price is (122.496-0.837) = 121.66
and the upper bound of 95% confidence interval of price is (122.496+0.837) = 123.333. The
standard error is 0.426 which is very low to the number of observation which is equal to
1000. This implies that there exist a very low amount of error. The skewness in negative and
the kurtosis is positive this implies that the data is negatively skewed with a high peak. The
spread of the distribution is from 57.9 to 166.7. The location of the distribution is at 122.496
and the shape is defined by the mode which is equal to 129.9.
Table 1: Summary statistics of Price
Price
Mean 122.496
Standard Error 0.426
Median 121.950
Mode 129.900
Standard Deviation 13.485
Sample Variance 181.857
Kurtosis 1.904
Skewness -0.462
Range 108.800
Minimum 57.900
Maximum 166.700
Sum 122496.500
Count 1000
Confidence Level (95.0%) 0.837
STATISTICAL MODELLING
The paper shows the summary of the price in section 2, section 3 discuses about the
average price of different brands that are different, the section discusses the preference of the
brand and the last part contains a summary of the study and a suggestion for further study.
Section 2: Summary, Description of Price and T-test
The mean value of the price is 122.496 Australian cent and the standard deviation is
13.485. The lower bound of 95% confidence interval of price is (122.496-0.837) = 121.66
and the upper bound of 95% confidence interval of price is (122.496+0.837) = 123.333. The
standard error is 0.426 which is very low to the number of observation which is equal to
1000. This implies that there exist a very low amount of error. The skewness in negative and
the kurtosis is positive this implies that the data is negatively skewed with a high peak. The
spread of the distribution is from 57.9 to 166.7. The location of the distribution is at 122.496
and the shape is defined by the mode which is equal to 129.9.
Table 1: Summary statistics of Price
Price
Mean 122.496
Standard Error 0.426
Median 121.950
Mode 129.900
Standard Deviation 13.485
Sample Variance 181.857
Kurtosis 1.904
Skewness -0.462
Range 108.800
Minimum 57.900
Maximum 166.700
Sum 122496.500
Count 1000
Confidence Level (95.0%) 0.837
Paraphrase This Document
Need a fresh take? Get an instant paraphrase of this document with our AI Paraphraser
4
STATISTICAL MODELLING
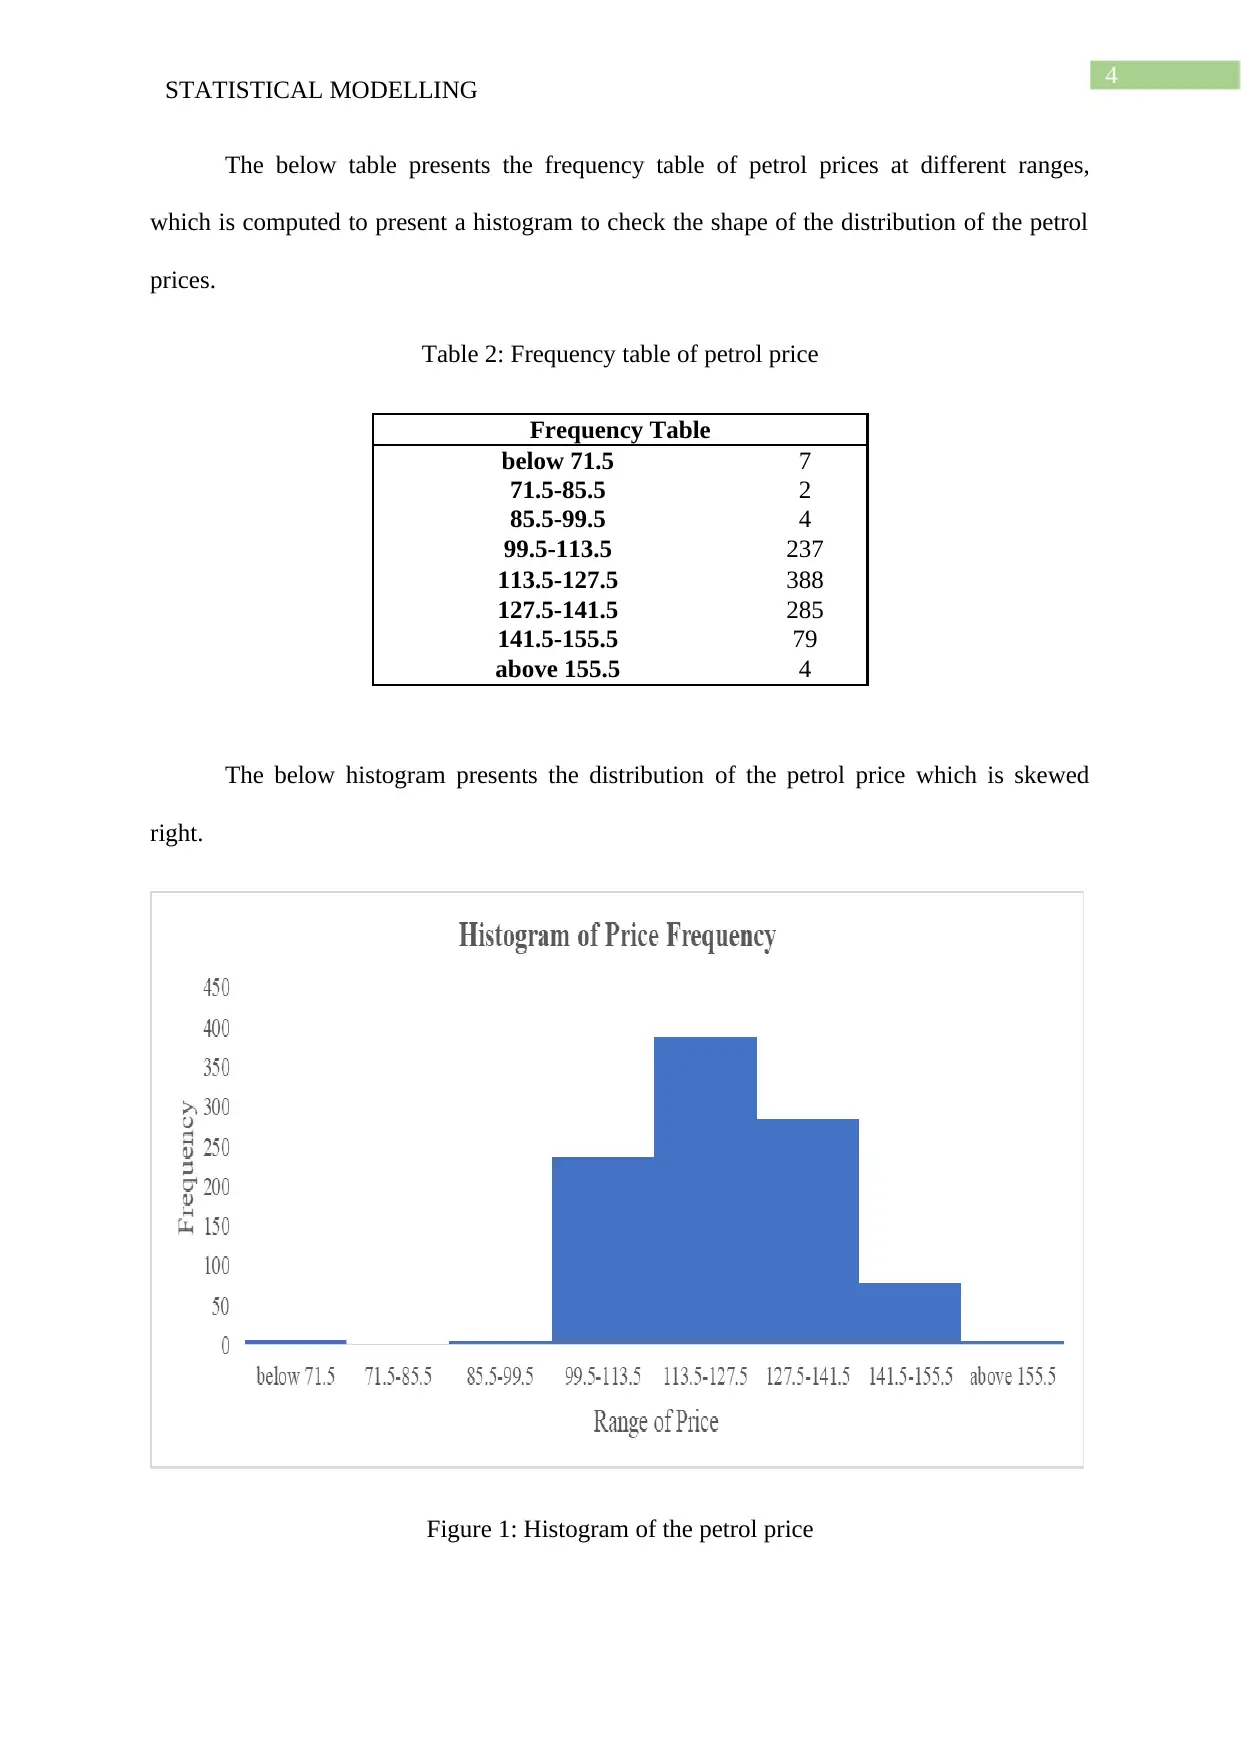
The below table presents the frequency table of petrol prices at different ranges,
which is computed to present a histogram to check the shape of the distribution of the petrol
prices.
Table 2: Frequency table of petrol price
Frequency Table
below 71.5 7
71.5-85.5 2
85.5-99.5 4
99.5-113.5 237
113.5-127.5 388
127.5-141.5 285
141.5-155.5 79
above 155.5 4
The below histogram presents the distribution of the petrol price which is skewed
right.
Figure 1: Histogram of the petrol price
STATISTICAL MODELLING
The below table presents the frequency table of petrol prices at different ranges,
which is computed to present a histogram to check the shape of the distribution of the petrol
prices.
Table 2: Frequency table of petrol price
Frequency Table
below 71.5 7
71.5-85.5 2
85.5-99.5 4
99.5-113.5 237
113.5-127.5 388
127.5-141.5 285
141.5-155.5 79
above 155.5 4
The below histogram presents the distribution of the petrol price which is skewed
right.
Figure 1: Histogram of the petrol price
5
STATISTICAL MODELLING
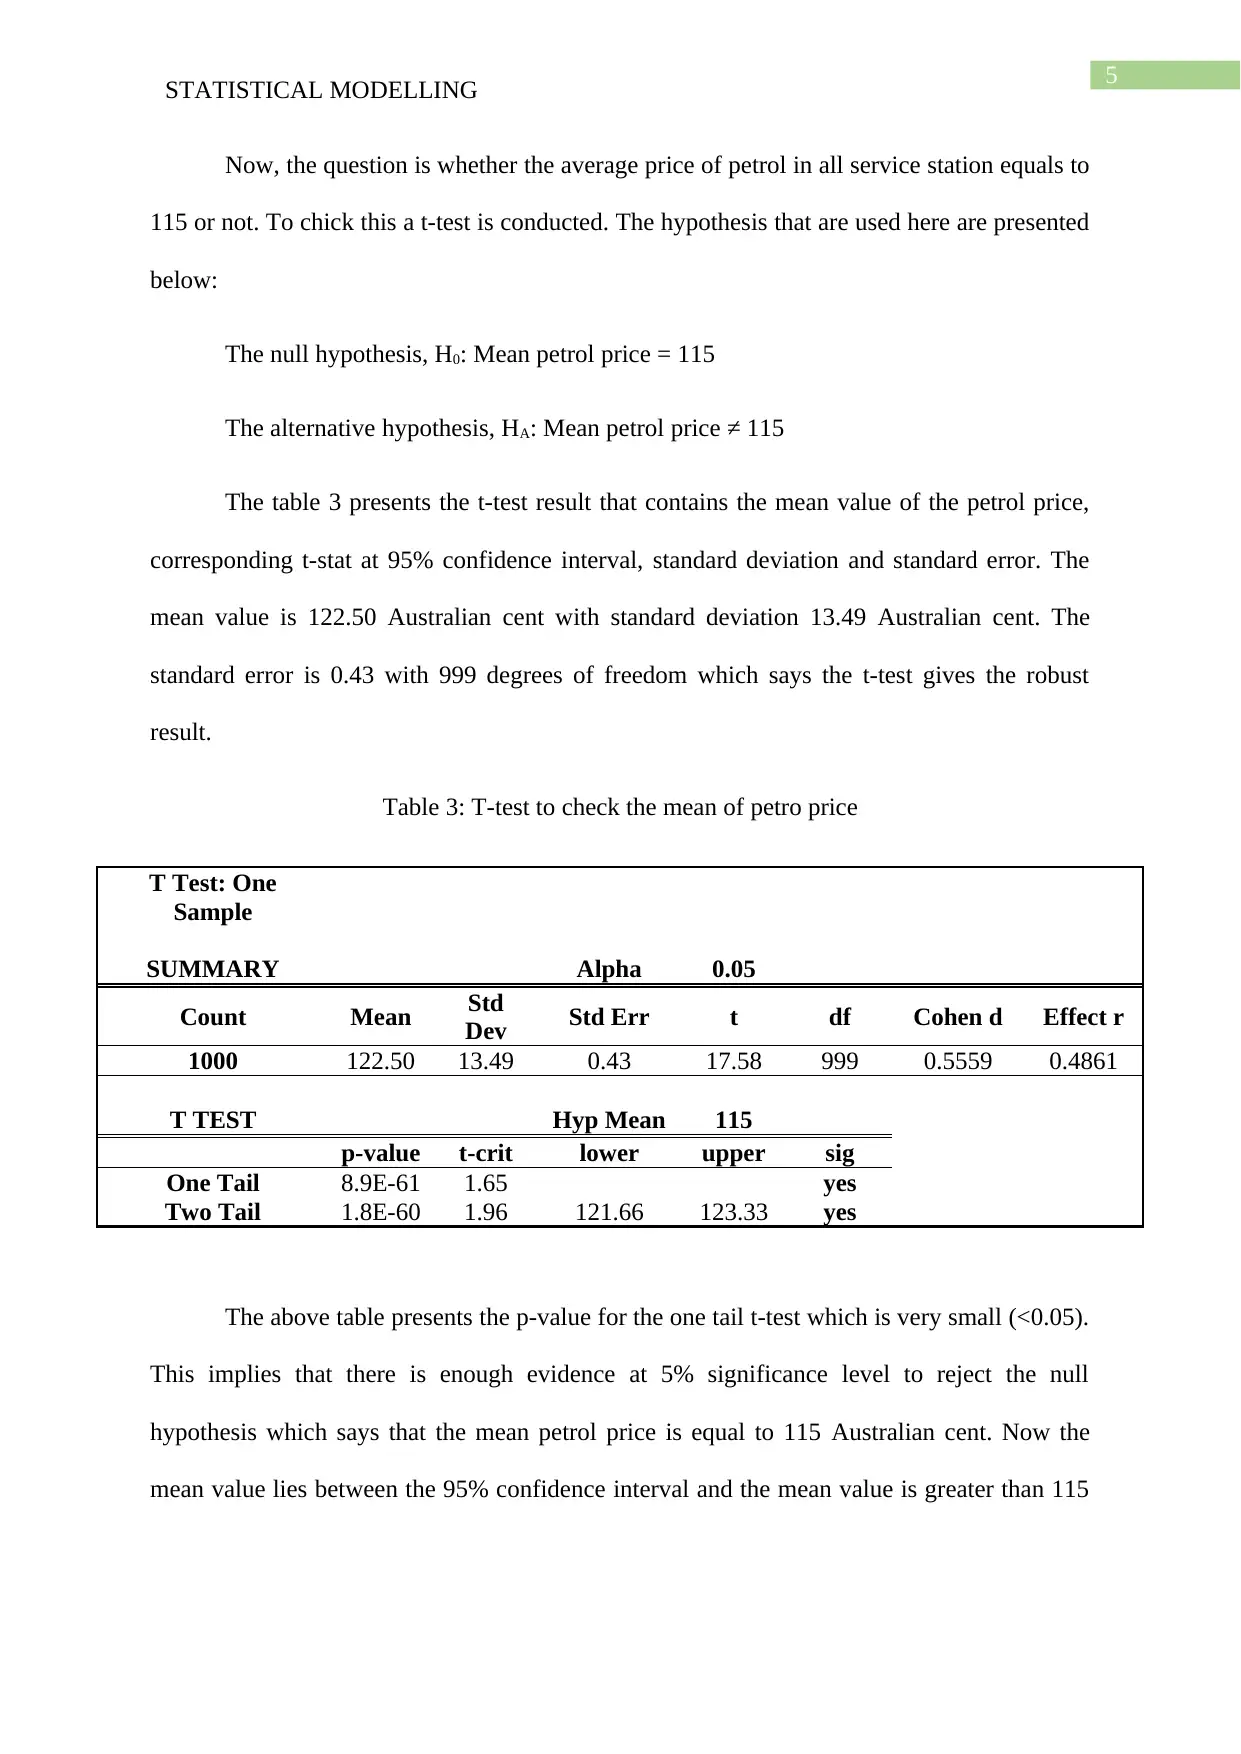
Now, the question is whether the average price of petrol in all service station equals to
115 or not. To chick this a t-test is conducted. The hypothesis that are used here are presented
below:
The null hypothesis, H0: Mean petrol price = 115
The alternative hypothesis, HA: Mean petrol price ≠ 115
The table 3 presents the t-test result that contains the mean value of the petrol price,
corresponding t-stat at 95% confidence interval, standard deviation and standard error. The
mean value is 122.50 Australian cent with standard deviation 13.49 Australian cent. The
standard error is 0.43 with 999 degrees of freedom which says the t-test gives the robust
result.
Table 3: T-test to check the mean of petro price
T Test: One
Sample
SUMMARY Alpha 0.05
Count Mean Std
Dev Std Err t df Cohen d Effect r
1000 122.50 13.49 0.43 17.58 999 0.5559 0.4861
T TEST Hyp Mean 115
p-value t-crit lower upper sig
One Tail 8.9E-61 1.65 yes
Two Tail 1.8E-60 1.96 121.66 123.33 yes
The above table presents the p-value for the one tail t-test which is very small (<0.05).
This implies that there is enough evidence at 5% significance level to reject the null
hypothesis which says that the mean petrol price is equal to 115 Australian cent. Now the
mean value lies between the 95% confidence interval and the mean value is greater than 115
STATISTICAL MODELLING
Now, the question is whether the average price of petrol in all service station equals to
115 or not. To chick this a t-test is conducted. The hypothesis that are used here are presented
below:
The null hypothesis, H0: Mean petrol price = 115
The alternative hypothesis, HA: Mean petrol price ≠ 115
The table 3 presents the t-test result that contains the mean value of the petrol price,
corresponding t-stat at 95% confidence interval, standard deviation and standard error. The
mean value is 122.50 Australian cent with standard deviation 13.49 Australian cent. The
standard error is 0.43 with 999 degrees of freedom which says the t-test gives the robust
result.
Table 3: T-test to check the mean of petro price
T Test: One
Sample
SUMMARY Alpha 0.05
Count Mean Std
Dev Std Err t df Cohen d Effect r
1000 122.50 13.49 0.43 17.58 999 0.5559 0.4861
T TEST Hyp Mean 115
p-value t-crit lower upper sig
One Tail 8.9E-61 1.65 yes
Two Tail 1.8E-60 1.96 121.66 123.33 yes
The above table presents the p-value for the one tail t-test which is very small (<0.05).
This implies that there is enough evidence at 5% significance level to reject the null
hypothesis which says that the mean petrol price is equal to 115 Australian cent. Now the
mean value lies between the 95% confidence interval and the mean value is greater than 115
⊘ This is a preview!⊘
Do you want full access?
Subscribe today to unlock all pages.
Trusted by 1+ million students worldwide
6
STATISTICAL MODELLING
Australian cent. So, it can be said that the average petrol price in all service station is greater
than 115 Australian cent (Kim 2015).
Section 3: Price across Brands and ANOVA Test
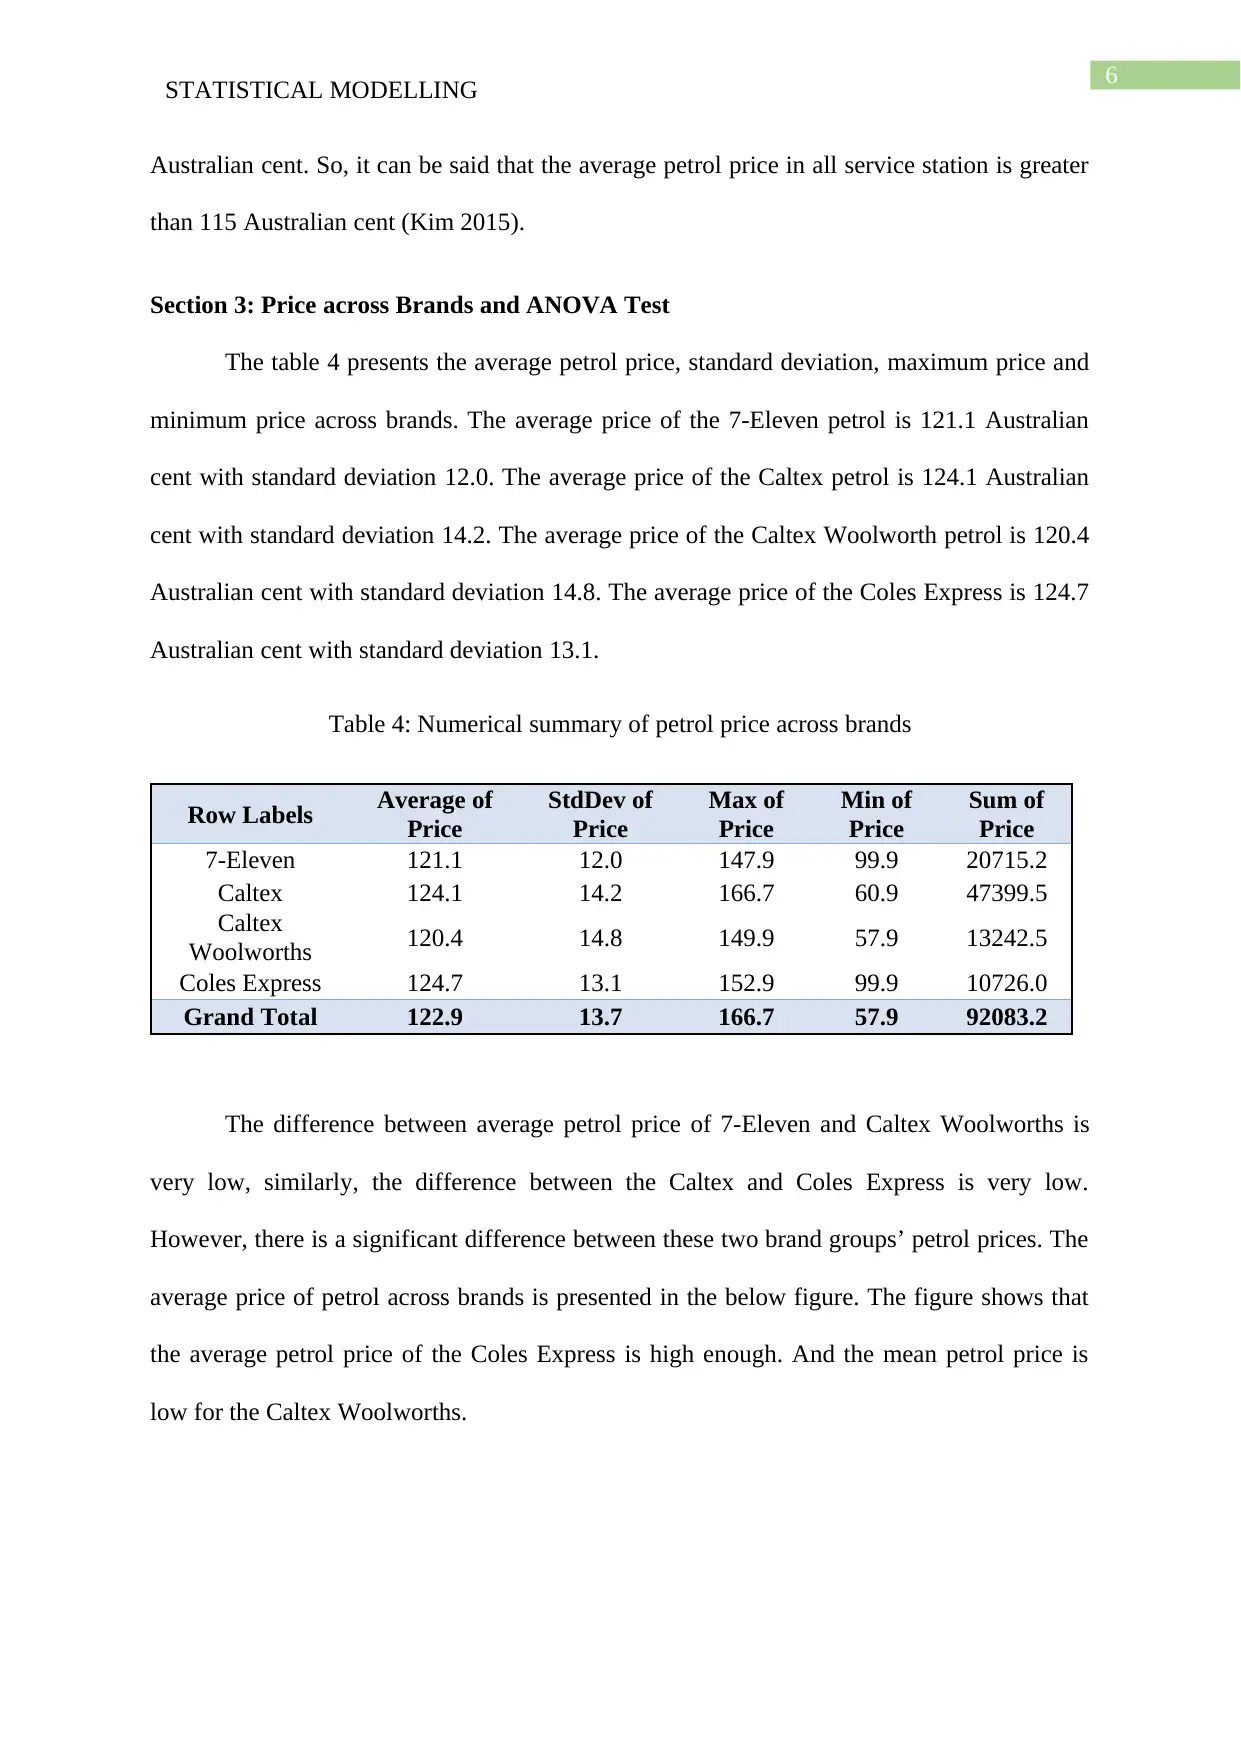
The table 4 presents the average petrol price, standard deviation, maximum price and
minimum price across brands. The average price of the 7-Eleven petrol is 121.1 Australian
cent with standard deviation 12.0. The average price of the Caltex petrol is 124.1 Australian
cent with standard deviation 14.2. The average price of the Caltex Woolworth petrol is 120.4
Australian cent with standard deviation 14.8. The average price of the Coles Express is 124.7
Australian cent with standard deviation 13.1.
Table 4: Numerical summary of petrol price across brands
Row Labels Average of
Price
StdDev of
Price
Max of
Price
Min of
Price
Sum of
Price
7-Eleven 121.1 12.0 147.9 99.9 20715.2
Caltex 124.1 14.2 166.7 60.9 47399.5
Caltex
Woolworths 120.4 14.8 149.9 57.9 13242.5
Coles Express 124.7 13.1 152.9 99.9 10726.0
Grand Total 122.9 13.7 166.7 57.9 92083.2
The difference between average petrol price of 7-Eleven and Caltex Woolworths is
very low, similarly, the difference between the Caltex and Coles Express is very low.
However, there is a significant difference between these two brand groups’ petrol prices. The
average price of petrol across brands is presented in the below figure. The figure shows that
the average petrol price of the Coles Express is high enough. And the mean petrol price is
low for the Caltex Woolworths.
STATISTICAL MODELLING
Australian cent. So, it can be said that the average petrol price in all service station is greater
than 115 Australian cent (Kim 2015).
Section 3: Price across Brands and ANOVA Test
The table 4 presents the average petrol price, standard deviation, maximum price and
minimum price across brands. The average price of the 7-Eleven petrol is 121.1 Australian
cent with standard deviation 12.0. The average price of the Caltex petrol is 124.1 Australian
cent with standard deviation 14.2. The average price of the Caltex Woolworth petrol is 120.4
Australian cent with standard deviation 14.8. The average price of the Coles Express is 124.7
Australian cent with standard deviation 13.1.
Table 4: Numerical summary of petrol price across brands
Row Labels Average of
Price
StdDev of
Price
Max of
Price
Min of
Price
Sum of
Price
7-Eleven 121.1 12.0 147.9 99.9 20715.2
Caltex 124.1 14.2 166.7 60.9 47399.5
Caltex
Woolworths 120.4 14.8 149.9 57.9 13242.5
Coles Express 124.7 13.1 152.9 99.9 10726.0
Grand Total 122.9 13.7 166.7 57.9 92083.2
The difference between average petrol price of 7-Eleven and Caltex Woolworths is
very low, similarly, the difference between the Caltex and Coles Express is very low.
However, there is a significant difference between these two brand groups’ petrol prices. The
average price of petrol across brands is presented in the below figure. The figure shows that
the average petrol price of the Coles Express is high enough. And the mean petrol price is
low for the Caltex Woolworths.
Paraphrase This Document
Need a fresh take? Get an instant paraphrase of this document with our AI Paraphraser
7
STATISTICAL MODELLING
7-Eleven Caltex Caltex Woolworths Coles Express
118
119
120
121
122
123
124
125
126
Average of Price across Brands
Brands
Average price
Figure 2: Column Diagram for the petrol price across brands
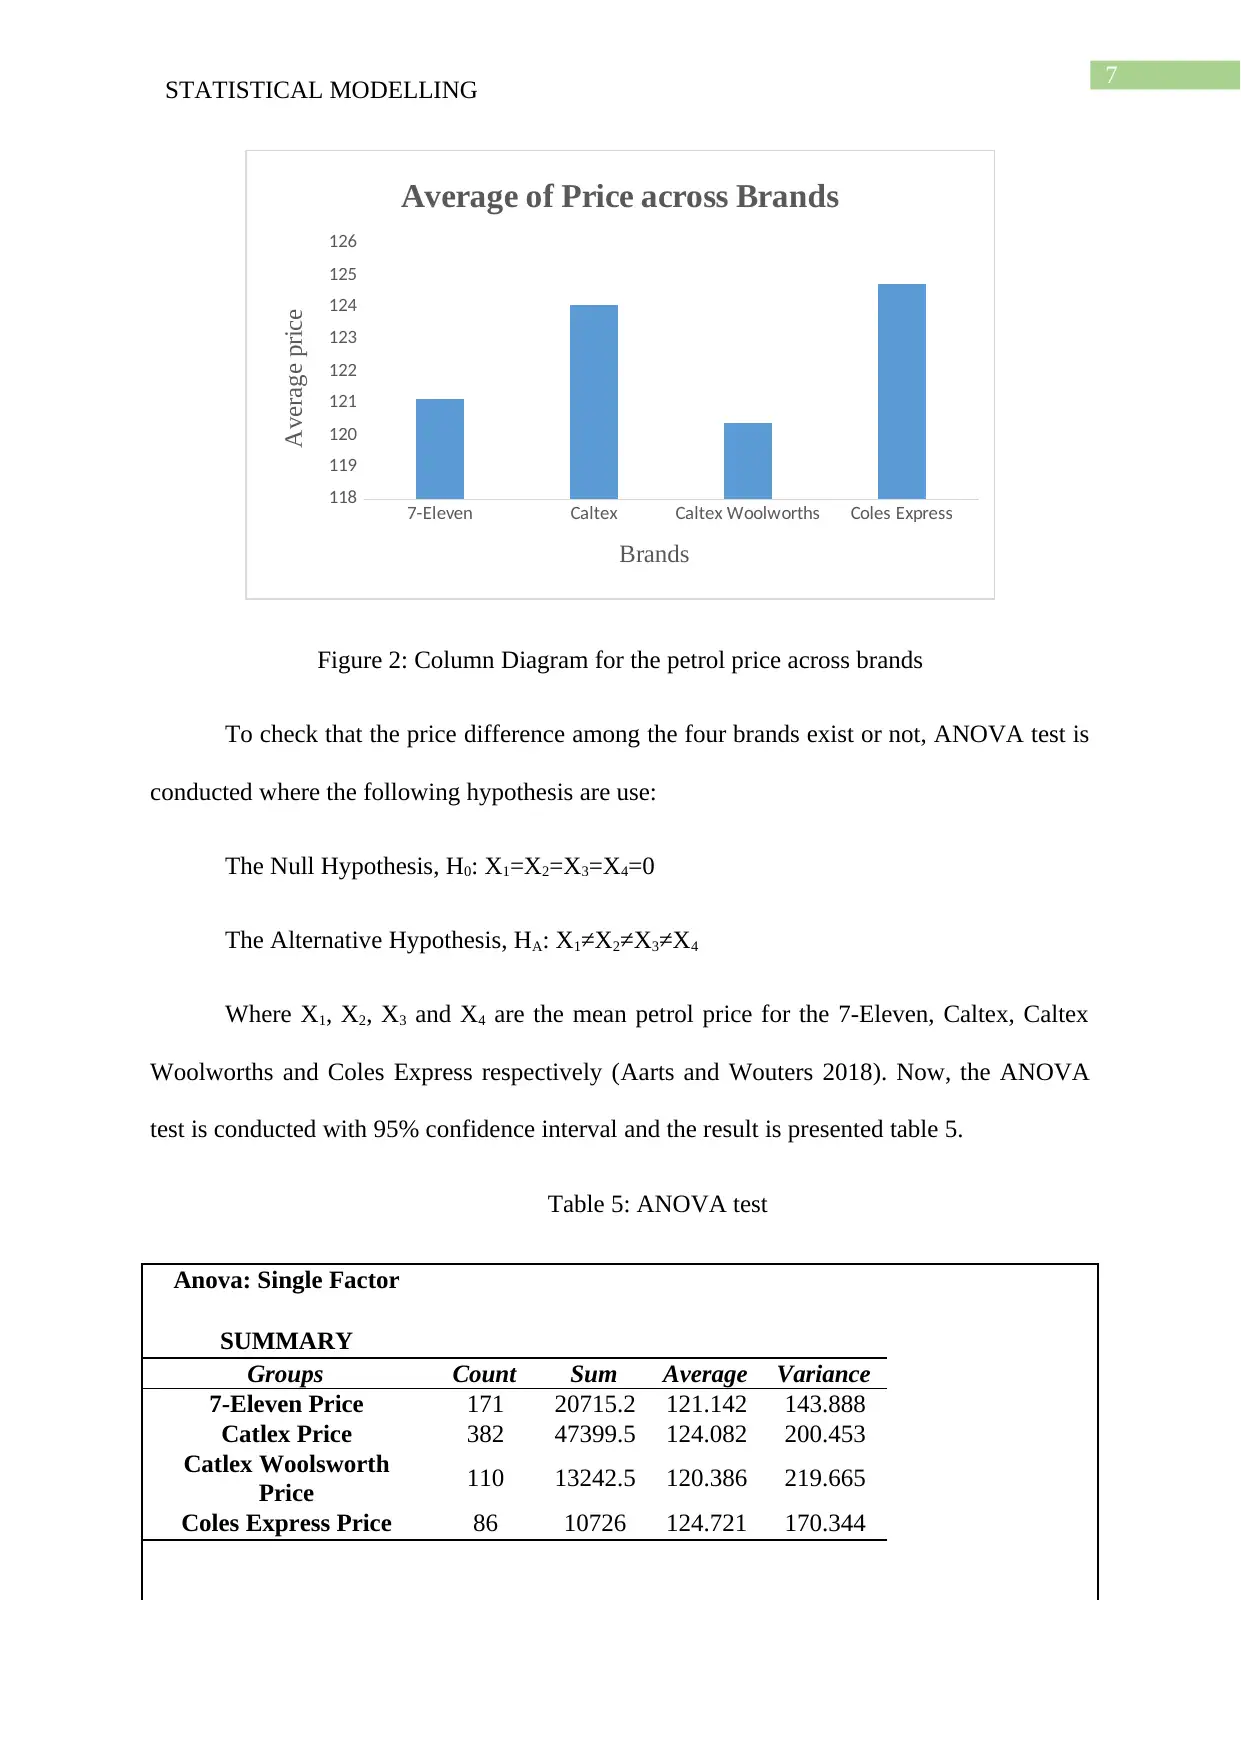
To check that the price difference among the four brands exist or not, ANOVA test is
conducted where the following hypothesis are use:
The Null Hypothesis, H0: X1=X2=X3=X4=0
The Alternative Hypothesis, HA: X1≠X2≠X3≠X4
Where X1, X2, X3 and X4 are the mean petrol price for the 7-Eleven, Caltex, Caltex
Woolworths and Coles Express respectively (Aarts and Wouters 2018). Now, the ANOVA
test is conducted with 95% confidence interval and the result is presented table 5.
Table 5: ANOVA test
Anova: Single Factor
SUMMARY
Groups Count Sum Average Variance
7-Eleven Price 171 20715.2 121.142 143.888
Catlex Price 382 47399.5 124.082 200.453
Catlex Woolsworth
Price 110 13242.5 120.386 219.665
Coles Express Price 86 10726 124.721 170.344
STATISTICAL MODELLING
7-Eleven Caltex Caltex Woolworths Coles Express
118
119
120
121
122
123
124
125
126
Average of Price across Brands
Brands
Average price
Figure 2: Column Diagram for the petrol price across brands
To check that the price difference among the four brands exist or not, ANOVA test is
conducted where the following hypothesis are use:
The Null Hypothesis, H0: X1=X2=X3=X4=0
The Alternative Hypothesis, HA: X1≠X2≠X3≠X4
Where X1, X2, X3 and X4 are the mean petrol price for the 7-Eleven, Caltex, Caltex
Woolworths and Coles Express respectively (Aarts and Wouters 2018). Now, the ANOVA
test is conducted with 95% confidence interval and the result is presented table 5.
Table 5: ANOVA test
Anova: Single Factor
SUMMARY
Groups Count Sum Average Variance
7-Eleven Price 171 20715.2 121.142 143.888
Catlex Price 382 47399.5 124.082 200.453
Catlex Woolsworth
Price 110 13242.5 120.386 219.665
Coles Express Price 86 10726 124.721 170.344
8
STATISTICAL MODELLING
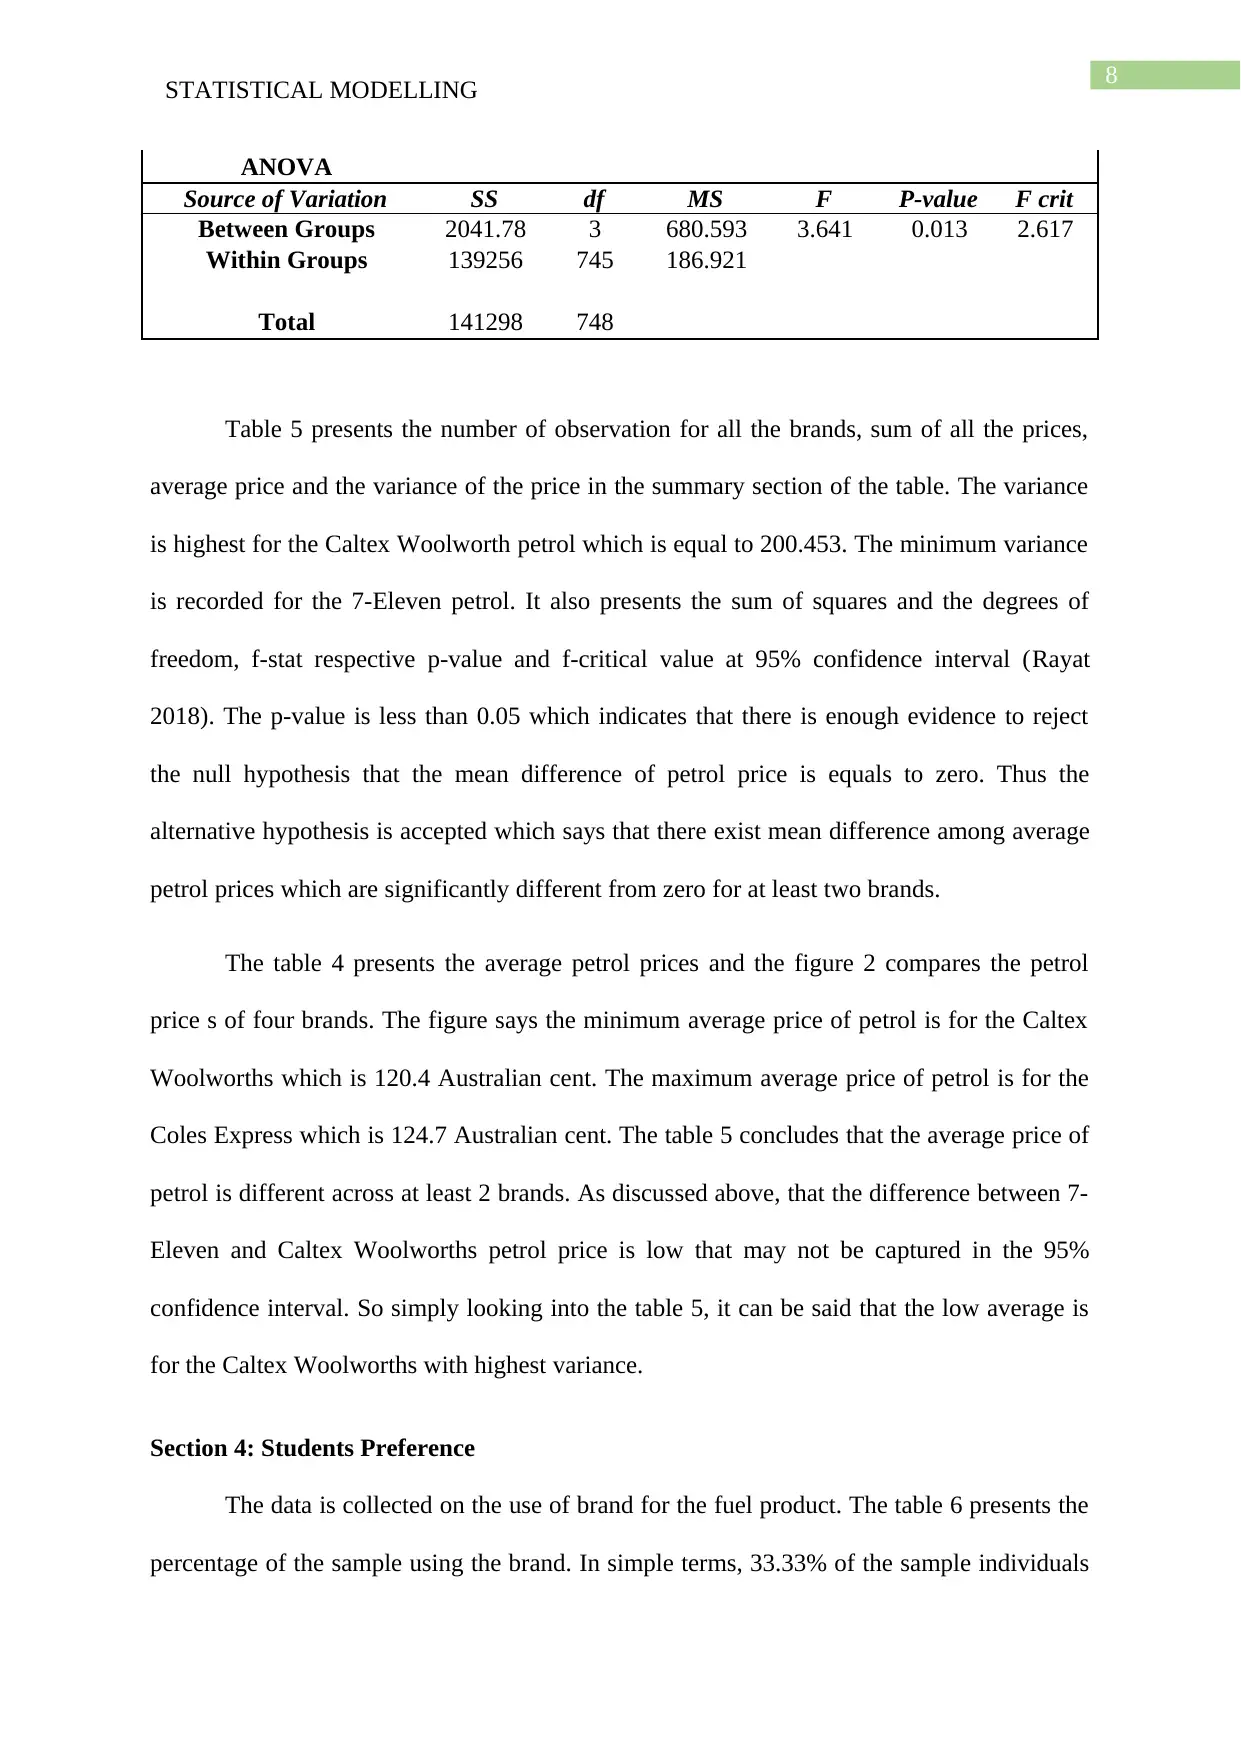
ANOVA
Source of Variation SS df MS F P-value F crit
Between Groups 2041.78 3 680.593 3.641 0.013 2.617
Within Groups 139256 745 186.921
Total 141298 748
Table 5 presents the number of observation for all the brands, sum of all the prices,
average price and the variance of the price in the summary section of the table. The variance
is highest for the Caltex Woolworth petrol which is equal to 200.453. The minimum variance
is recorded for the 7-Eleven petrol. It also presents the sum of squares and the degrees of
freedom, f-stat respective p-value and f-critical value at 95% confidence interval (Rayat
2018). The p-value is less than 0.05 which indicates that there is enough evidence to reject
the null hypothesis that the mean difference of petrol price is equals to zero. Thus the
alternative hypothesis is accepted which says that there exist mean difference among average
petrol prices which are significantly different from zero for at least two brands.
The table 4 presents the average petrol prices and the figure 2 compares the petrol
price s of four brands. The figure says the minimum average price of petrol is for the Caltex
Woolworths which is 120.4 Australian cent. The maximum average price of petrol is for the
Coles Express which is 124.7 Australian cent. The table 5 concludes that the average price of
petrol is different across at least 2 brands. As discussed above, that the difference between 7-
Eleven and Caltex Woolworths petrol price is low that may not be captured in the 95%
confidence interval. So simply looking into the table 5, it can be said that the low average is
for the Caltex Woolworths with highest variance.
Section 4: Students Preference
The data is collected on the use of brand for the fuel product. The table 6 presents the
percentage of the sample using the brand. In simple terms, 33.33% of the sample individuals
STATISTICAL MODELLING
ANOVA
Source of Variation SS df MS F P-value F crit
Between Groups 2041.78 3 680.593 3.641 0.013 2.617
Within Groups 139256 745 186.921
Total 141298 748
Table 5 presents the number of observation for all the brands, sum of all the prices,
average price and the variance of the price in the summary section of the table. The variance
is highest for the Caltex Woolworth petrol which is equal to 200.453. The minimum variance
is recorded for the 7-Eleven petrol. It also presents the sum of squares and the degrees of
freedom, f-stat respective p-value and f-critical value at 95% confidence interval (Rayat
2018). The p-value is less than 0.05 which indicates that there is enough evidence to reject
the null hypothesis that the mean difference of petrol price is equals to zero. Thus the
alternative hypothesis is accepted which says that there exist mean difference among average
petrol prices which are significantly different from zero for at least two brands.
The table 4 presents the average petrol prices and the figure 2 compares the petrol
price s of four brands. The figure says the minimum average price of petrol is for the Caltex
Woolworths which is 120.4 Australian cent. The maximum average price of petrol is for the
Coles Express which is 124.7 Australian cent. The table 5 concludes that the average price of
petrol is different across at least 2 brands. As discussed above, that the difference between 7-
Eleven and Caltex Woolworths petrol price is low that may not be captured in the 95%
confidence interval. So simply looking into the table 5, it can be said that the low average is
for the Caltex Woolworths with highest variance.
Section 4: Students Preference
The data is collected on the use of brand for the fuel product. The table 6 presents the
percentage of the sample using the brand. In simple terms, 33.33% of the sample individuals
⊘ This is a preview!⊘
Do you want full access?
Subscribe today to unlock all pages.
Trusted by 1+ million students worldwide
9
STATISTICAL MODELLING
uses 7-Eleven brand for petrol. Thus the Caltex and Caltex Woolworths is used by 23.33%
and 43.33% of the sample individuals. The maximum individuals uses Caltex Woolworth.
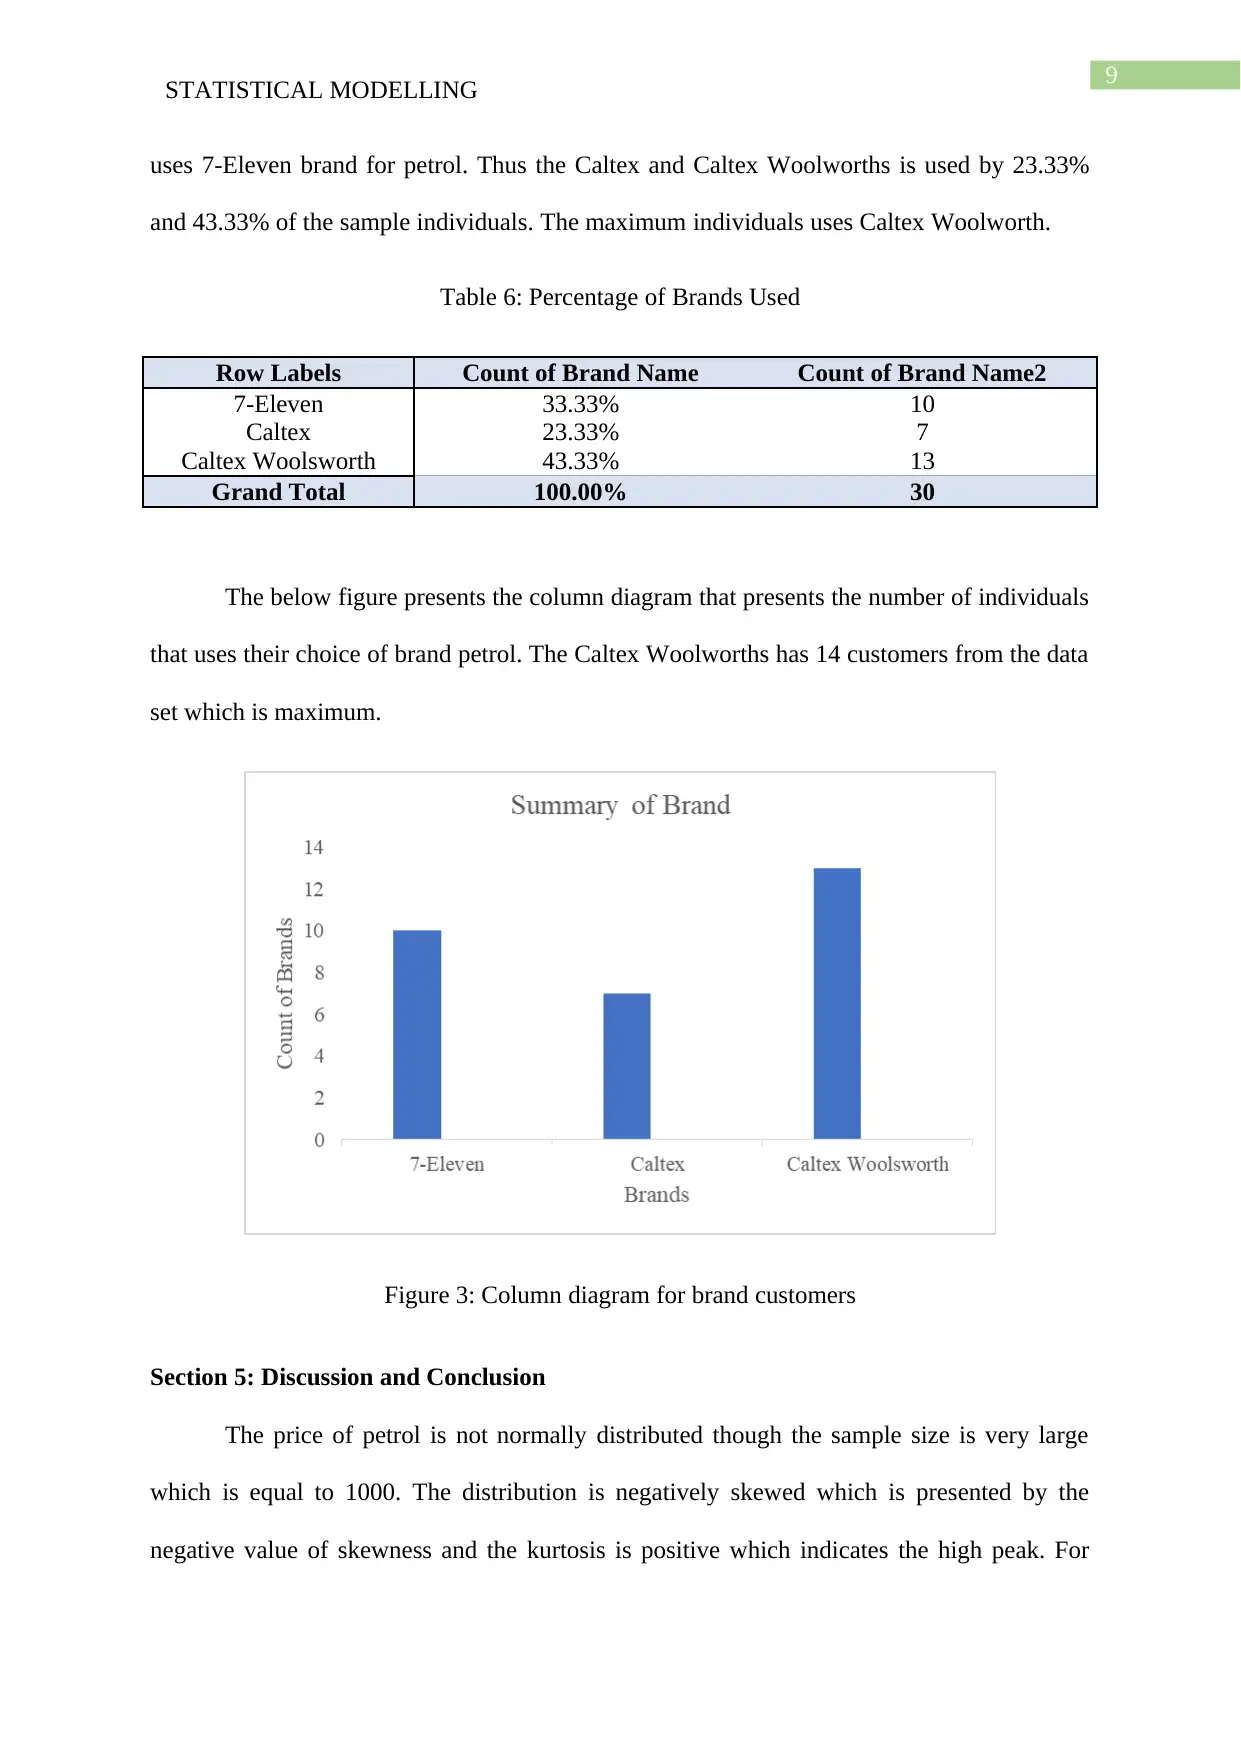
Table 6: Percentage of Brands Used
Row Labels Count of Brand Name Count of Brand Name2
7-Eleven 33.33% 10
Caltex 23.33% 7
Caltex Woolsworth 43.33% 13
Grand Total 100.00% 30
The below figure presents the column diagram that presents the number of individuals
that uses their choice of brand petrol. The Caltex Woolworths has 14 customers from the data
set which is maximum.
Figure 3: Column diagram for brand customers
Section 5: Discussion and Conclusion
The price of petrol is not normally distributed though the sample size is very large
which is equal to 1000. The distribution is negatively skewed which is presented by the
negative value of skewness and the kurtosis is positive which indicates the high peak. For
STATISTICAL MODELLING
uses 7-Eleven brand for petrol. Thus the Caltex and Caltex Woolworths is used by 23.33%
and 43.33% of the sample individuals. The maximum individuals uses Caltex Woolworth.
Table 6: Percentage of Brands Used
Row Labels Count of Brand Name Count of Brand Name2
7-Eleven 33.33% 10
Caltex 23.33% 7
Caltex Woolsworth 43.33% 13
Grand Total 100.00% 30
The below figure presents the column diagram that presents the number of individuals
that uses their choice of brand petrol. The Caltex Woolworths has 14 customers from the data
set which is maximum.
Figure 3: Column diagram for brand customers
Section 5: Discussion and Conclusion
The price of petrol is not normally distributed though the sample size is very large
which is equal to 1000. The distribution is negatively skewed which is presented by the
negative value of skewness and the kurtosis is positive which indicates the high peak. For
Paraphrase This Document
Need a fresh take? Get an instant paraphrase of this document with our AI Paraphraser
10
STATISTICAL MODELLING
these high peak, the mode value is high. Though the median and mean are quit same, the
difference is very low. The mean value of the petrol price greater than $115 Australian cent
in all service stations. However the mean petrol price differs across brands. The average
petrol price is low for the Caltex Woolworths. Moreover, the primary data explains that most
of the students prefer Caltex Woolworths petrol. Depending on the above discussion it can be
concluded that the students uses the petrol that is cheaper and the student spends more than
115 Australia cents on the petrol.
The study shows that the students have to spend greater than 115 Australian sent.
However the data was small so the result is not robust in this case. The data should be large
enough to make a concrete conclusion. The petrol price data is also negatively skewed that
should be taken care of. The analysis does not incorporated the fuel code. In such further
study, it can be measured the average price for the specific type of fuel of different brands.
11
STATISTICAL MODELLING
Reference and Bibliography
Aarts, S. and Wouters, E., 2018. De t-toets en de analysis of variance,
ANOVA. Podosophia, 26(1), pp.28-33.
Byrne, D.P., Nah, J.S. and Xue, P., 2018. Australia Has the World's Best Petrol Price Data:
FuelWatch and FuelCheck. Australian Economic Review, 51(4), pp.564-577.
Chihara, N., Madi, A., Kondo, T., Zhang, H., Acharya, N., Singer, M., Nyman, J.,
Marjanovic, N.D., Kowalczyk, M.S., Wang, C. and Kurtulus, S., 2018. Induction and
transcriptional regulation of the co-inhibitory gene module in T cells. Nature, 558(7710),
pp.454-459.
Delacre, M., Lakens, D., Mora, Y. and Leys, C., 2018. Taking Parametric Assumptions
Seriously Arguments for the Use of Welch’s F-test Instead of the Classical F-test in One-way
ANOVA.
Escribano, A. and Torrado, M. (2018). Nonlinear and asymmetric pricing behaviour in the
Spanish gasoline market. Studies in Nonlinear Dynamics & Econometrics, 22(5).
Giavridis, T., van der Stegen, S.J., Eyquem, J., Hamieh, M., Piersigilli, A. and Sadelain, M.,
2018. CAR T cell–induced cytokine release syndrome is mediated by macrophages and
abated by IL-1 blockade. Nature medicine, 24(6), p.731.
Griffin, J., Lall, R., Bruce, J., Withers, E., Finnegan, S., Lamb, S.E., Underwood, M., Martin,
F., Yardley, L., Skelton, D. and Willett, K., 2019. Comparison of alternative falls data
collection methods in the Prevention of Falls Injury Trial (PreFIT). Journal of clinical
epidemiology, 106, pp.32-40.
⊘ This is a preview!⊘
Do you want full access?
Subscribe today to unlock all pages.
Trusted by 1+ million students worldwide
1 out of 13
Related Documents


Your All-in-One AI-Powered Toolkit for Academic Success.
+13062052269
info@desklib.com
Available 24*7 on WhatsApp / Email
![[object Object]](/_next/static/media/star-bottom.7253800d.svg)
Unlock your academic potential
Copyright © 2020–2026 A2Z Services. All Rights Reserved. Developed and managed by ZUCOL.