Statistical Project Assignment ECON7300: Regression Model and Analysis

Verified

Added on  2023/06/03

|10
|1167
|463
Homework Assignment
AI Summary
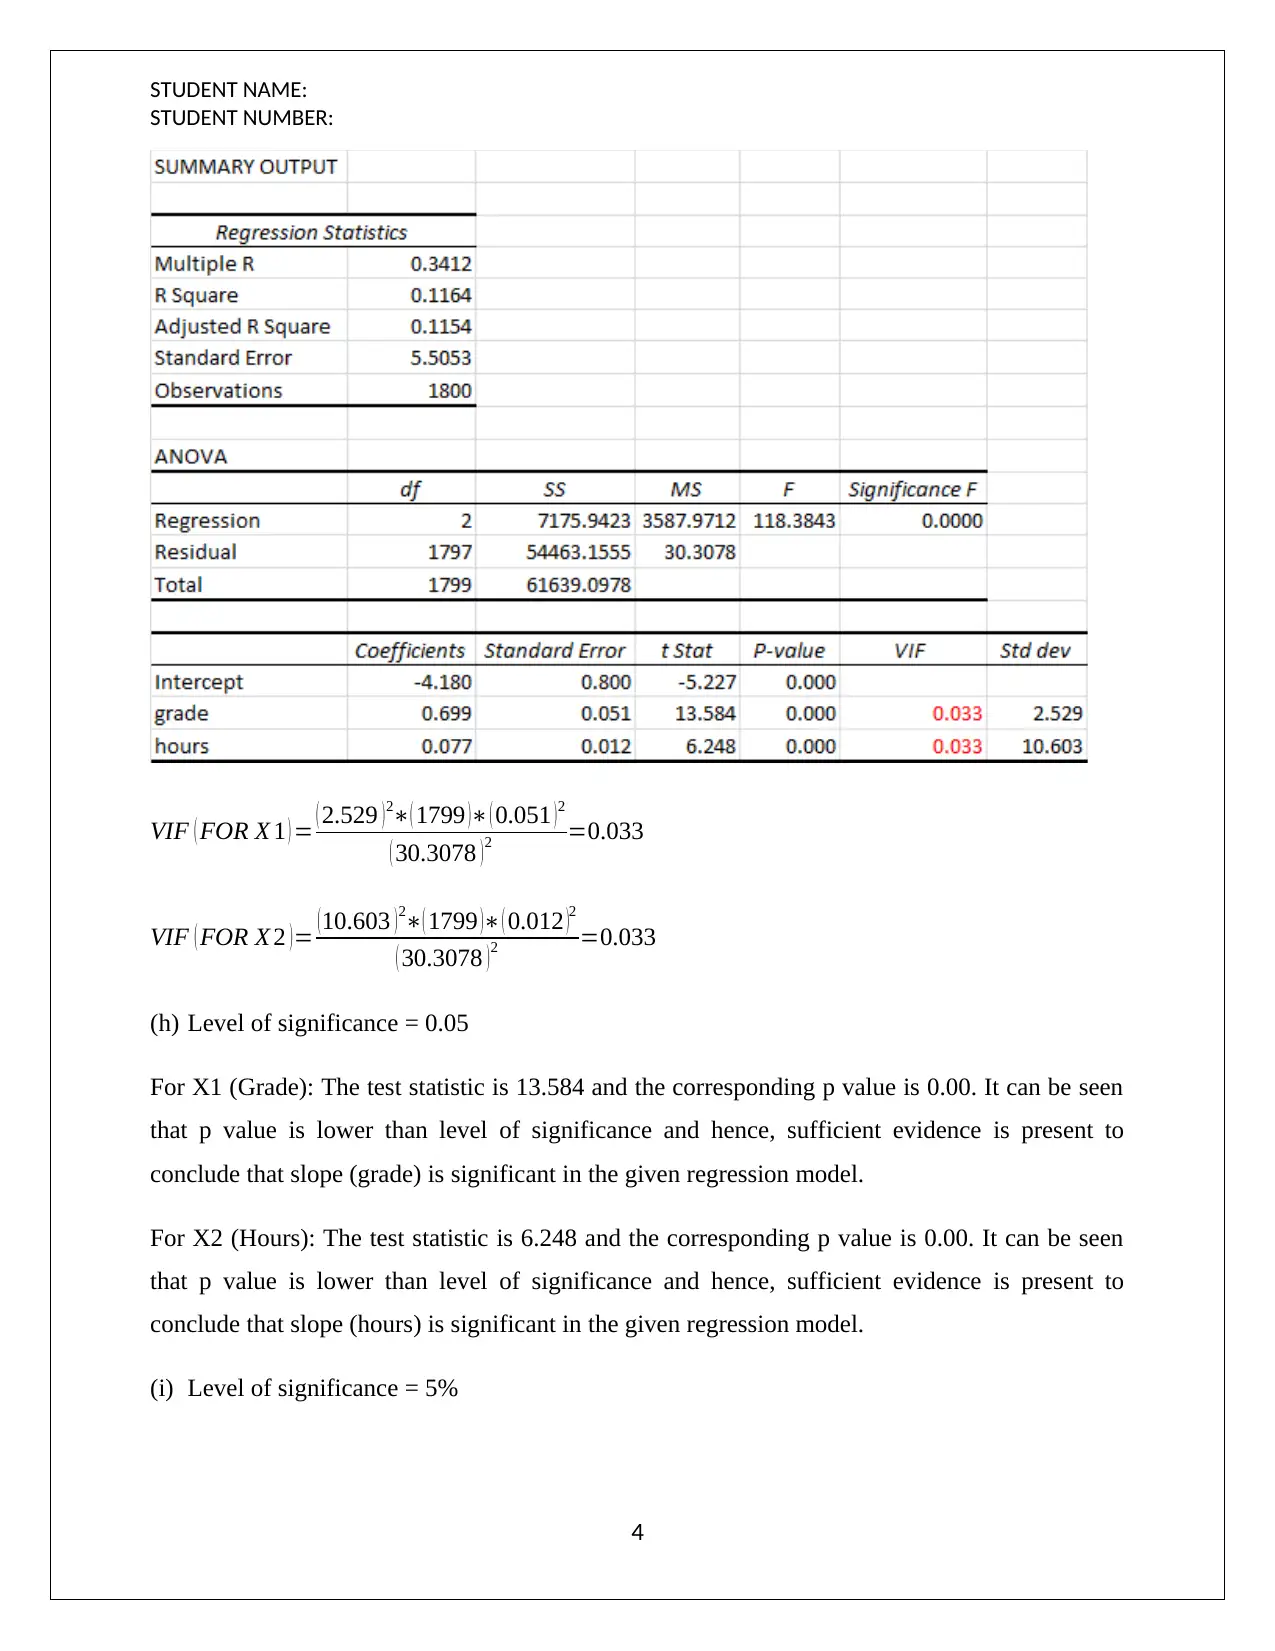
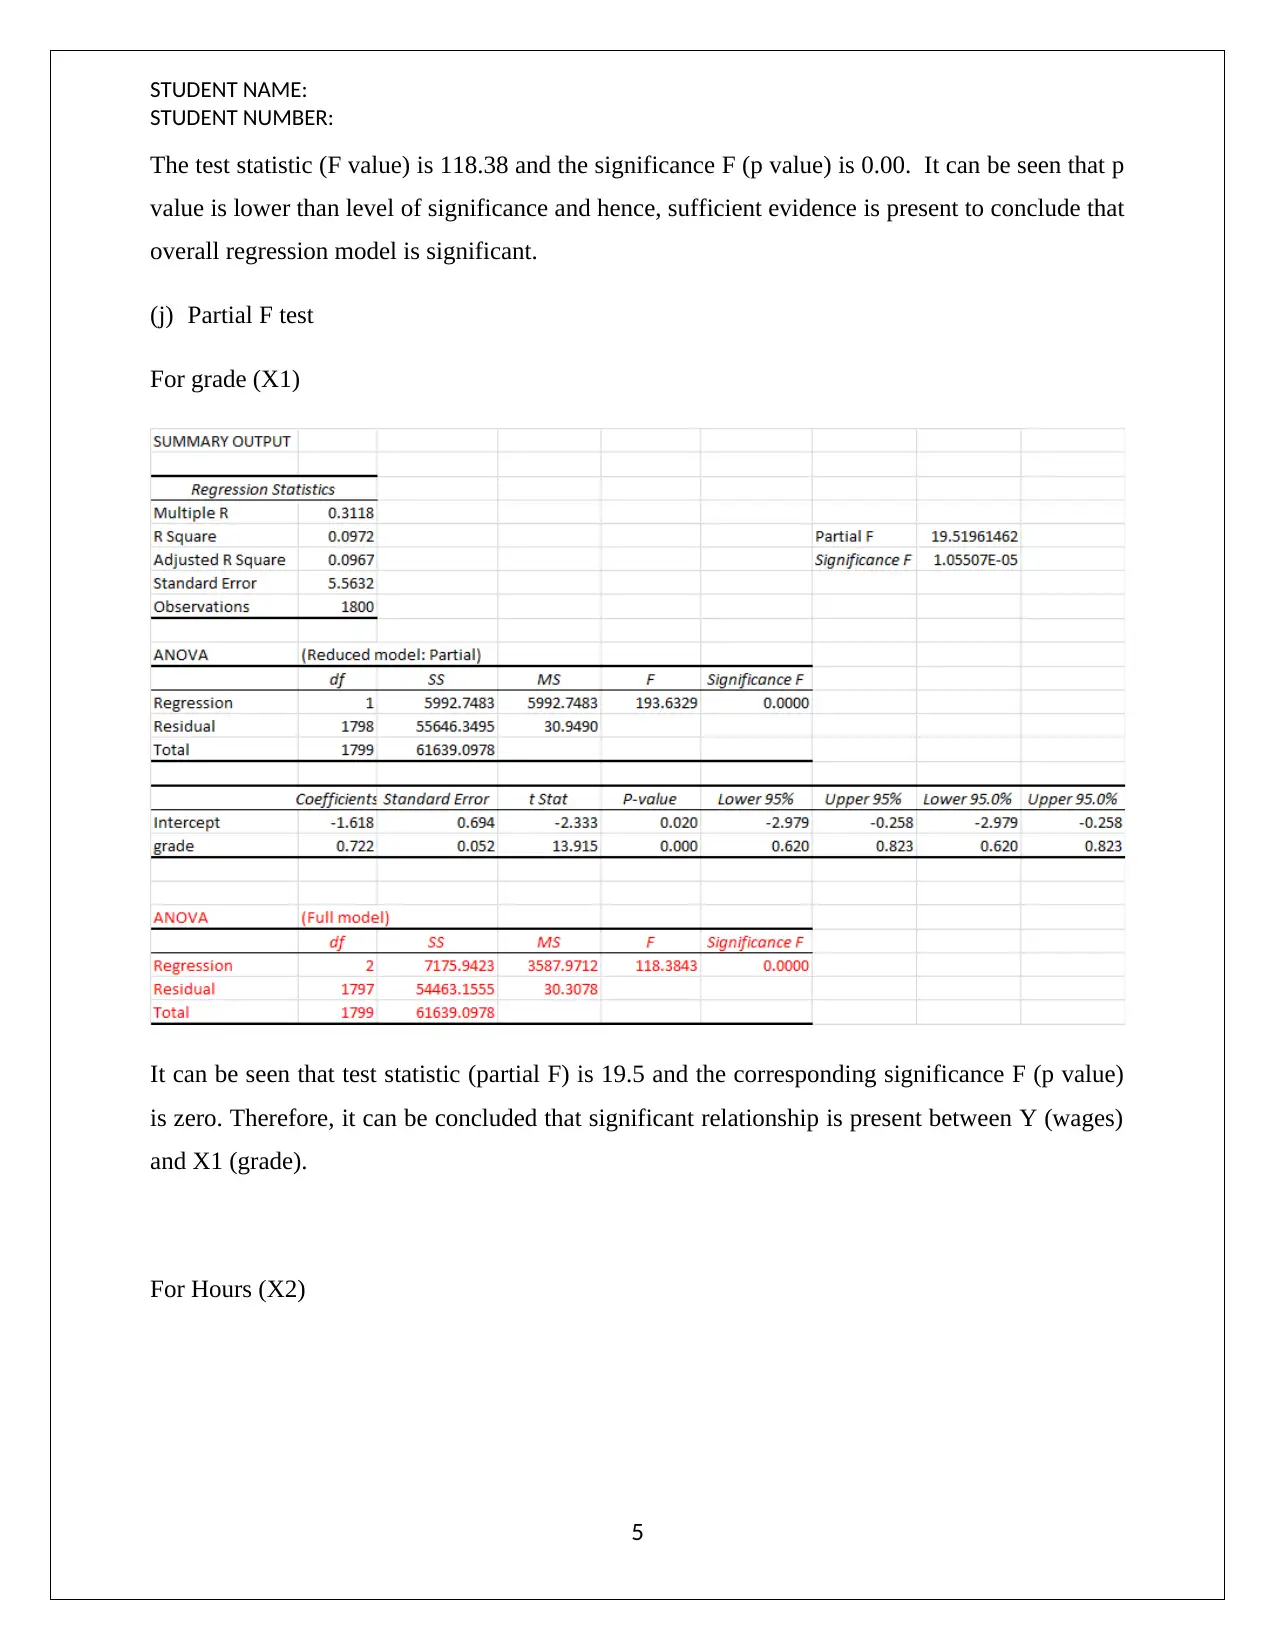
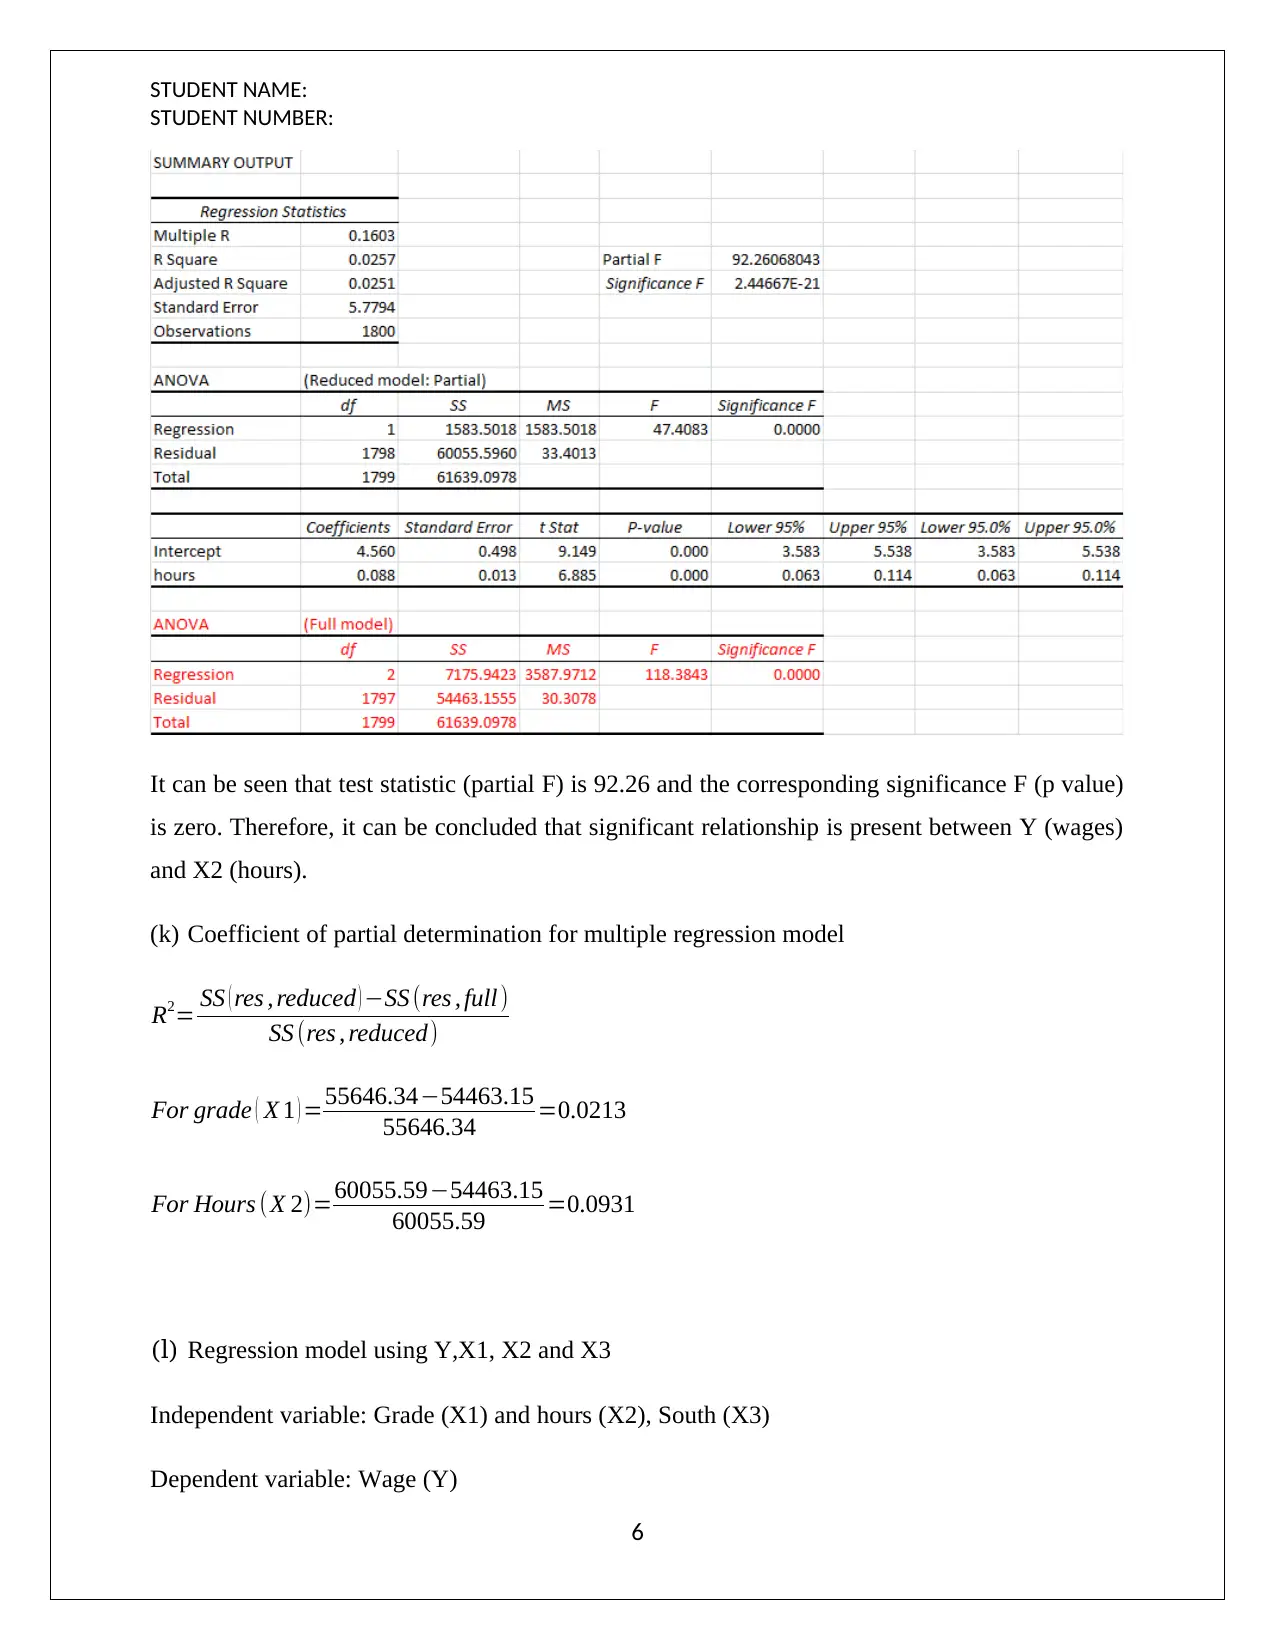
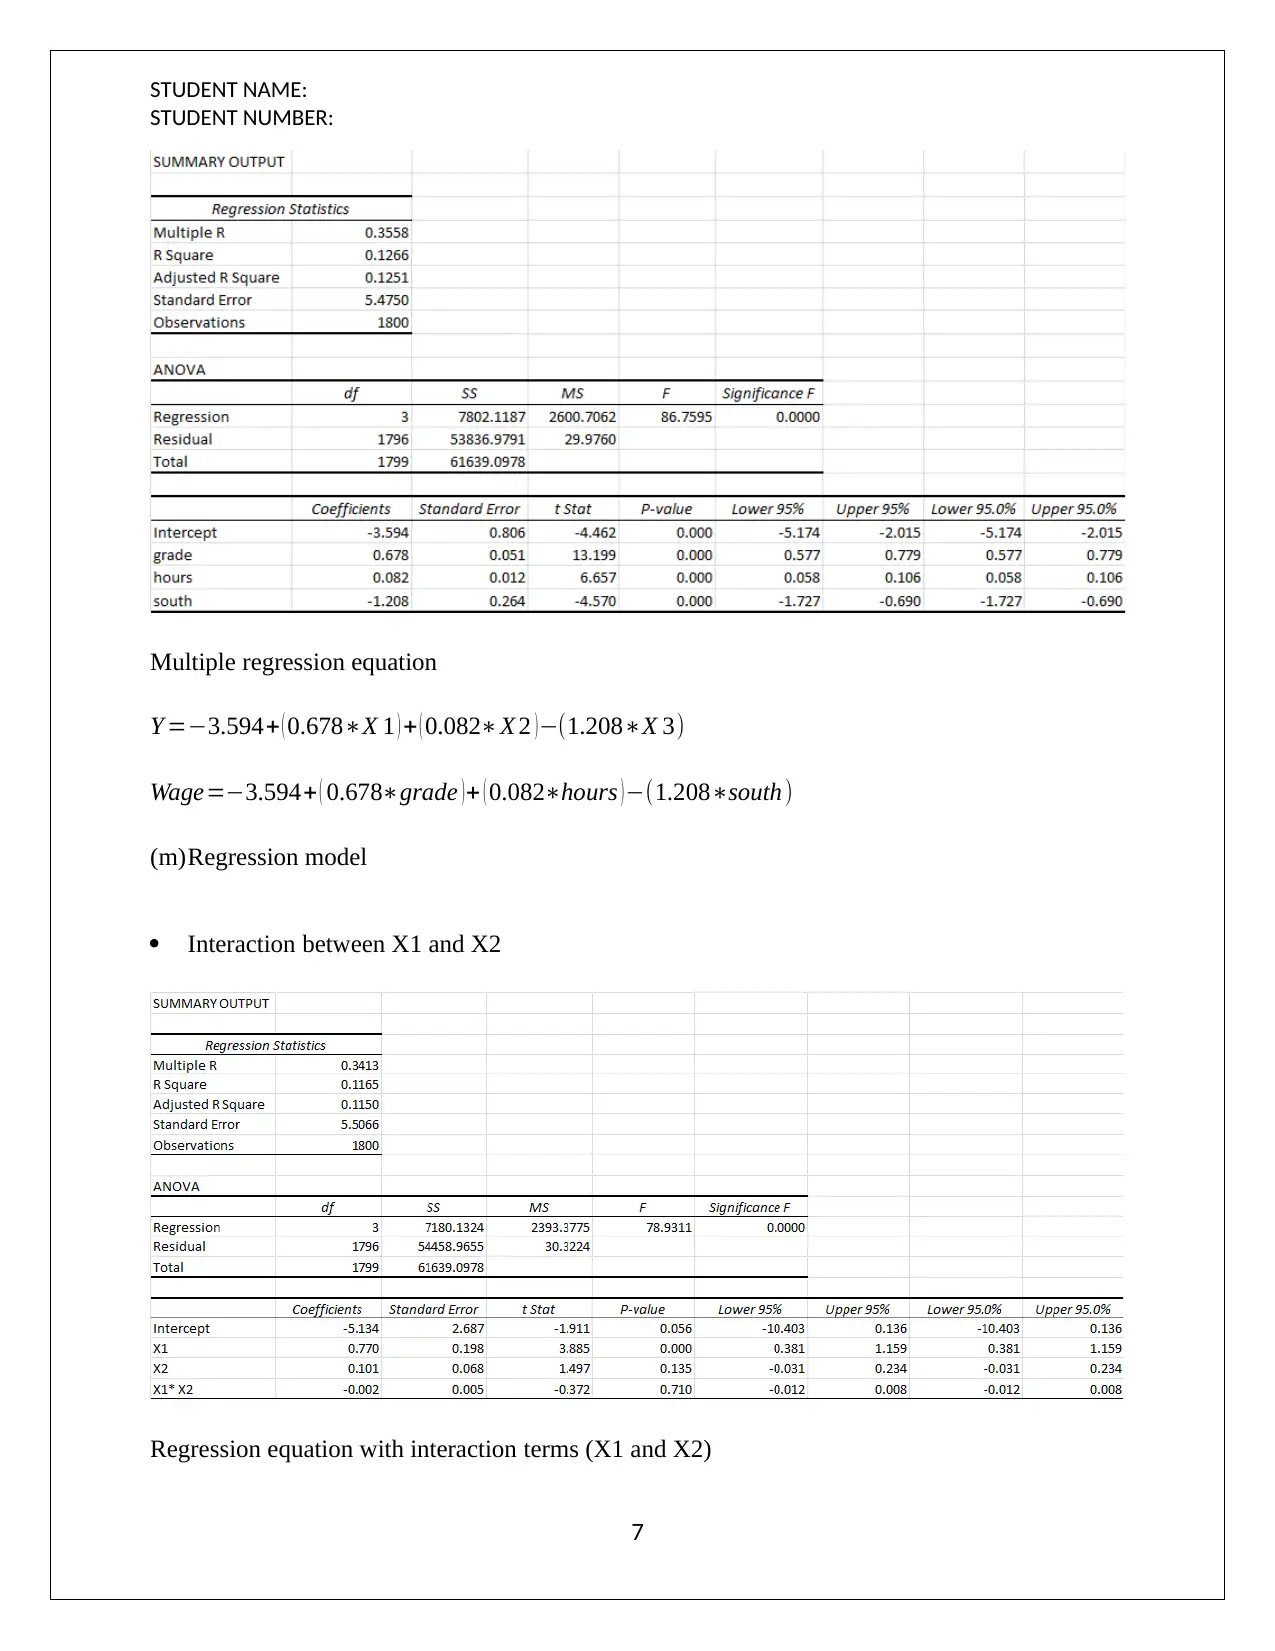
This document presents a comprehensive solution to a statistical project assignment, focusing on regression analysis. The project analyzes the relationship between wage and various independent variables, including grade and hours worked. It includes the development of multiple regression equations, interpretation of coefficients, and calculation of predicted wages. The solution further explores confidence intervals, prediction intervals, and residual plots to assess the model's validity. Variance Inflation Factors (VIF) are calculated to assess multicollinearity. Hypothesis tests, including F-tests and partial F-tests, are conducted to determine the significance of the overall model and individual variables. The project also examines the coefficient of partial determination and explores regression models with interaction terms. The analysis involves evaluating the impact of interaction terms on the model's performance and statistical significance.
Document Page
Statistical Project Assignment
ECON7300
STUDENT NAME/ID
[Pick the date]
tabler-icon-diamond-filled.svg

Paraphrase This Document

Need a fresh take? Get an instant paraphrase of this document with our AI Paraphraser
Document Page
STUDENT NAME:
STUDENT NUMBER:
(a) Regression model
Independent variable: Grade (X1) and hours (X2)
Dependent variable: Wage (Y)
Multiple regression equation
Y =4.180+ ( 0.699X 1 ) +( 0.077X 2)
Wage=4.180+ ( 0.699Grade )+(0.077Hours)
(b) The grade slope implies that the wage would increase by $ 0.699 if there is an increase in the
grade by 1 unit. Also, the hours slope implies that the wage increases by $ 0.077 if there is an
increase in hour by 1 unit.
(c) The wage (Y) when grade (X1) =12 and hours (X2) =34
Y =4.180+ ( 0.699X 1 ) +( 0.077X 2)
Y =4.180+ ( 0.69912 ) + ( 0.07734 )=6.8131
1
Document Page
STUDENT NAME:
STUDENT NUMBER:
(d) 95% confidence interval of the mean Y or employed women when X1 =12, X2 =34
Lower value of the interval=5.748+ ( 0.598 X 1 ) + ( 0.053 X 2 )
Upper value of theinterval=2.612+ ( 0.800 X 1 ) + ( 0.101 X 2 )
Now, X1 =12, X2 =34
Lower limit of 95% confidence interval = 5.748+ ( 0.59812 ) + ( 0.05334 ) =3.216
Upper limit of 95% confidence interval = 2.612+ ( 0.80012 ) + ( 0.10134 )=10.411
Therefore, 95% confidence interval [3.216 10.411]
(e) 95% prediction interval of the mean Y or employed women when X1 =12, X2 =34
Predicted y=4.180+ ( 0.69912 )+ ( 0.07734 )=6.8131
Margin of error (M.E.) = t value * Standard error of prediction
Upper limit of 95% prediction interval = Predicted y value + M.E.
Lower limit of 95% prediction interval = Predicted y value - M.E.
Hence, the 95% prediction interval = [-3.9872 17.6136]
(f) Residual plots
2
Document Page
STUDENT NAME:
STUDENT NUMBER:
0 2 4 6 8 10 12 14 16 18 20
-20
-10
0
10
20
30
40
Grade Residual Plot
grade
Residuals
0 10 20 30 40 50 60 70 80 90
-20
-10
0
10
20
30
40
Hours Residual Plot
hours
Residuals
Considering the random manner in which the residuals are placed, it implies that the residuals are
normally distributed which is one of the key requirements of linear regression model.
(g) Variance inflation factor (VIF) for each of the independent variable
3
tabler-icon-diamond-filled.svg

Paraphrase This Document

Need a fresh take? Get an instant paraphrase of this document with our AI Paraphraser
Document Page
STUDENT NAME:
STUDENT NUMBER:
VIF ( FOR X 1 ) = ( 2.529 ) 2( 1799 ) ( 0.051 ) 2
( 30.3078 ) 2 =0.033
VIF ( FOR X 2 )= (10.603 )2( 1799 ) ( 0.012 )2
( 30.3078 )2 =0.033
(h) Level of significance = 0.05
For X1 (Grade): The test statistic is 13.584 and the corresponding p value is 0.00. It can be seen
that p value is lower than level of significance and hence, sufficient evidence is present to
conclude that slope (grade) is significant in the given regression model.
For X2 (Hours): The test statistic is 6.248 and the corresponding p value is 0.00. It can be seen
that p value is lower than level of significance and hence, sufficient evidence is present to
conclude that slope (hours) is significant in the given regression model.
(i) Level of significance = 5%
4
Document Page
STUDENT NAME:
STUDENT NUMBER:
The test statistic (F value) is 118.38 and the significance F (p value) is 0.00. It can be seen that p
value is lower than level of significance and hence, sufficient evidence is present to conclude that
overall regression model is significant.
(j) Partial F test
For grade (X1)
It can be seen that test statistic (partial F) is 19.5 and the corresponding significance F (p value)
is zero. Therefore, it can be concluded that significant relationship is present between Y (wages)
and X1 (grade).
For Hours (X2)
5
Document Page
STUDENT NAME:
STUDENT NUMBER:
It can be seen that test statistic (partial F) is 92.26 and the corresponding significance F (p value)
is zero. Therefore, it can be concluded that significant relationship is present between Y (wages)
and X2 (hours).
(k) Coefficient of partial determination for multiple regression model
R2= SS ( res , reduced ) SS (res , full )
SS (res , reduced)
For grade ( X 1 ) =55646.3454463.15
55646.34 =0.0213
For Hours (X 2)=60055.5954463.15
60055.59 =0.0931
(l) Regression model using Y,X1, X2 and X3
Independent variable: Grade (X1) and hours (X2), South (X3)
Dependent variable: Wage (Y)
6
tabler-icon-diamond-filled.svg

Paraphrase This Document

Need a fresh take? Get an instant paraphrase of this document with our AI Paraphraser
Document Page
STUDENT NAME:
STUDENT NUMBER:
Multiple regression equation
Y =3.594+ ( 0.678X 1 ) + ( 0.082X 2 )(1.208X 3)
Wage=3.594+ ( 0.678grade ) + ( 0.082hours ) (1.208south)
(m)Regression model
Interaction between X1 and X2
Regression equation with interaction terms (X1 and X2)
7
Document Page
STUDENT NAME:
STUDENT NUMBER:
Y =5.134+ ( 0.770 X 1 ) + ( 0.101 X 2 ) ( 0.002 ( X 1X 2 ) )
Interaction between X1 and X3
Regression equation with interaction terms (X1 and X3)
Y =0.892+ ( 0.699 X 1 ) ( 1.205 X 3 ) + ( 0.012 ( X 1X 3 ) )
Interaction between X2 and X3
8
Document Page
STUDENT NAME:
STUDENT NUMBER:
Regression equation with interaction terms (X2 and X3)
Y =4.478+ ( 0.108 X 2 ) ( 0.077 X 3 ) ( 0.038 ( X 2X 3 ) )
(n) Level of significance =5%
Partial F test
Reduced model (taking X1, X2 and X3)
Full model (taking, X1,X2, X3 and X1* X2, X1*X3, X2*X3)
Partial F = (7950.545-7802.118)/29.92673 = 2.4798
It can be seen from the above table that significance F (p value) comes out to be 0.0216 which is
lower than level of significance (0.05). Therefore, the conclusion can be drawn that the three
interactions are statistically significantly improve the regression model.
9
chevron_up_icon
1 out of 10
circle_padding
hide_on_mobile
zoom_out_icon
[object Object]