Statistical Report on Producer Price Inflation in UK
VerifiedAdded on 2022/12/27
|9
|1101
|78
AI Summary
This statistical report analyzes the producer price inflation in the UK, focusing on price indices of all manufacturing and selected industries. It examines the average output, excluding certain products, and provides insights into the inflation trends. The report utilizes descriptive statistics and graphs to present the data.
Contribute Materials
Your contribution can guide someone’s learning journey. Share your
documents today.
STATISTICAL REPORT
Secure Best Marks with AI Grader
Need help grading? Try our AI Grader for instant feedback on your assignments.
TABLE OF CONTENTS
INTRODUCTION...........................................................................................................................3
METHODOLOGY..........................................................................................................................3
CALCULATION AND GRAPH.....................................................................................................3
ANALYSIS OF DATA...................................................................................................................6
CONCLUSION................................................................................................................................7
REFERENCES................................................................................................................................8
APPENDIX......................................................................................................................................9
INTRODUCTION
Statistical study is defined as analysing data relating to a problem and then trying to find
solution. The topic being studied in the report is the producer’s price inflation and within it price
indices of all manufacturing and selected industries from UK output will be discussed. Analysis
of price inflation is necessary to be understood as this will assist companies in analysing that
how much inflation is being increased or decreased.
Statistical question
1. What are average number of output including all manufactured product?
2. What are average number of manufactured products but excluding food beverage,
tobacco and petroleum?
3. What is the average output of all manufactured products but in exclusion of duty less
Division 19?
METHODOLOGY
For the present study, use of secondary sources of data was used in order to reach to some
conclusion relating to producer price inflation in UK (Javdanian, 2019). For this study data
relating to price indices of UK output will be analysed with help of this data. The reason for
choosing the selected data is that it will outline the prices of all the manufactured products and
this will assist in analysing the fact that how much inflation is there in prices.
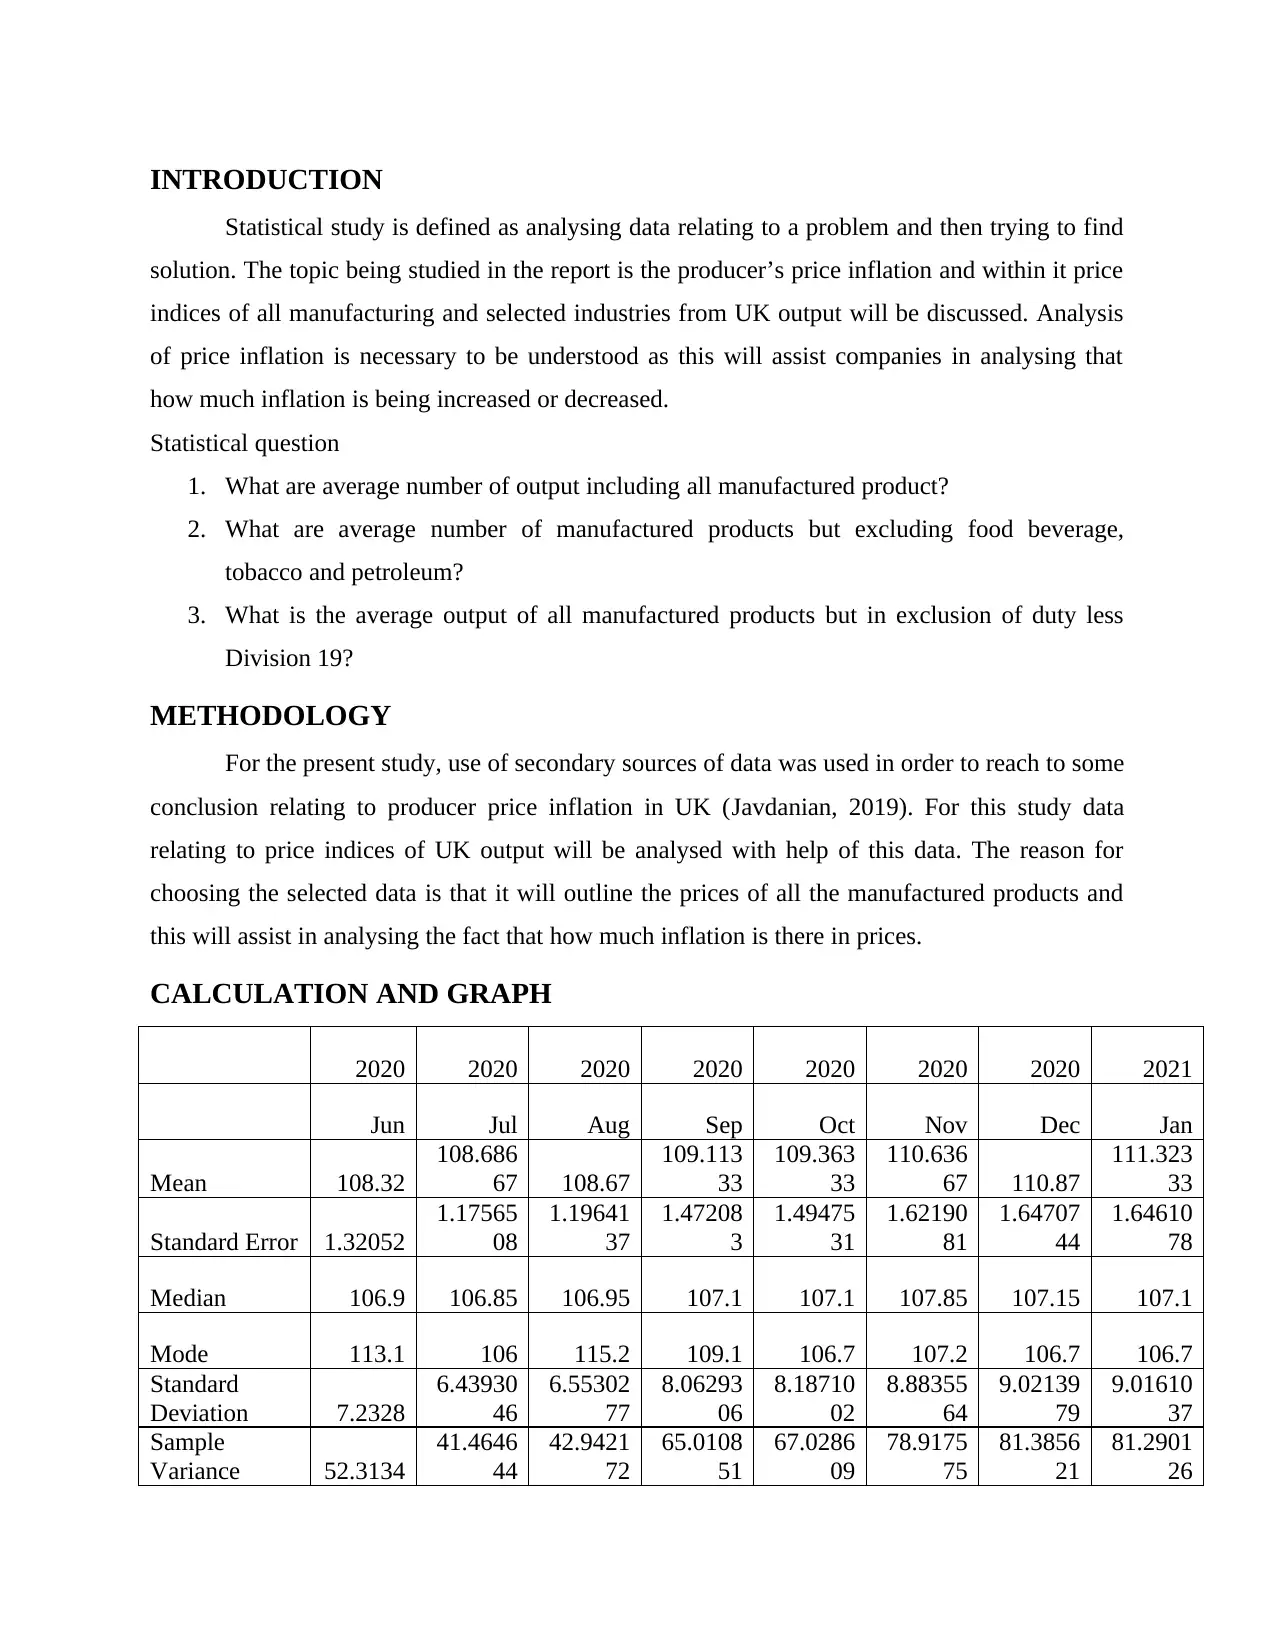
CALCULATION AND GRAPH
2020 2020 2020 2020 2020 2020 2020 2021
Jun Jul Aug Sep Oct Nov Dec Jan
Mean 108.32
108.686
67 108.67
109.113
33
109.363
33
110.636
67 110.87
111.323
33
Standard Error 1.32052
1.17565
08
1.19641
37
1.47208
3
1.49475
31
1.62190
81
1.64707
44
1.64610
78
Median 106.9 106.85 106.95 107.1 107.1 107.85 107.15 107.1
Mode 113.1 106 115.2 109.1 106.7 107.2 106.7 106.7
Standard
Deviation 7.2328
6.43930
46
6.55302
77
8.06293
06
8.18710
02
8.88355
64
9.02139
79
9.01610
37
Sample
Variance 52.3134
41.4646
44
42.9421
72
65.0108
51
67.0286
09
78.9175
75
81.3856
21
81.2901
26
Statistical study is defined as analysing data relating to a problem and then trying to find
solution. The topic being studied in the report is the producer’s price inflation and within it price
indices of all manufacturing and selected industries from UK output will be discussed. Analysis
of price inflation is necessary to be understood as this will assist companies in analysing that
how much inflation is being increased or decreased.
Statistical question
1. What are average number of output including all manufactured product?
2. What are average number of manufactured products but excluding food beverage,
tobacco and petroleum?
3. What is the average output of all manufactured products but in exclusion of duty less
Division 19?
METHODOLOGY
For the present study, use of secondary sources of data was used in order to reach to some
conclusion relating to producer price inflation in UK (Javdanian, 2019). For this study data
relating to price indices of UK output will be analysed with help of this data. The reason for
choosing the selected data is that it will outline the prices of all the manufactured products and
this will assist in analysing the fact that how much inflation is there in prices.
CALCULATION AND GRAPH
2020 2020 2020 2020 2020 2020 2020 2021
Jun Jul Aug Sep Oct Nov Dec Jan
Mean 108.32
108.686
67 108.67
109.113
33
109.363
33
110.636
67 110.87
111.323
33
Standard Error 1.32052
1.17565
08
1.19641
37
1.47208
3
1.49475
31
1.62190
81
1.64707
44
1.64610
78
Median 106.9 106.85 106.95 107.1 107.1 107.85 107.15 107.1
Mode 113.1 106 115.2 109.1 106.7 107.2 106.7 106.7
Standard
Deviation 7.2328
6.43930
46
6.55302
77
8.06293
06
8.18710
02
8.88355
64
9.02139
79
9.01610
37
Sample
Variance 52.3134
41.4646
44
42.9421
72
65.0108
51
67.0286
09
78.9175
75
81.3856
21
81.2901
26
Kurtosis 2.86431
2.67313
99
2.67628
09
1.99831
09
1.77797
04
1.34818
78
1.83920
28
1.94908
67
Skewness 0.35349
1.24452
21
1.12110
15
0.76951
01
0.68303
08
1.16853
47
1.54798
99
1.62773
38
Range 38.5 30.5 31.9 39.2 39.4 38.8 36.2 34.2
Minimum 89.2 97.2 95.8 90.6 90.4 95.2 100.8 102.8
Maximum 127.7 127.7 127.7 129.8 129.8 134 137 137
Sum 3249.6 3260.6 3260.1 3273.4 3280.9 3319.1 3326.1 3339.7
Count 30 30 30 30 30 30 30 30
Secure Best Marks with AI Grader
Need help grading? Try our AI Grader for instant feedback on your assignments.
ANALYSIS OF DATA
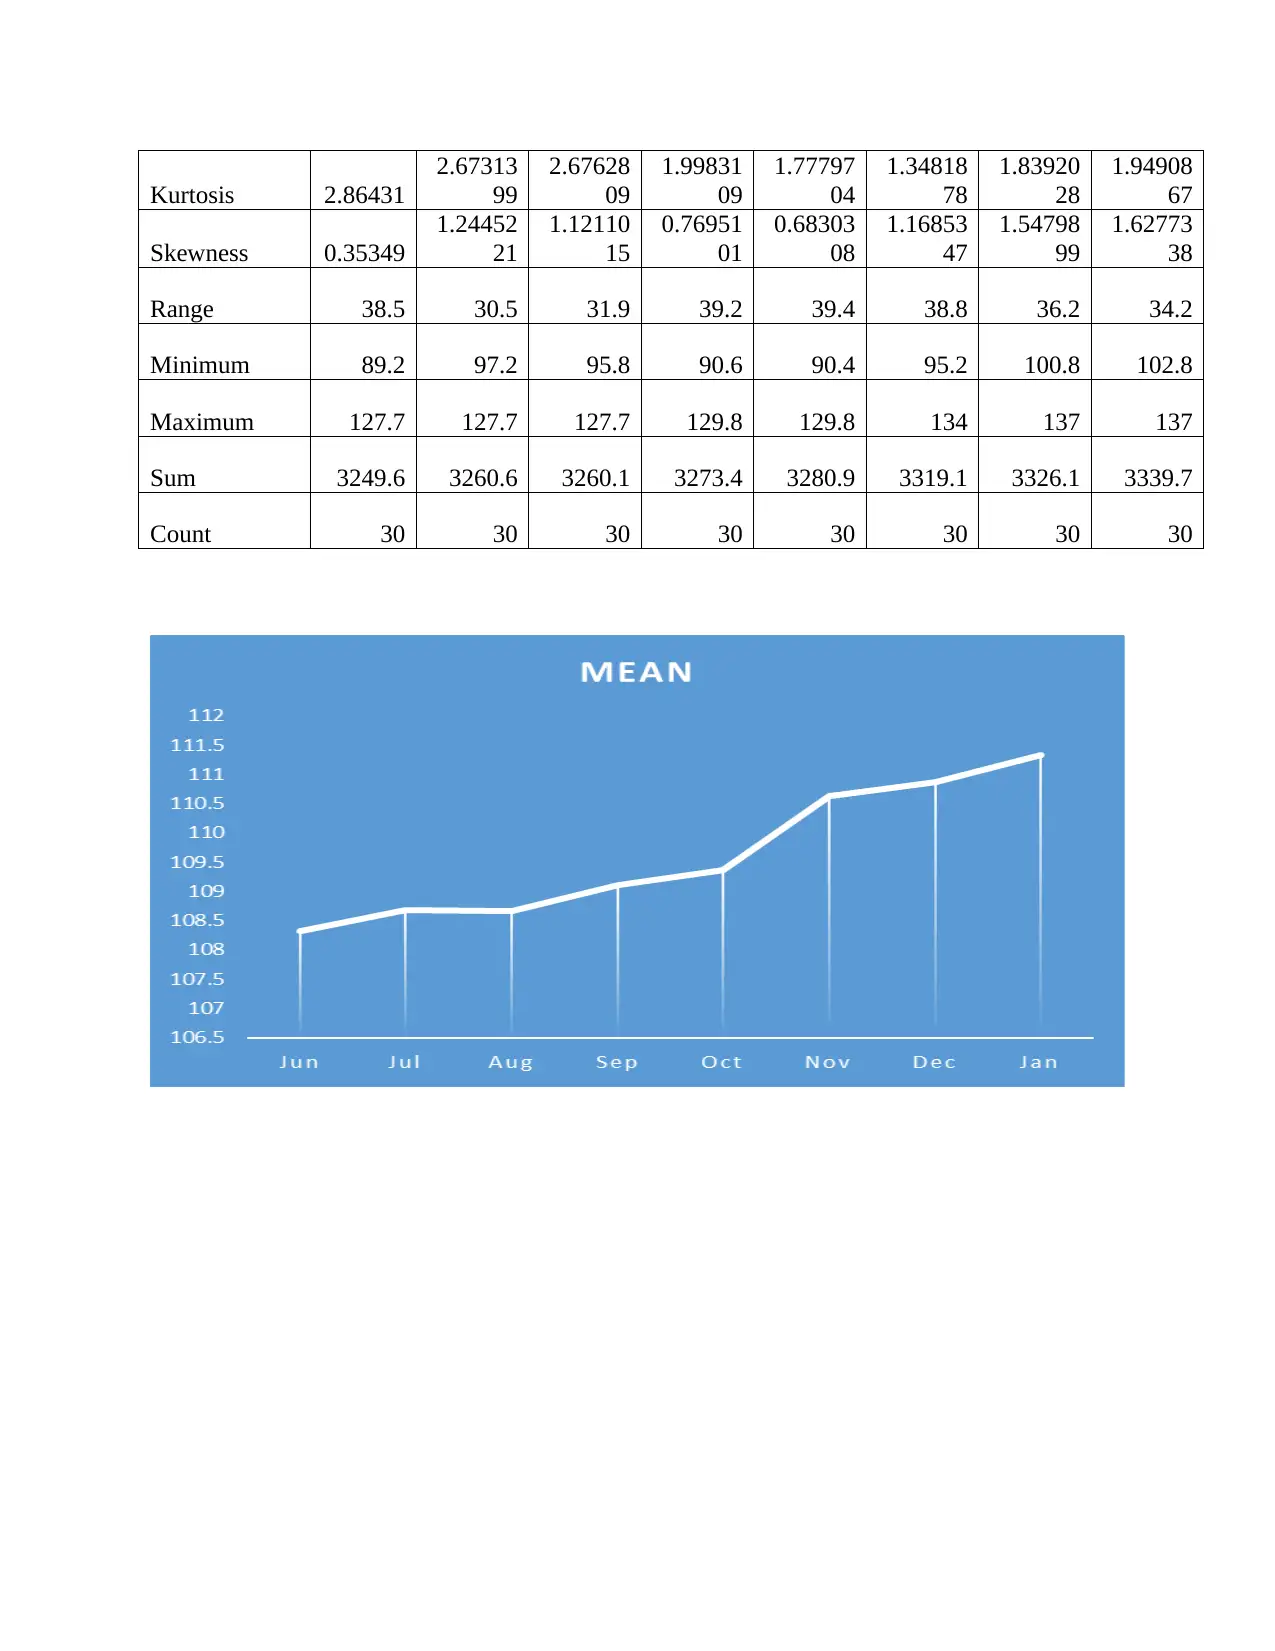
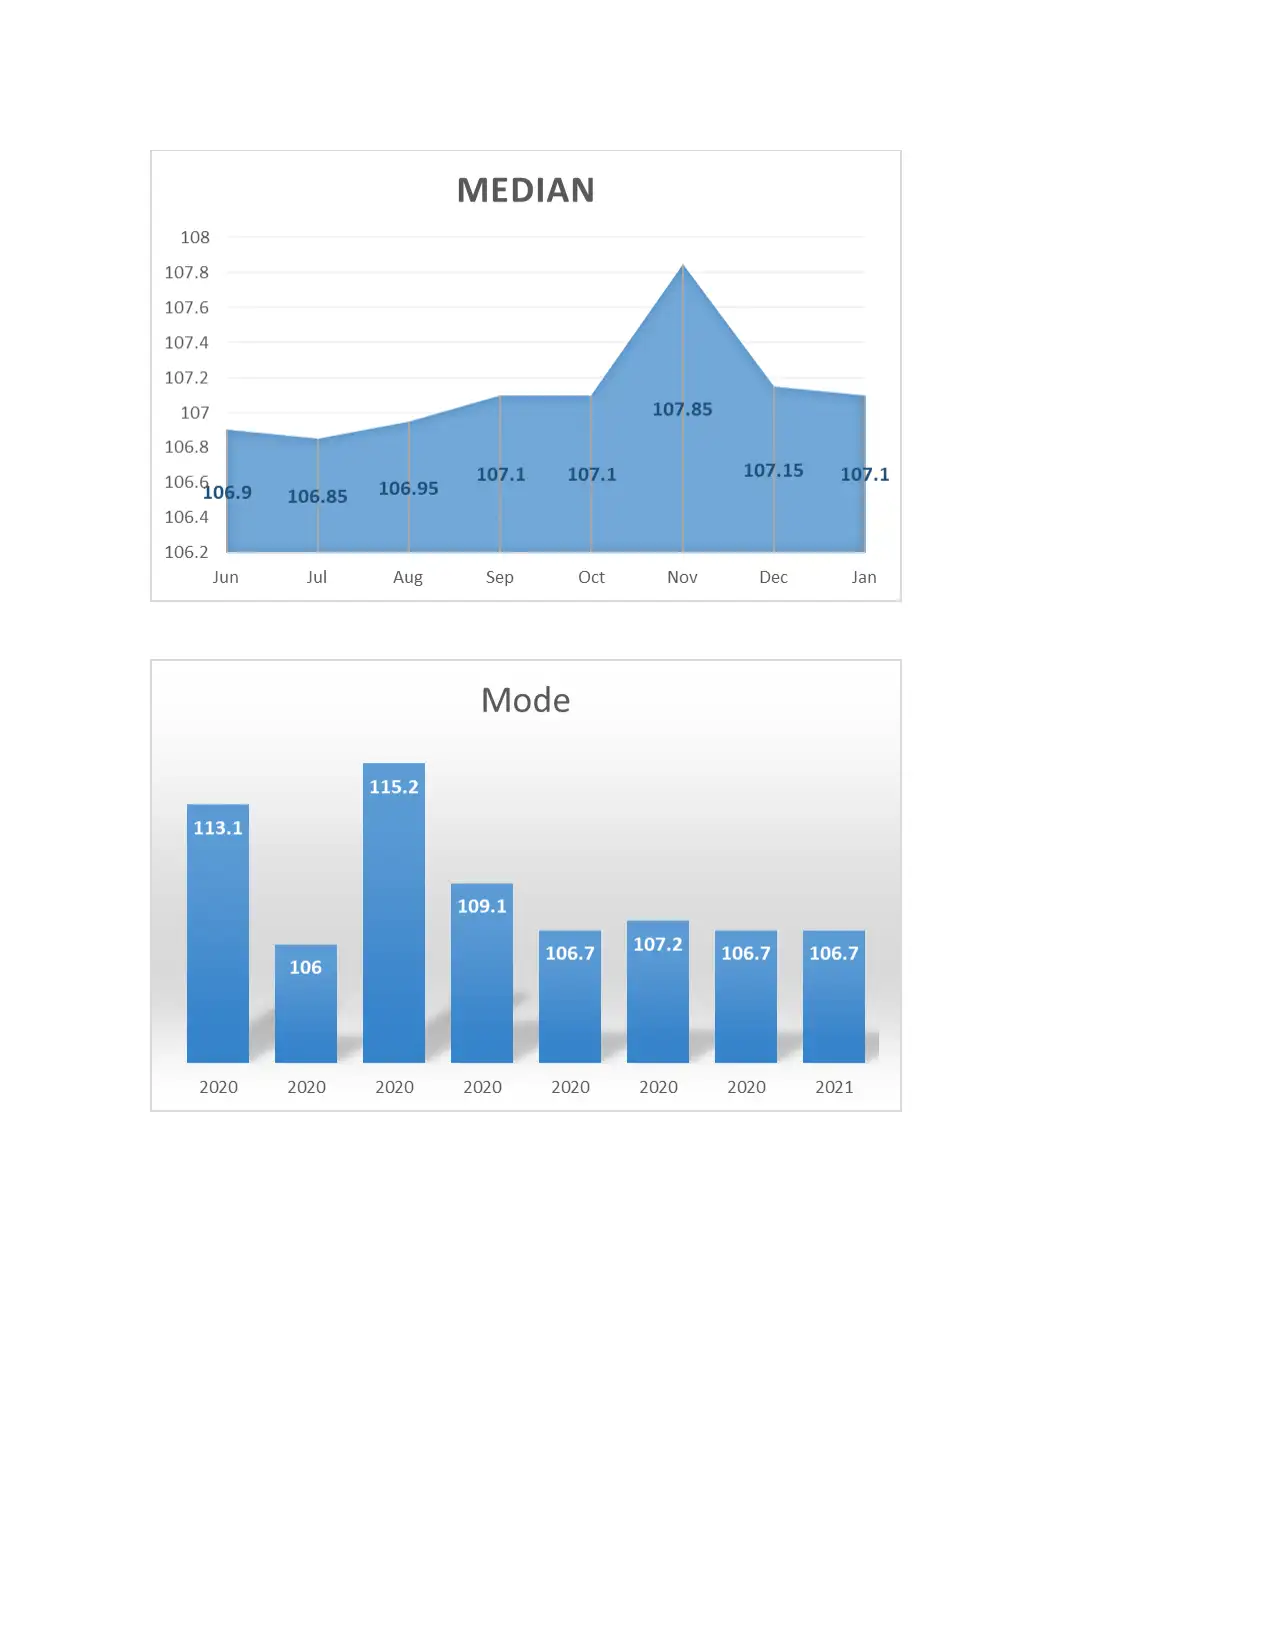
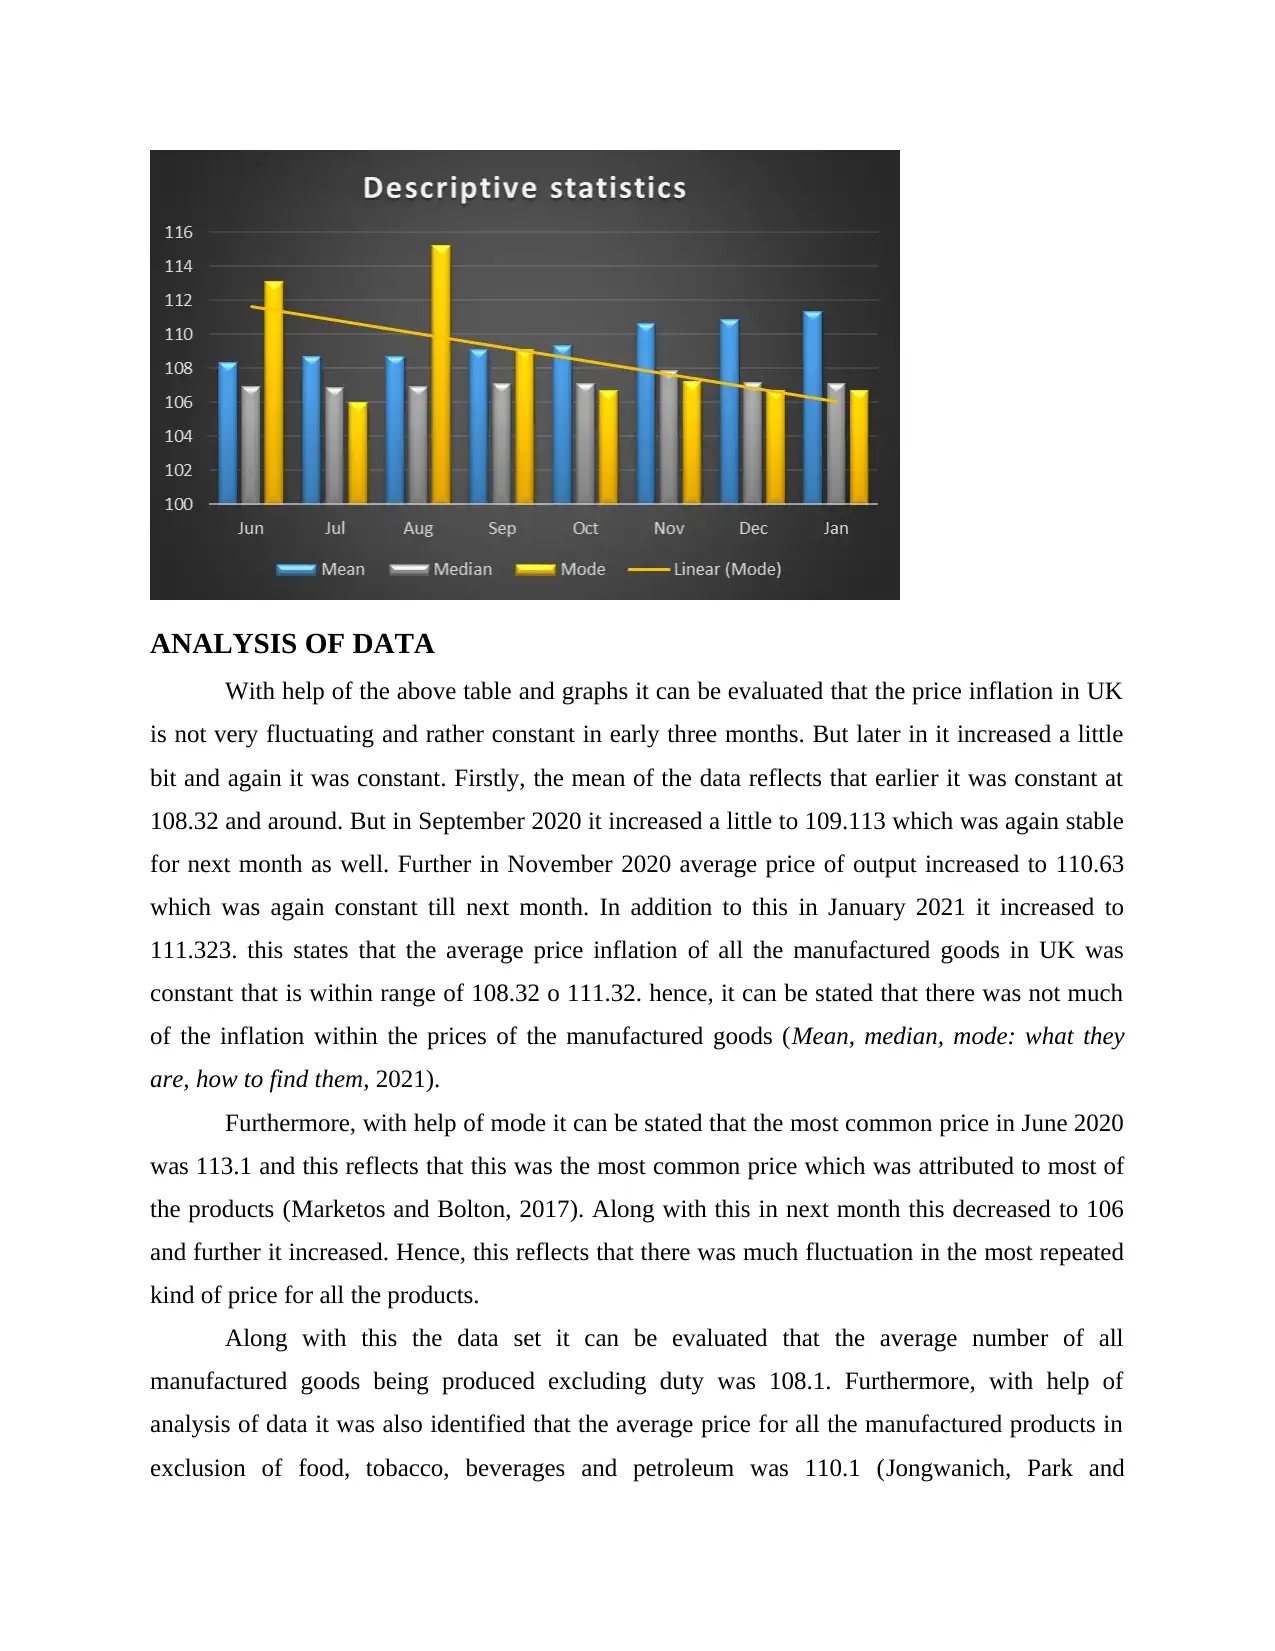
With help of the above table and graphs it can be evaluated that the price inflation in UK
is not very fluctuating and rather constant in early three months. But later in it increased a little
bit and again it was constant. Firstly, the mean of the data reflects that earlier it was constant at
108.32 and around. But in September 2020 it increased a little to 109.113 which was again stable
for next month as well. Further in November 2020 average price of output increased to 110.63
which was again constant till next month. In addition to this in January 2021 it increased to
111.323. this states that the average price inflation of all the manufactured goods in UK was
constant that is within range of 108.32 o 111.32. hence, it can be stated that there was not much
of the inflation within the prices of the manufactured goods (Mean, median, mode: what they
are, how to find them, 2021).
Furthermore, with help of mode it can be stated that the most common price in June 2020
was 113.1 and this reflects that this was the most common price which was attributed to most of
the products (Marketos and Bolton, 2017). Along with this in next month this decreased to 106
and further it increased. Hence, this reflects that there was much fluctuation in the most repeated
kind of price for all the products.
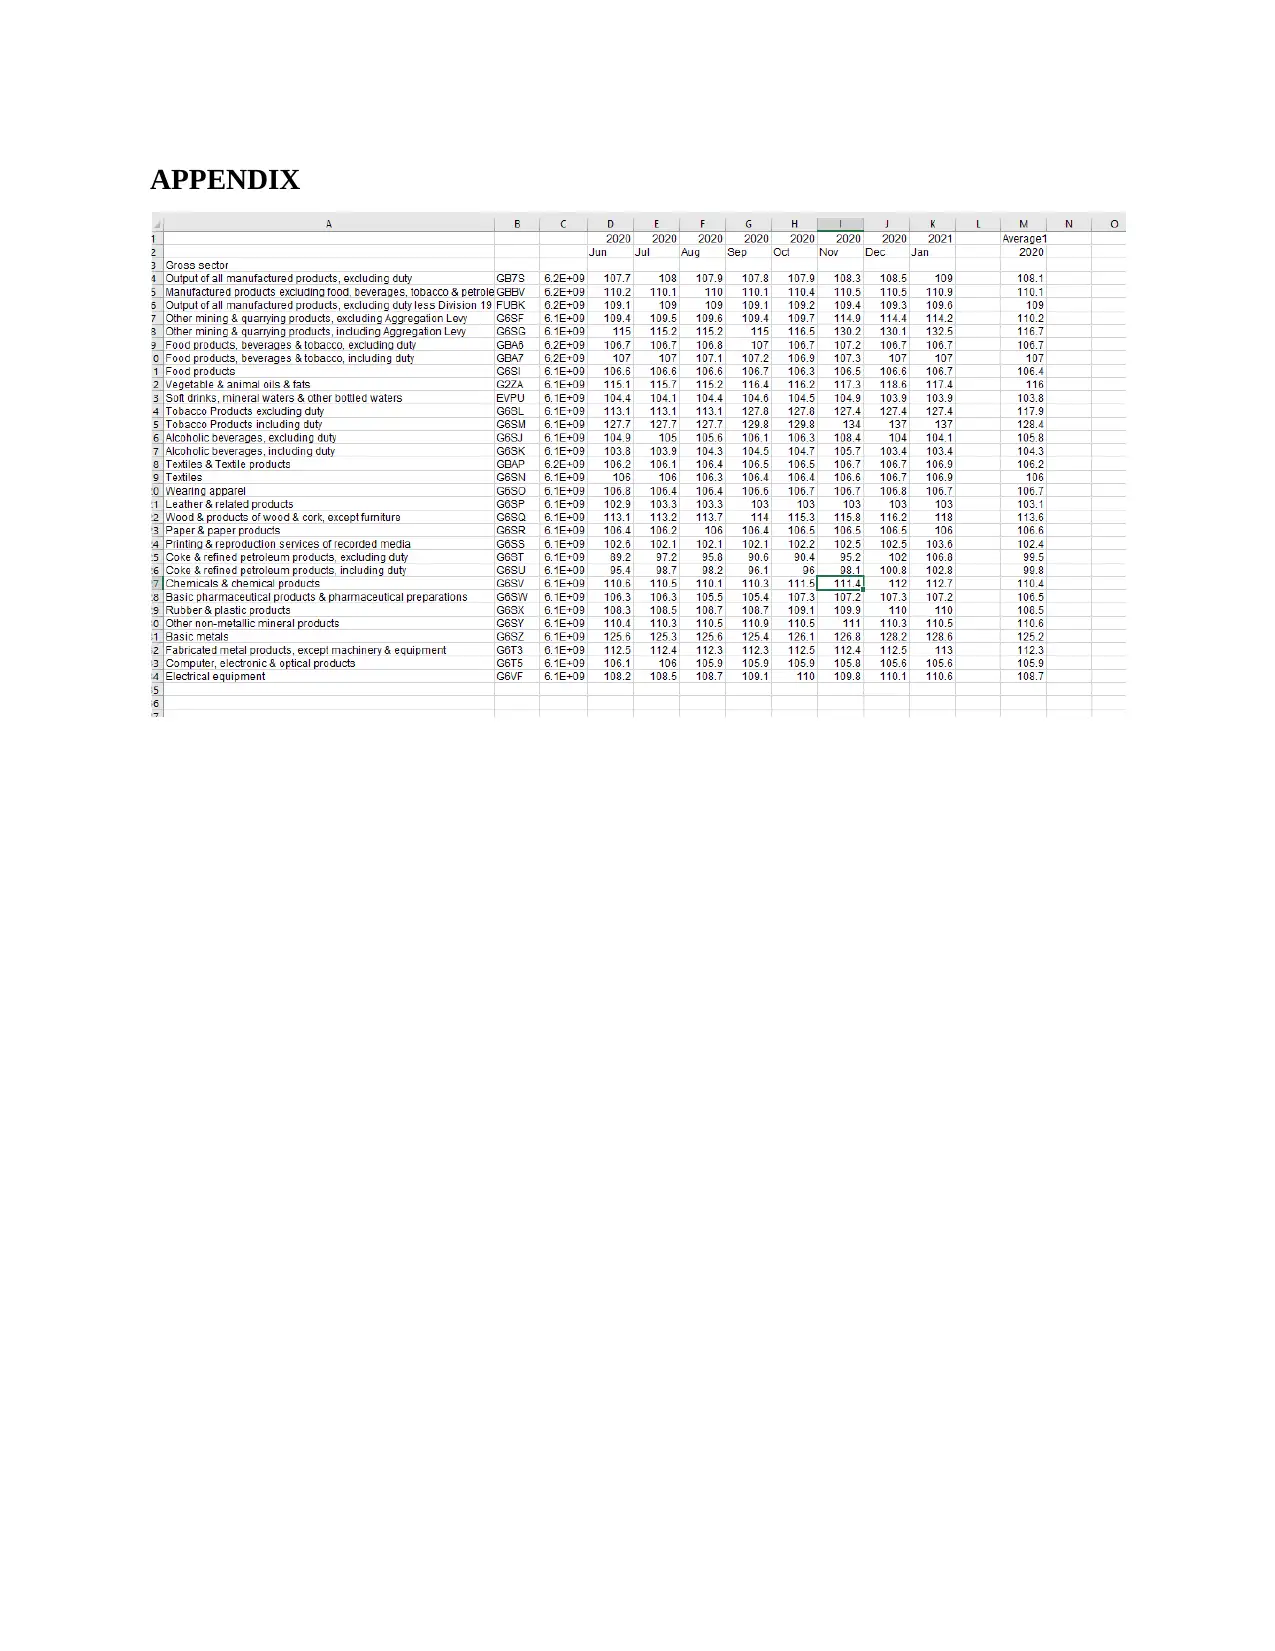
Along with this the data set it can be evaluated that the average number of all
manufactured goods being produced excluding duty was 108.1. Furthermore, with help of
analysis of data it was also identified that the average price for all the manufactured products in
exclusion of food, tobacco, beverages and petroleum was 110.1 (Jongwanich, Park and
With help of the above table and graphs it can be evaluated that the price inflation in UK
is not very fluctuating and rather constant in early three months. But later in it increased a little
bit and again it was constant. Firstly, the mean of the data reflects that earlier it was constant at
108.32 and around. But in September 2020 it increased a little to 109.113 which was again stable
for next month as well. Further in November 2020 average price of output increased to 110.63
which was again constant till next month. In addition to this in January 2021 it increased to
111.323. this states that the average price inflation of all the manufactured goods in UK was
constant that is within range of 108.32 o 111.32. hence, it can be stated that there was not much
of the inflation within the prices of the manufactured goods (Mean, median, mode: what they
are, how to find them, 2021).
Furthermore, with help of mode it can be stated that the most common price in June 2020
was 113.1 and this reflects that this was the most common price which was attributed to most of
the products (Marketos and Bolton, 2017). Along with this in next month this decreased to 106
and further it increased. Hence, this reflects that there was much fluctuation in the most repeated
kind of price for all the products.
Along with this the data set it can be evaluated that the average number of all
manufactured goods being produced excluding duty was 108.1. Furthermore, with help of
analysis of data it was also identified that the average price for all the manufactured products in
exclusion of food, tobacco, beverages and petroleum was 110.1 (Jongwanich, Park and
Wongcharoen, 2019). This may be because of the reason that it includes more of the product and
services. In addition to this, the average number of all the manufactured product was 109 and this
excludes the duty less Division 19.
CONCLUSION
From the above study it can be summarised that, statistical information analysis is very
important. The reason pertaining to the fact is that for taking some decision analysis of data is
very important and it cannot be avoided. From the above analysis it was clear that use of
descriptive statistics is helpful in managing and identifying trends relating to producer price
inflation. Further it was also helpful that with help of graphs data can be presented in better and
clear manner and this will assist in providing clear pictorial information.
Paraphrase This Document
Need a fresh take? Get an instant paraphrase of this document with our AI Paraphraser
REFERENCES
Books and Journals
Emberson, L.L., and et.al., 2019. Comparing statistical learning across perceptual modalities in
infancy: An investigation of underlying learning mechanism (s). Developmental science,
22(6), p.e12847.
Javdanian, H., 2019. Evaluation of soil liquefaction potential using energy approach:
experimental and statistical investigation. Bulletin of Engineering Geology and the
Environment, 78(3), pp.1697-1708.
Jongwanich, J., Park, D. and Wongcharoen, P., 2019. Determinants of Producer Price versus
Consumer price inflation in emerging Asia. Journal of the Asia Pacific Economy, 24(2),
pp.224-251.
Marketos, G. and Bolton, M.D., 2017, December. A statistical investigation of particle crushing
in sand. In Geomechanics and Geotechnics of Particulate Media: Proceedings of the
International Symposium on Geomechanics and Geotechnics of Particulate Media, Ube,
Japan, 12-14 September 2006 (p. 247). CRC Press.
Online
Mean, median, mode: what they are, how to find them. 2021. [Online]. Available through:
<https://www.statisticshowto.com/probability-and-statistics/statistics-definitions/mean-
median-mode/>
APPENDIX
1 out of 9
Your All-in-One AI-Powered Toolkit for Academic Success.
+13062052269
info@desklib.com
Available 24*7 on WhatsApp / Email
![[object Object]](/_next/static/media/star-bottom.7253800d.svg)
Unlock your academic potential
© 2024 | Zucol Services PVT LTD | All rights reserved.