Statistical Report: Factors Influencing Employee Performance in Retail
VerifiedAdded on 2021/04/24
|31
|4401
|59
Report
AI Summary
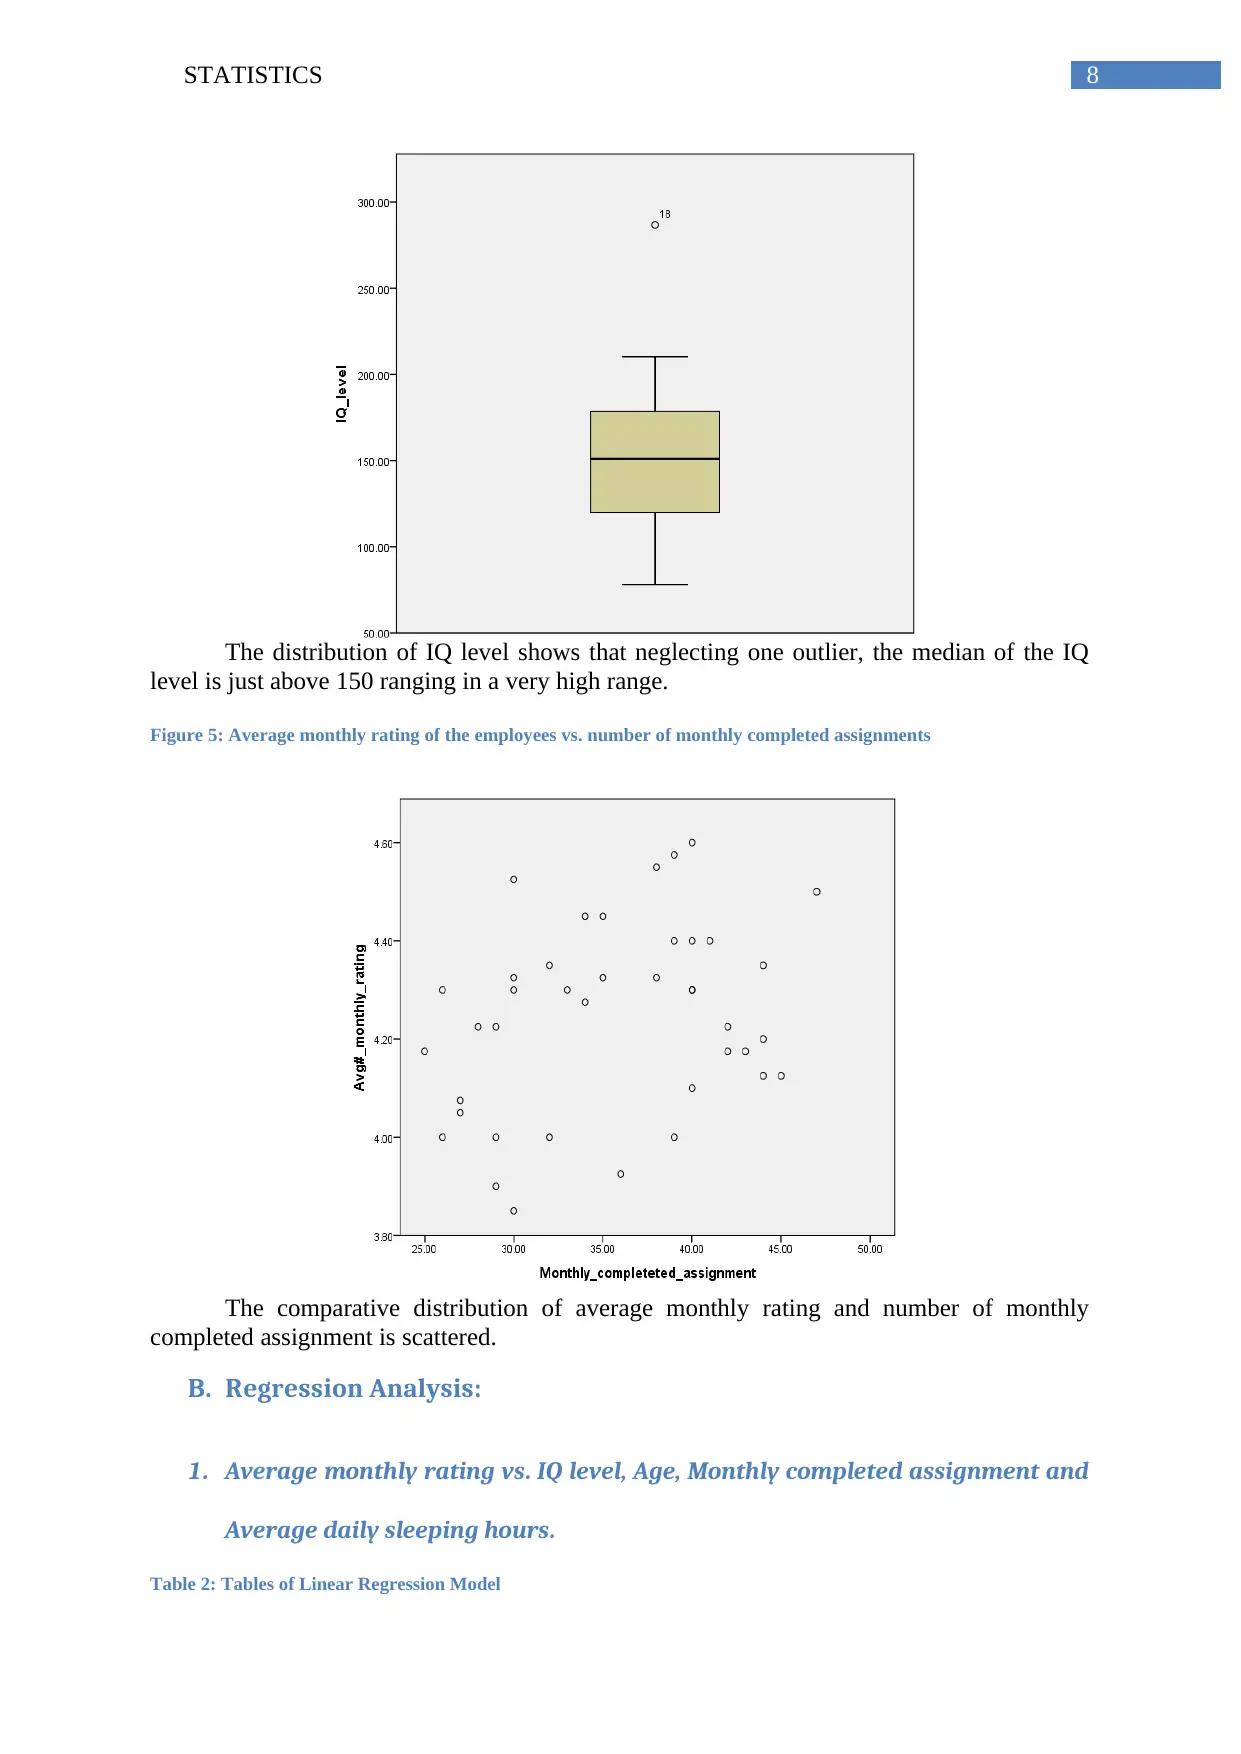
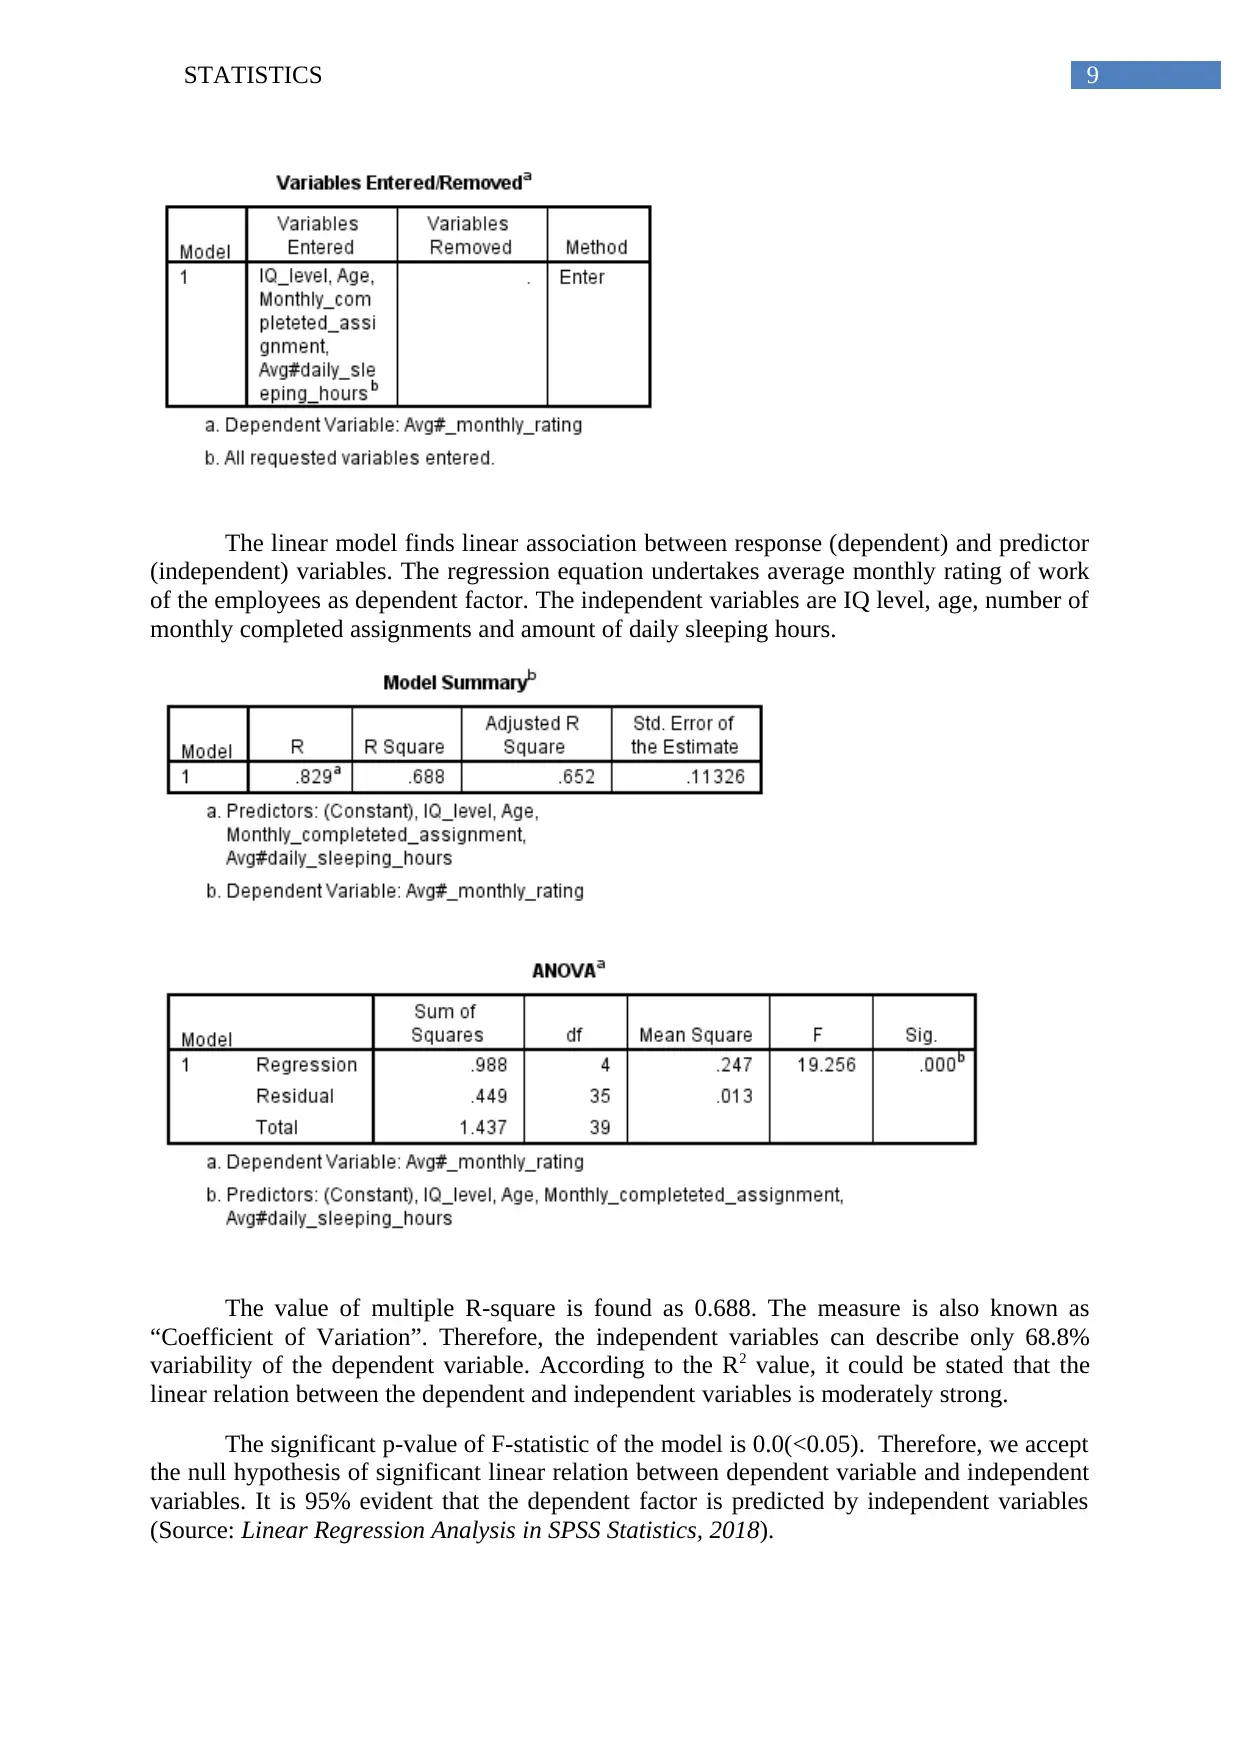
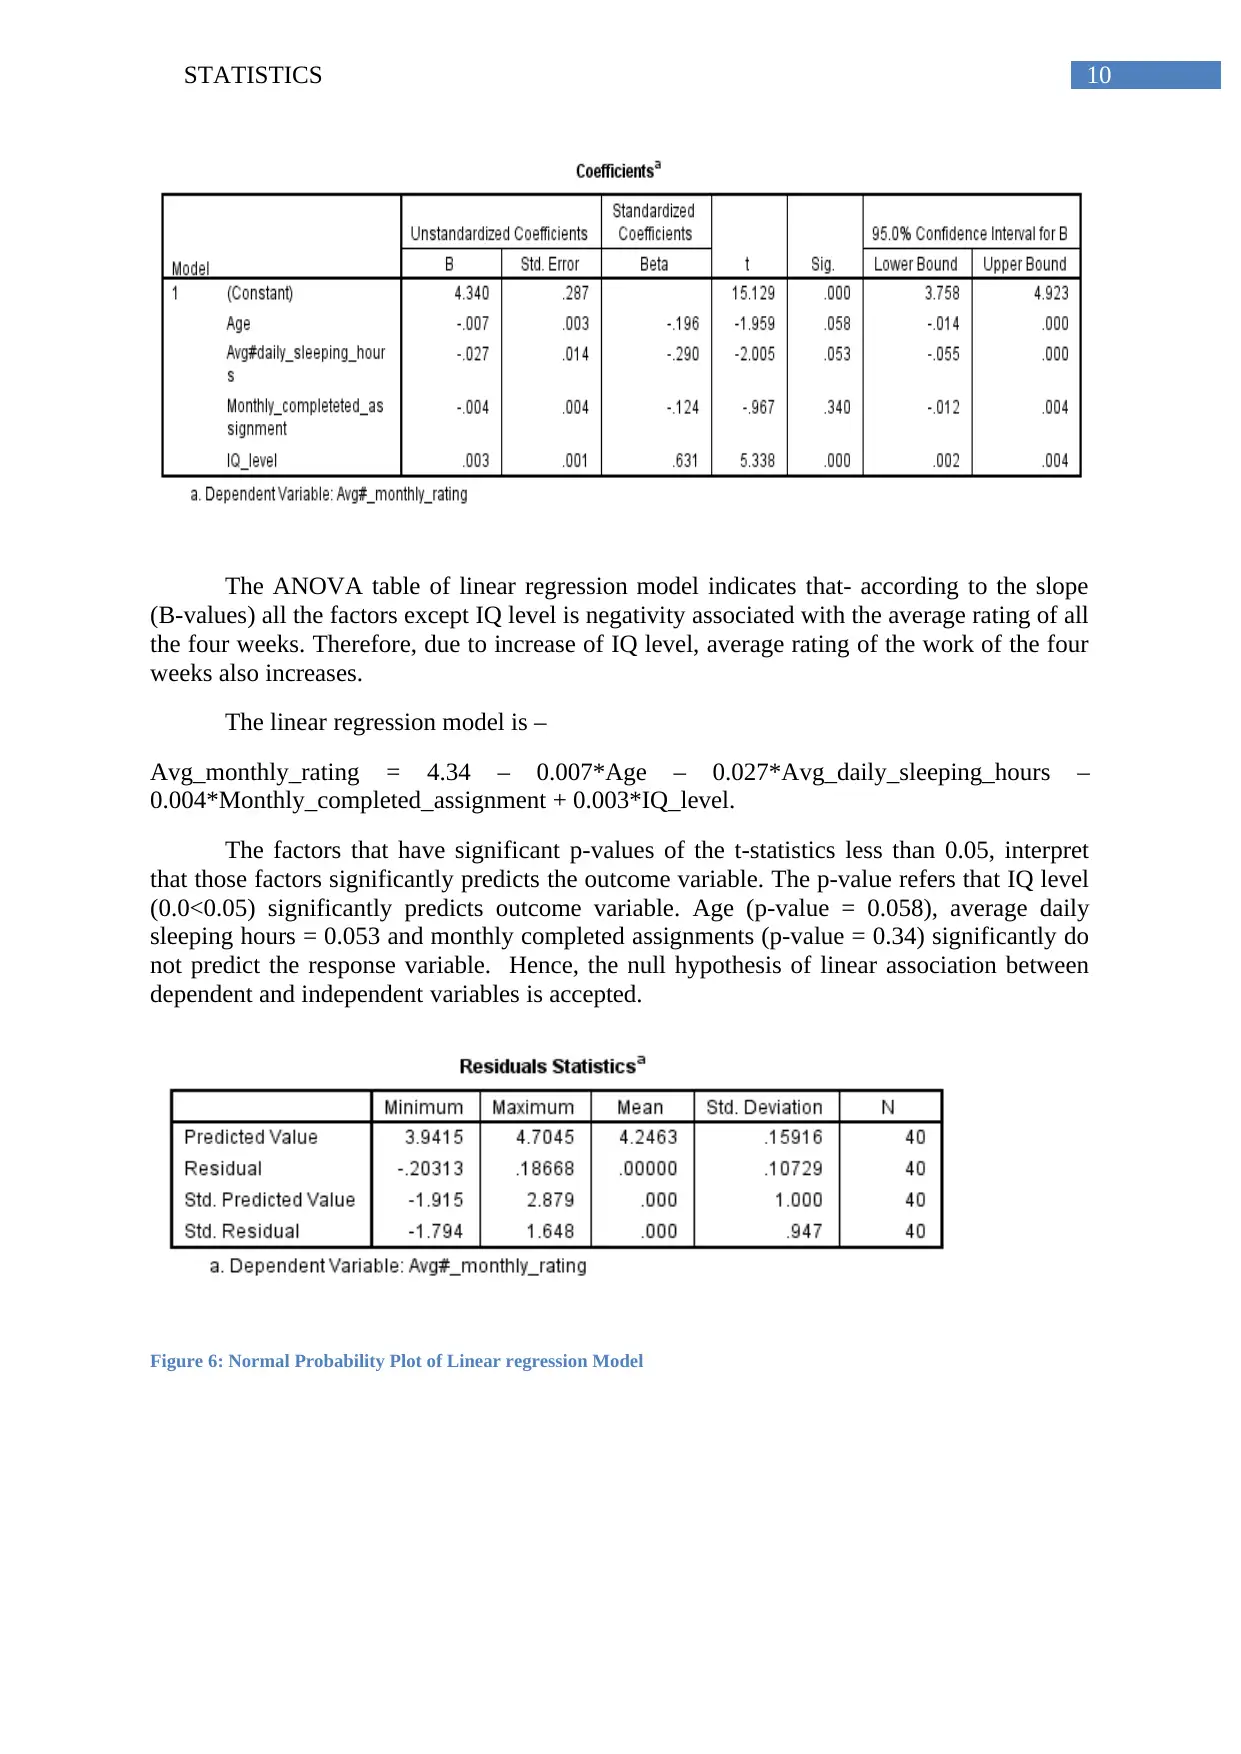
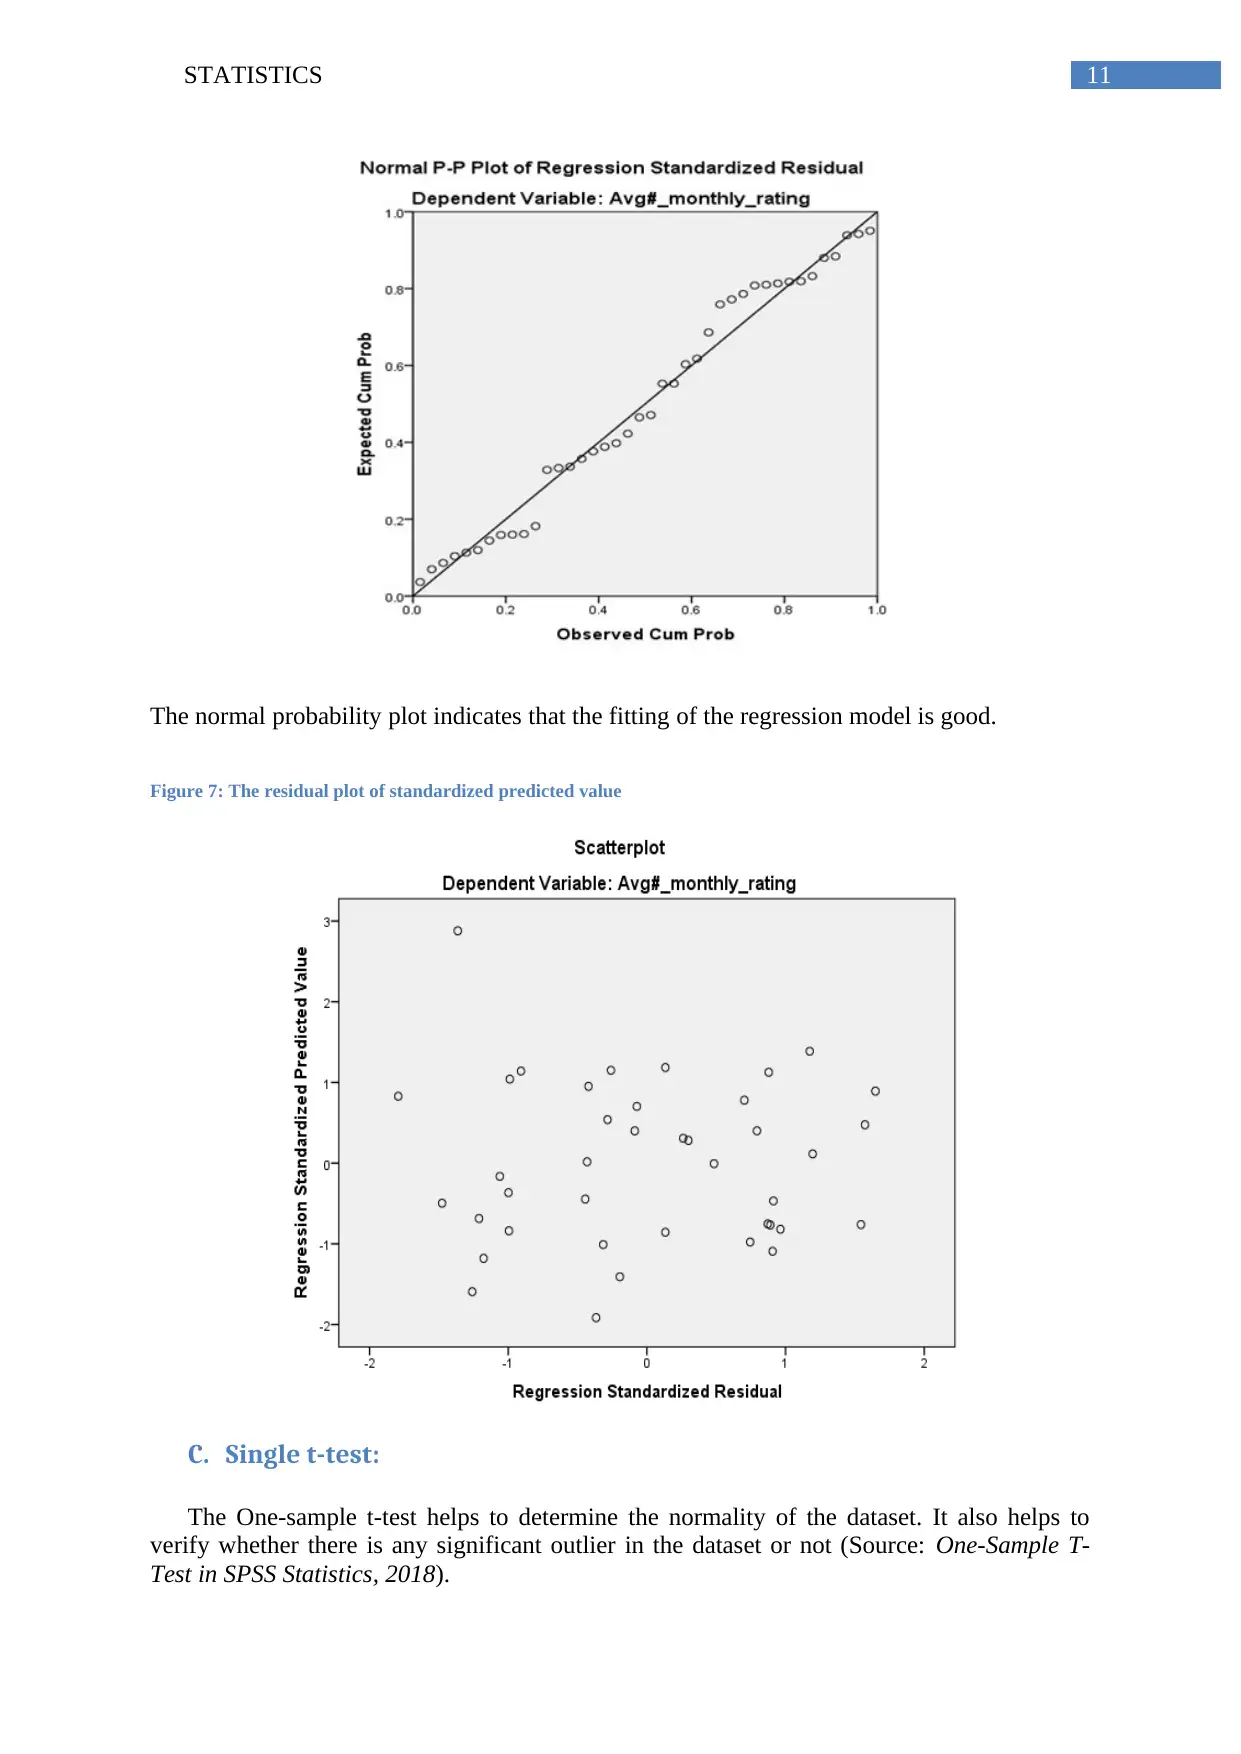
This report presents a statistical analysis of employee performance within a fictitious retail company, utilizing a dataset of 40 employees. The analysis explores the relationships between various factors, including IQ level, age, sleeping habits, completed assignments, and average monthly ratings, to determine their impact on employee performance and the receipt of Reward and Recognition (R&R). The study employs a range of statistical techniques, such as linear regression, single and independent t-tests, cross-tabulations, chi-square tests, and one-way ANOVA, to draw inferences and conclusions. The results, derived with the aid of SPSS-20, reveal significant correlations between certain factors and employee outcomes, highlighting the importance of factors like IQ, and R&R on employee performance. The report also investigates the influence of habits like smoking and drinking, the difficulty level of tasks, and gender on employee performance metrics. The findings are presented in detail, complete with descriptive statistics, graphical representations, and interpretations, offering valuable insights into employee behavior and its impact on the workplace. The report concludes with a discussion of the implications of these findings and recommendations for improving employee performance and fostering a positive work environment.
1 out of 31
Related Documents


Your All-in-One AI-Powered Toolkit for Academic Success.
+13062052269
info@desklib.com
Available 24*7 on WhatsApp / Email
![[object Object]](/_next/static/media/star-bottom.7253800d.svg)
Copyright © 2020–2026 A2Z Services. All Rights Reserved. Developed and managed by ZUCOL.