ESL Australia Share Price Prediction: Data Analysis Project Report
VerifiedAdded on 2020/10/05
|10
|2160
|162
Project
AI Summary
This project analyzes ESL Australia's share prices, employing various statistical techniques to predict future trends. The report begins with an executive summary and data description, followed by an examination of the Variance Inflation Factor, residual analysis, and an ANOVA table. The project further explores the coefficient of determination (R2), hypothesis tests for each input coefficient, and concludes with a prediction of tomorrow's share price. The analysis uses regression analysis, coefficient analysis, and other methods to assess the relationship between ESL Australia's share prices and various economic factors like company shares, 30-year Aluminium, Aluminium vel1, Aluminium vel1 x West Texas vel1, market index S&P500, Airline index, copper, currency value UK and Euro, ultimately aiming to understand the influences on share price fluctuations and make informed predictions. The results indicate a positive relationship between the economic variables and share prices, enabling predictions about future price movements.

STATISTICS AND DATA ANALYSIS
PROJECT
PROJECT
Paraphrase This Document
Need a fresh take? Get an instant paraphrase of this document with our AI Paraphraser

TABLE OF CONTENTS
EXECUTIVE SUMMARY.............................................................................................................1
Description of data.......................................................................................................................1
Variance Inflation factor..............................................................................................................2
Residual analysis.........................................................................................................................2
Analysis of variance (ANOVA) table..........................................................................................4
Coefficient of Determination R2..................................................................................................4
Hypothesis Tests on Each input...................................................................................................5
Coefficient...................................................................................................................................5
Prediction of tomorrow’s share price..........................................................................................6
CONCLUSION................................................................................................................................6
REFERENCES................................................................................................................................7
APPENDIX......................................................................................................................................8
EXECUTIVE SUMMARY
Implication of statistical techniques for analysing the data base on which there will be
influences of various tools and techniques to analyse the reliability and validity of the data base.
In the present report, there will be analysis over share price of ESL Australia with a motive to
determine the relationship between changes in the prices of futures and market index. There will
be use of various methods such as ANOVA analysis, coefficient, regression etc. which will
demonstrate the true value of the data base.
Description of data
In respect with analysing the data base on which making adequate perception and
evaluation of the data base which will be helpful in analysing the outcomes. Therefore, there are
383 days which were being selected by researcher in respect with analysing the data base (Gao
and et.al., 2018). In respect with selection of the trading outcomes where company’s share prices
were being considered on which future change variable will be denoted as the dependent variable
(Y).
Moreover, in respect with analysing the outcomes as the independent variables on which
there have been consideration over other elements. In respect with that there have been use of
company’s shares, 30 years Aluminium, Aluminium vel1, Aluminium vel1 x West Texas vel1,
market index S&P500, Airline index, copper, currency value UK and Euro. Therefore, these
variables have been denoted as the independent variables (X) in the analysis. Therefore, to
clearly understand the financial assets which have been implicated for analysing the data base
such as:
Year x Year (share price of ESL Australia)
30year x Aluminium
Aluminium vel1
Aluminium vel1 x West Texas vel1
SP500 x West Texas vel1
Airline Index vel1
Copper vel1
SP500
Euro vel1
UK Pound vel1
1
⊘ This is a preview!⊘
Do you want full access?
Subscribe today to unlock all pages.
Trusted by 1+ million students worldwide
Future change
Moreover, there have been coded with the numbers between 0 to 1 which will be helpful in
denoting the original prices of the data base of 383 days such as:
0 is placed for denoting the outcomes which are the smallest value
1 is placed for denoting the outcomes which are the biggest value
0.5 is placed for denoting the outcomes for median value
Variance Inflation factor
This is the techniques which have been implicated by researcher with a motive to analyse
the ratio of variance in a model with the influence of multiple variables which have been used in
analysing the outcomes. It quantifies use of multicollinearity for determining the ordinary least
square regression analysis over the data base (Dankbaar and et.al., 2017). It helps in measuring
the variances among the estimated regression as well as coefficient analysis. Therefore, with
approaches to this statistical tool to be implicated in analysing the data base on which it will
analyse the correlation between variables.
As listed in Appendix there have been ascertainment of the data base which indicates the
analysis over regression value of independent variables. Therefore, there have been appropriate
analysis over the correlation between variables (Perlman and et.al., 2017). In relation with the
outcomes of all the independent variables on which it presents adequate information regarding
the relationship among them.
Moreover, in consideration with the outcomes from all the independent variable where it
can eb said that there has been positive relationship among the variables (Yang and et.al., 2017).
Therefore, the changes in currency rates, interest rates will affect the changes in the share price
of ELS Australia
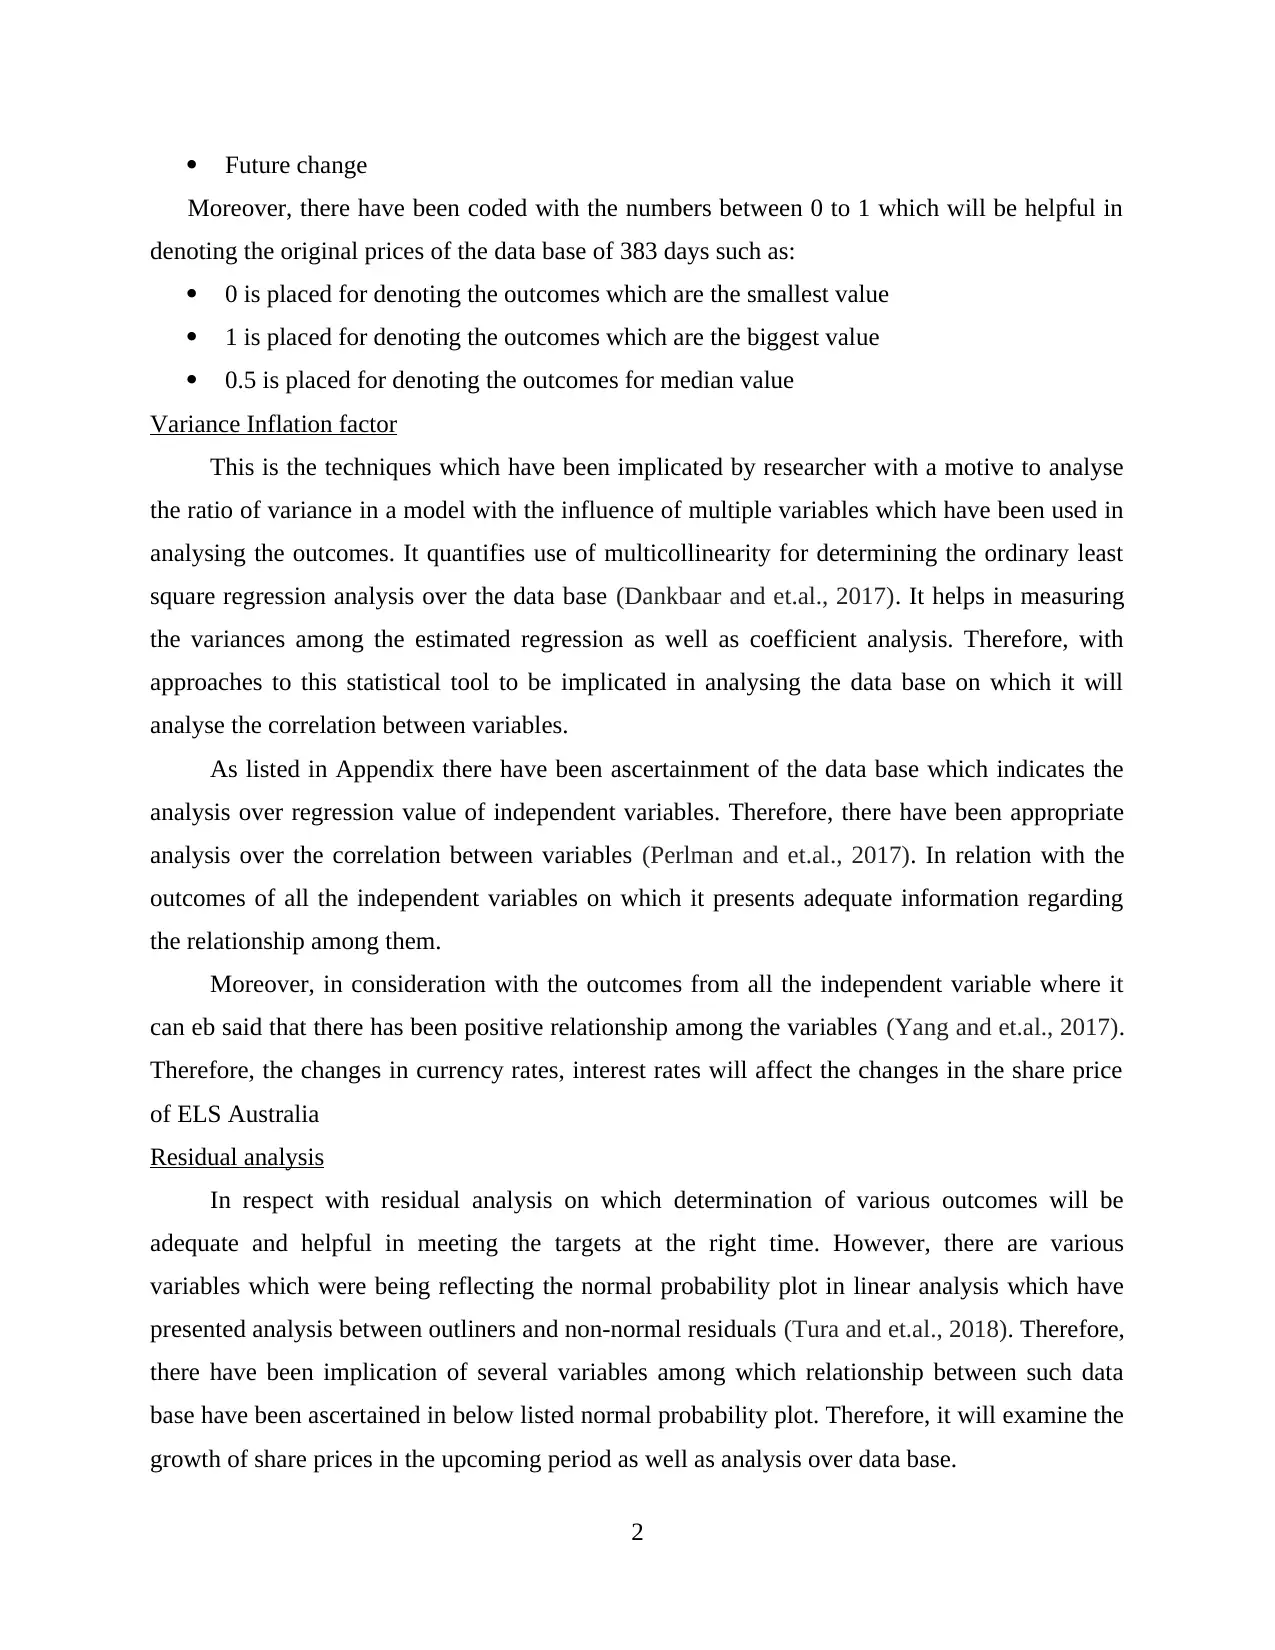
Residual analysis
In respect with residual analysis on which determination of various outcomes will be
adequate and helpful in meeting the targets at the right time. However, there are various
variables which were being reflecting the normal probability plot in linear analysis which have
presented analysis between outliners and non-normal residuals (Tura and et.al., 2018). Therefore,
there have been implication of several variables among which relationship between such data
base have been ascertained in below listed normal probability plot. Therefore, it will examine the
growth of share prices in the upcoming period as well as analysis over data base.
2
Moreover, there have been coded with the numbers between 0 to 1 which will be helpful in
denoting the original prices of the data base of 383 days such as:
0 is placed for denoting the outcomes which are the smallest value
1 is placed for denoting the outcomes which are the biggest value
0.5 is placed for denoting the outcomes for median value
Variance Inflation factor
This is the techniques which have been implicated by researcher with a motive to analyse
the ratio of variance in a model with the influence of multiple variables which have been used in
analysing the outcomes. It quantifies use of multicollinearity for determining the ordinary least
square regression analysis over the data base (Dankbaar and et.al., 2017). It helps in measuring
the variances among the estimated regression as well as coefficient analysis. Therefore, with
approaches to this statistical tool to be implicated in analysing the data base on which it will
analyse the correlation between variables.
As listed in Appendix there have been ascertainment of the data base which indicates the
analysis over regression value of independent variables. Therefore, there have been appropriate
analysis over the correlation between variables (Perlman and et.al., 2017). In relation with the
outcomes of all the independent variables on which it presents adequate information regarding
the relationship among them.
Moreover, in consideration with the outcomes from all the independent variable where it
can eb said that there has been positive relationship among the variables (Yang and et.al., 2017).
Therefore, the changes in currency rates, interest rates will affect the changes in the share price
of ELS Australia
Residual analysis
In respect with residual analysis on which determination of various outcomes will be
adequate and helpful in meeting the targets at the right time. However, there are various
variables which were being reflecting the normal probability plot in linear analysis which have
presented analysis between outliners and non-normal residuals (Tura and et.al., 2018). Therefore,
there have been implication of several variables among which relationship between such data
base have been ascertained in below listed normal probability plot. Therefore, it will examine the
growth of share prices in the upcoming period as well as analysis over data base.
2
Paraphrase This Document
Need a fresh take? Get an instant paraphrase of this document with our AI Paraphraser
Interpretation: On the basis of above listed graphical presentation which presents the
information relevant with normal probability plot of the data base. Therefore, in analysing the
data base which reflects the growth of this plot ranked between 0 to 1. Thus, outcomes do not
reflect any changes as it presents the straight line which ascertains that there are no differences in
the variables. Moreover, it has been demonstrated here that there will be positive growth in the
share value of organisation in respect with other independent variables.
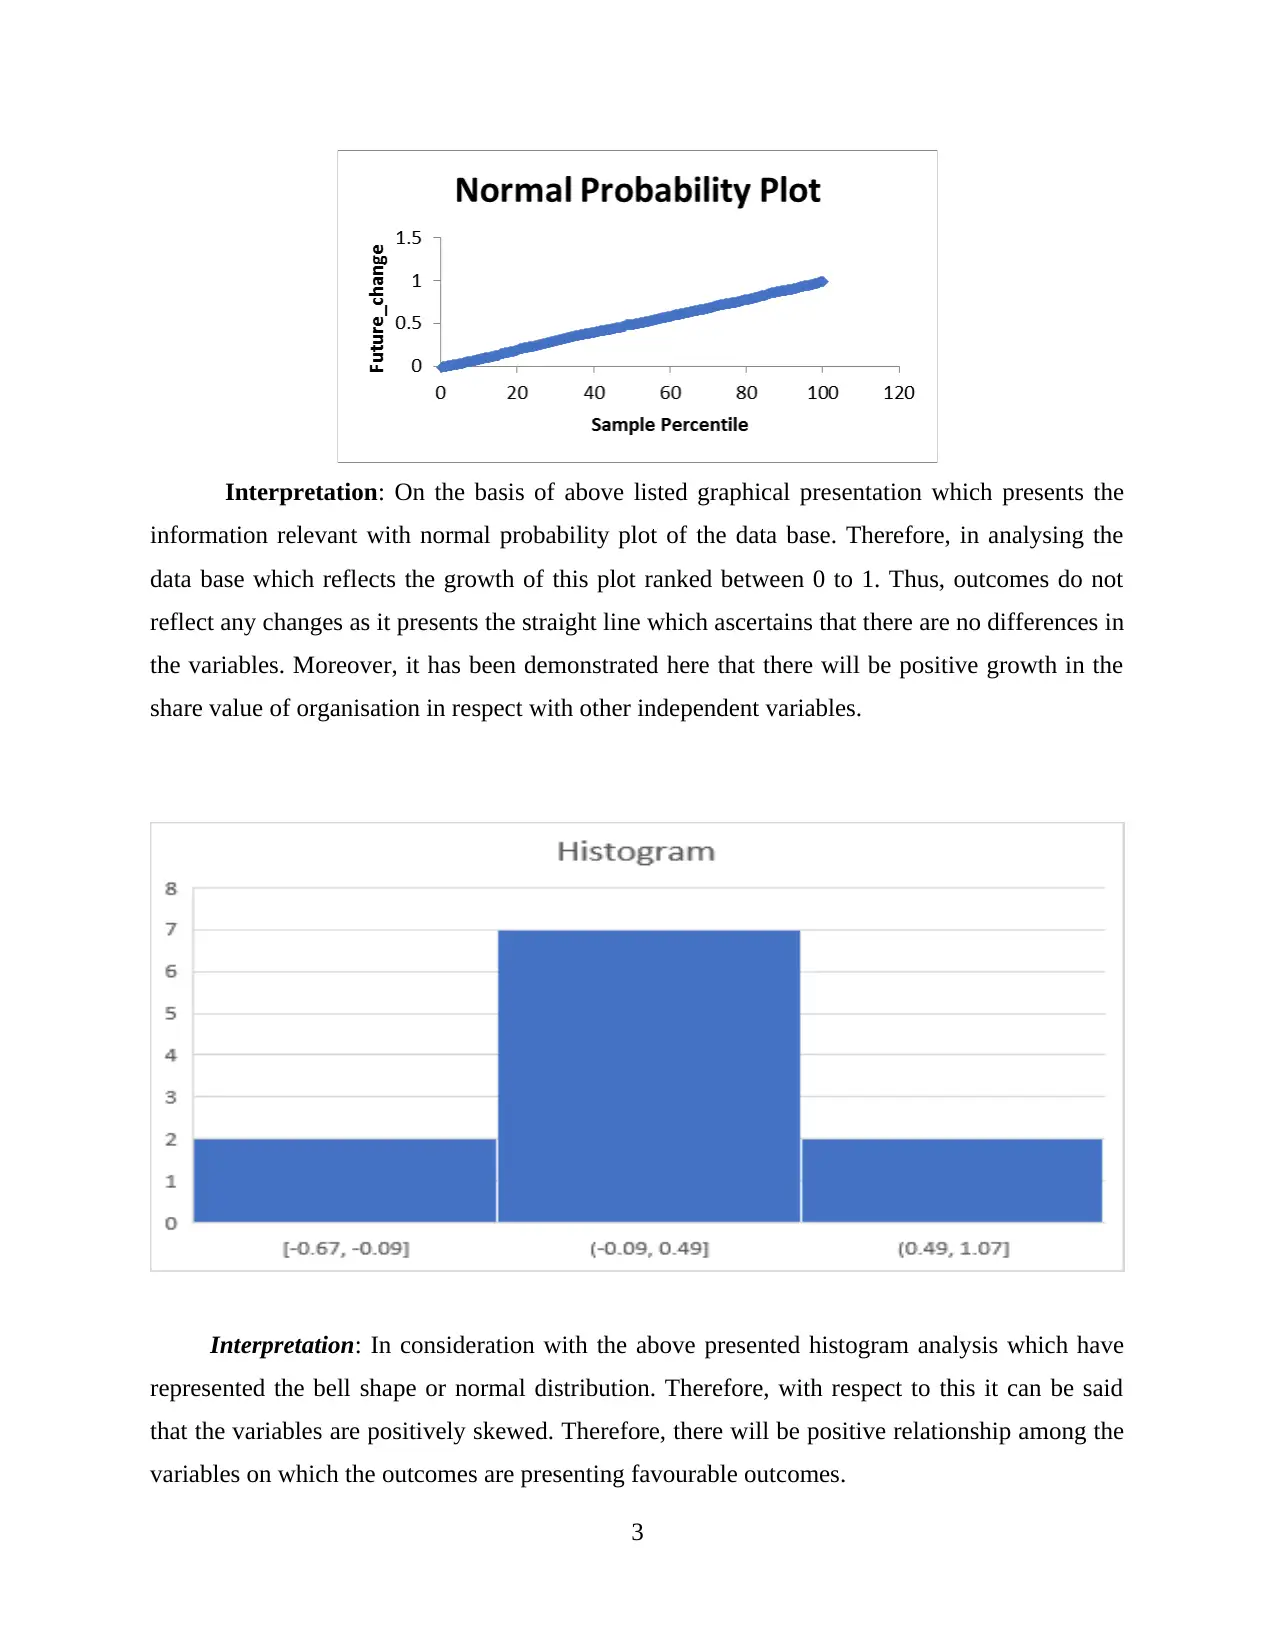
Interpretation: In consideration with the above presented histogram analysis which have
represented the bell shape or normal distribution. Therefore, with respect to this it can be said
that the variables are positively skewed. Therefore, there will be positive relationship among the
variables on which the outcomes are presenting favourable outcomes.
3
information relevant with normal probability plot of the data base. Therefore, in analysing the
data base which reflects the growth of this plot ranked between 0 to 1. Thus, outcomes do not
reflect any changes as it presents the straight line which ascertains that there are no differences in
the variables. Moreover, it has been demonstrated here that there will be positive growth in the
share value of organisation in respect with other independent variables.
Interpretation: In consideration with the above presented histogram analysis which have
represented the bell shape or normal distribution. Therefore, with respect to this it can be said
that the variables are positively skewed. Therefore, there will be positive relationship among the
variables on which the outcomes are presenting favourable outcomes.
3
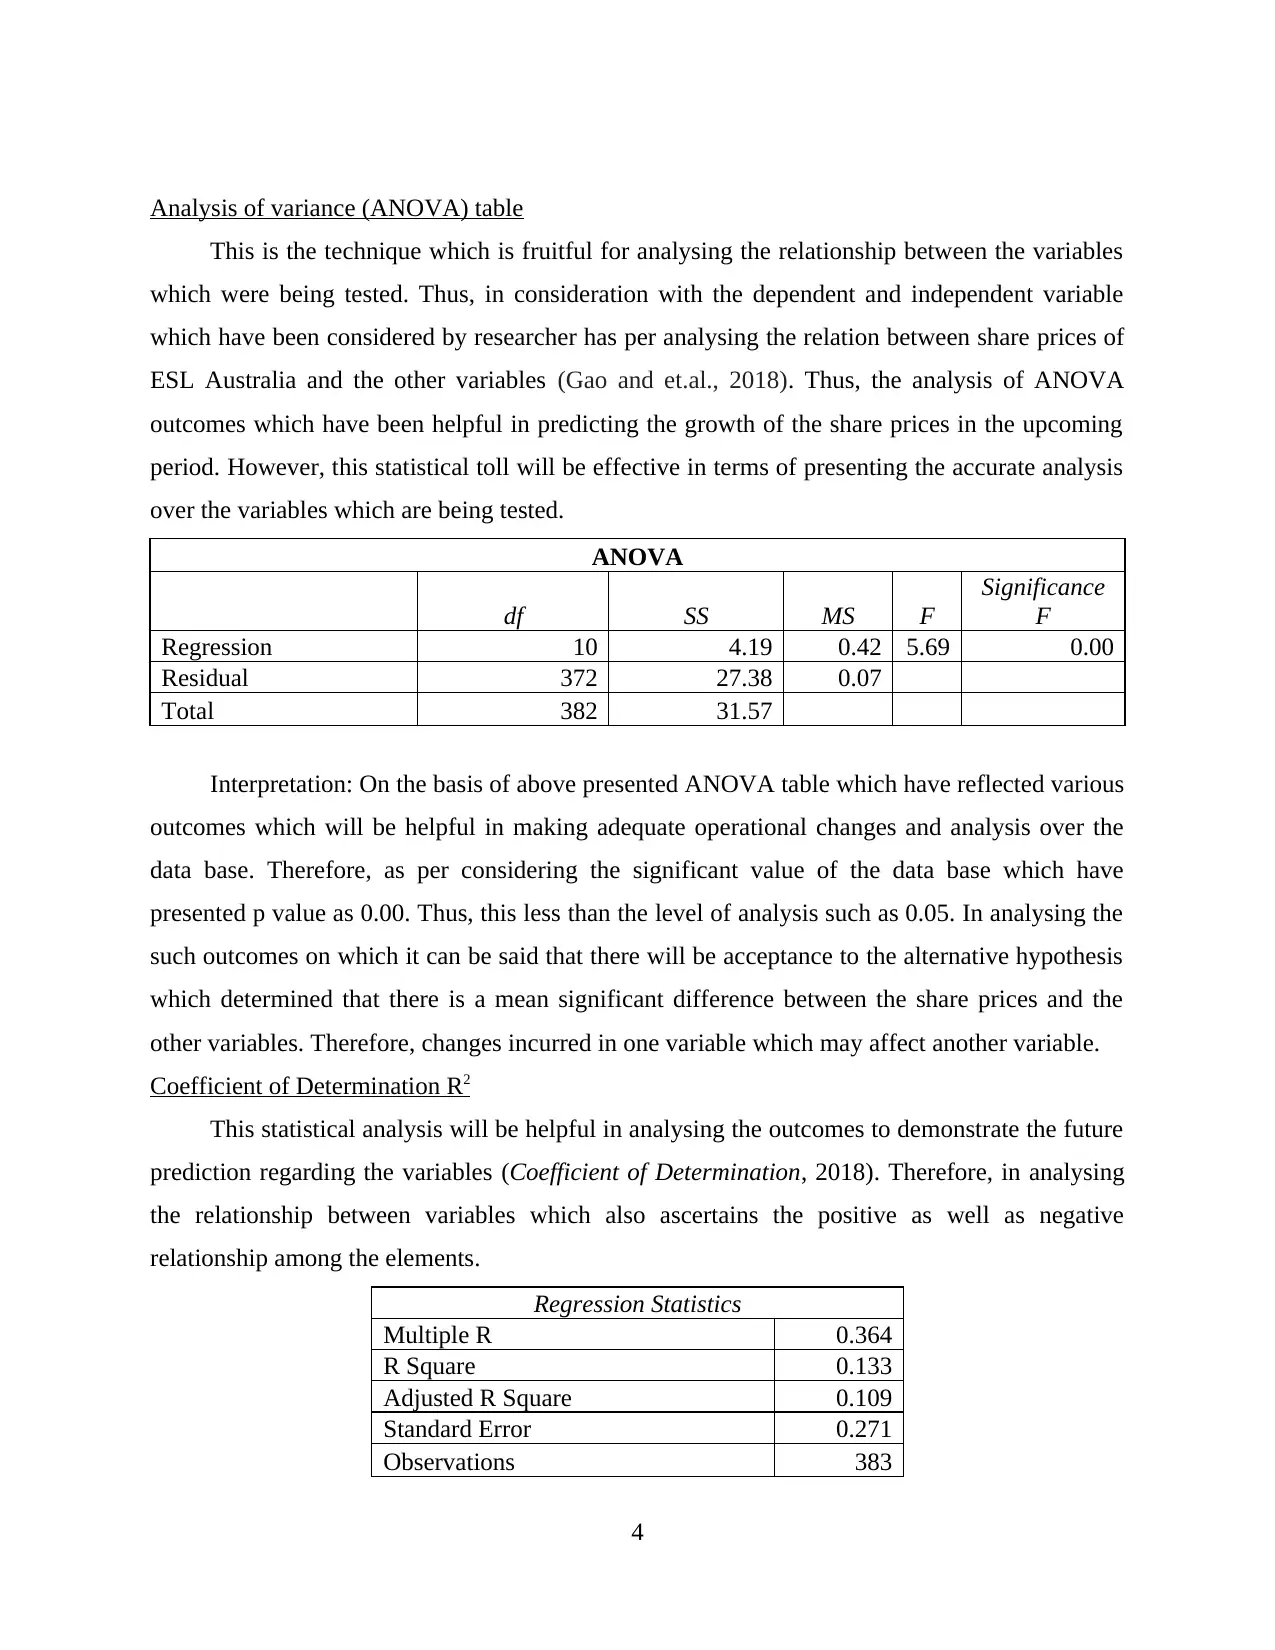
Analysis of variance (ANOVA) table
This is the technique which is fruitful for analysing the relationship between the variables
which were being tested. Thus, in consideration with the dependent and independent variable
which have been considered by researcher has per analysing the relation between share prices of
ESL Australia and the other variables (Gao and et.al., 2018). Thus, the analysis of ANOVA
outcomes which have been helpful in predicting the growth of the share prices in the upcoming
period. However, this statistical toll will be effective in terms of presenting the accurate analysis
over the variables which are being tested.
ANOVA
df SS MS F
Significance
F
Regression 10 4.19 0.42 5.69 0.00
Residual 372 27.38 0.07
Total 382 31.57
Interpretation: On the basis of above presented ANOVA table which have reflected various
outcomes which will be helpful in making adequate operational changes and analysis over the
data base. Therefore, as per considering the significant value of the data base which have
presented p value as 0.00. Thus, this less than the level of analysis such as 0.05. In analysing the
such outcomes on which it can be said that there will be acceptance to the alternative hypothesis
which determined that there is a mean significant difference between the share prices and the
other variables. Therefore, changes incurred in one variable which may affect another variable.
Coefficient of Determination R2
This statistical analysis will be helpful in analysing the outcomes to demonstrate the future
prediction regarding the variables (Coefficient of Determination, 2018). Therefore, in analysing
the relationship between variables which also ascertains the positive as well as negative
relationship among the elements.
Regression Statistics
Multiple R 0.364
R Square 0.133
Adjusted R Square 0.109
Standard Error 0.271
Observations 383
4
⊘ This is a preview!⊘
Do you want full access?
Subscribe today to unlock all pages.
Trusted by 1+ million students worldwide
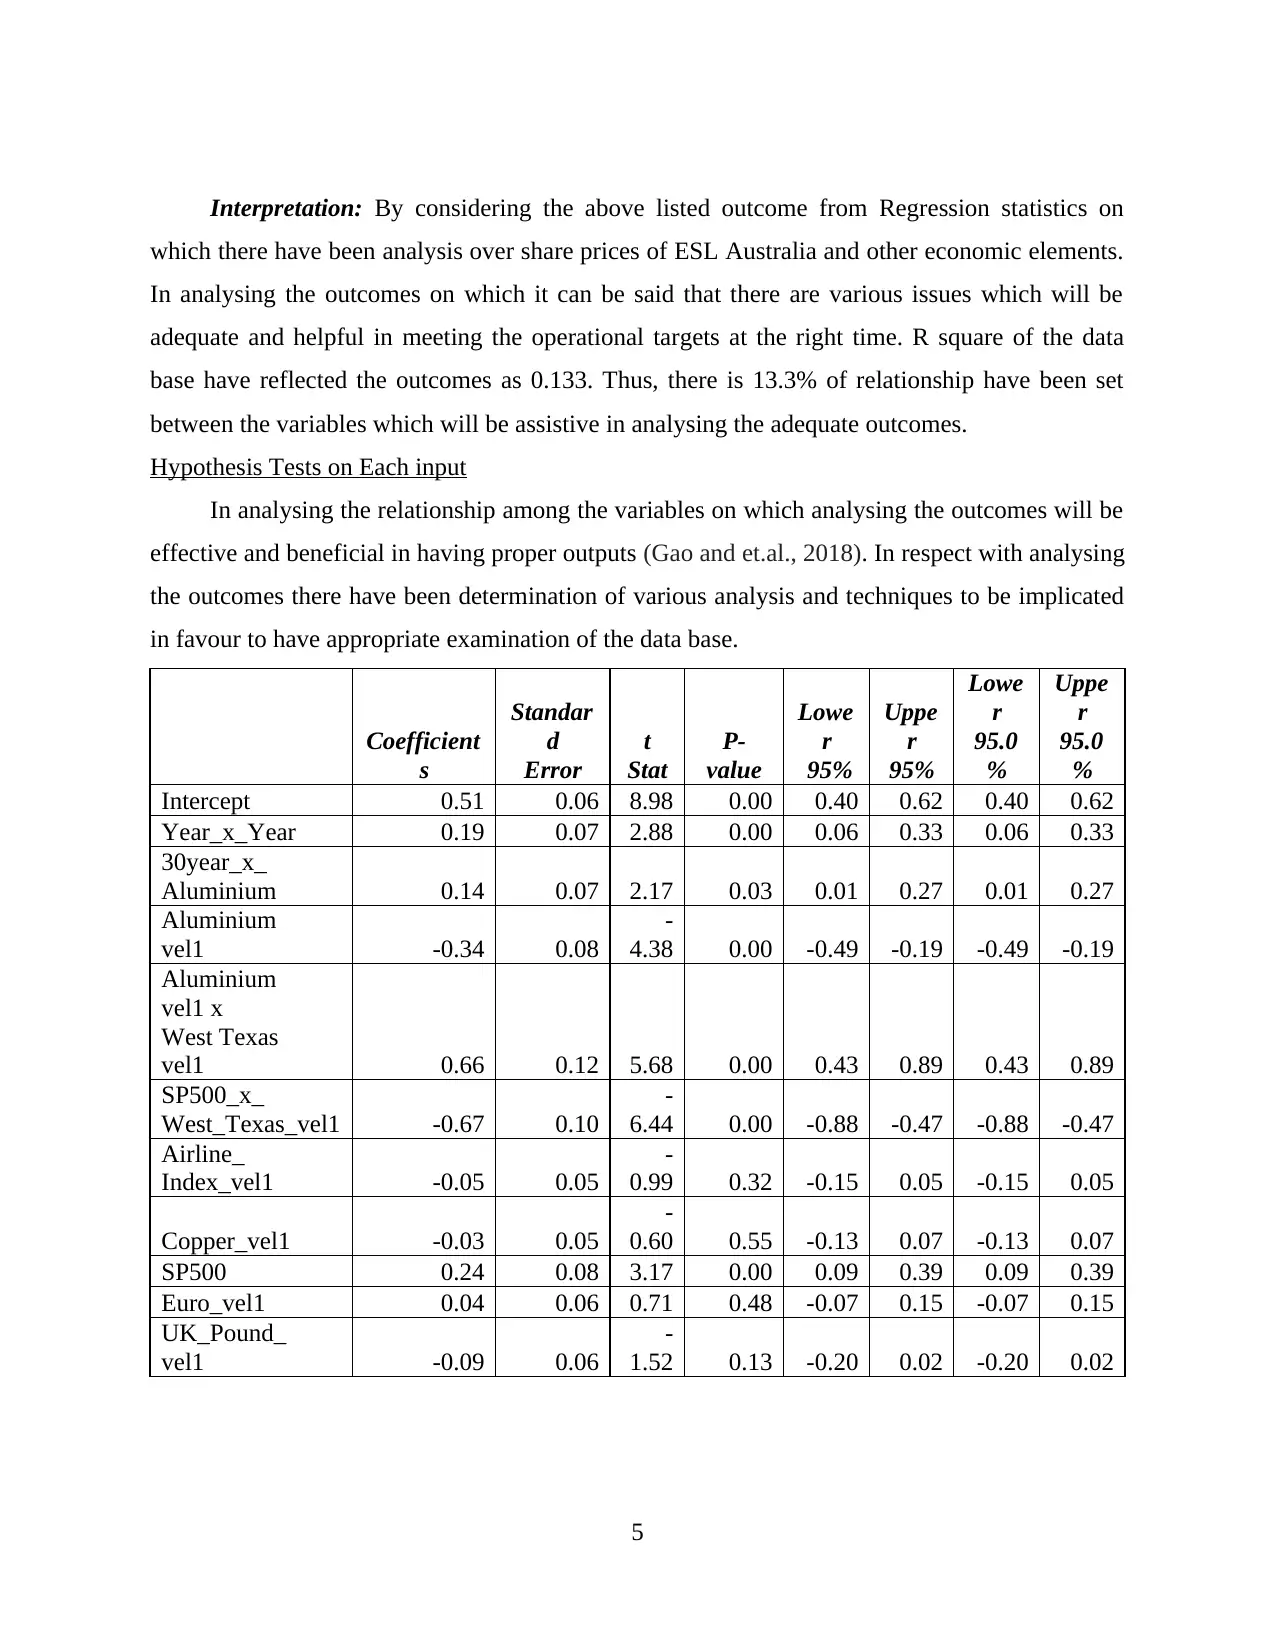
Interpretation: By considering the above listed outcome from Regression statistics on
which there have been analysis over share prices of ESL Australia and other economic elements.
In analysing the outcomes on which it can be said that there are various issues which will be
adequate and helpful in meeting the operational targets at the right time. R square of the data
base have reflected the outcomes as 0.133. Thus, there is 13.3% of relationship have been set
between the variables which will be assistive in analysing the adequate outcomes.
Hypothesis Tests on Each input
In analysing the relationship among the variables on which analysing the outcomes will be
effective and beneficial in having proper outputs (Gao and et.al., 2018). In respect with analysing
the outcomes there have been determination of various analysis and techniques to be implicated
in favour to have appropriate examination of the data base.
Coefficient
s
Standar
d
Error
t
Stat
P-
value
Lowe
r
95%
Uppe
r
95%
Lowe
r
95.0
%
Uppe
r
95.0
%
Intercept 0.51 0.06 8.98 0.00 0.40 0.62 0.40 0.62
Year_x_Year 0.19 0.07 2.88 0.00 0.06 0.33 0.06 0.33
30year_x_
Aluminium 0.14 0.07 2.17 0.03 0.01 0.27 0.01 0.27
Aluminium
vel1 -0.34 0.08
-
4.38 0.00 -0.49 -0.19 -0.49 -0.19
Aluminium
vel1 x
West Texas
vel1 0.66 0.12 5.68 0.00 0.43 0.89 0.43 0.89
SP500_x_
West_Texas_vel1 -0.67 0.10
-
6.44 0.00 -0.88 -0.47 -0.88 -0.47
Airline_
Index_vel1 -0.05 0.05
-
0.99 0.32 -0.15 0.05 -0.15 0.05
Copper_vel1 -0.03 0.05
-
0.60 0.55 -0.13 0.07 -0.13 0.07
SP500 0.24 0.08 3.17 0.00 0.09 0.39 0.09 0.39
Euro_vel1 0.04 0.06 0.71 0.48 -0.07 0.15 -0.07 0.15
UK_Pound_
vel1 -0.09 0.06
-
1.52 0.13 -0.20 0.02 -0.20 0.02
5
Paraphrase This Document
Need a fresh take? Get an instant paraphrase of this document with our AI Paraphraser
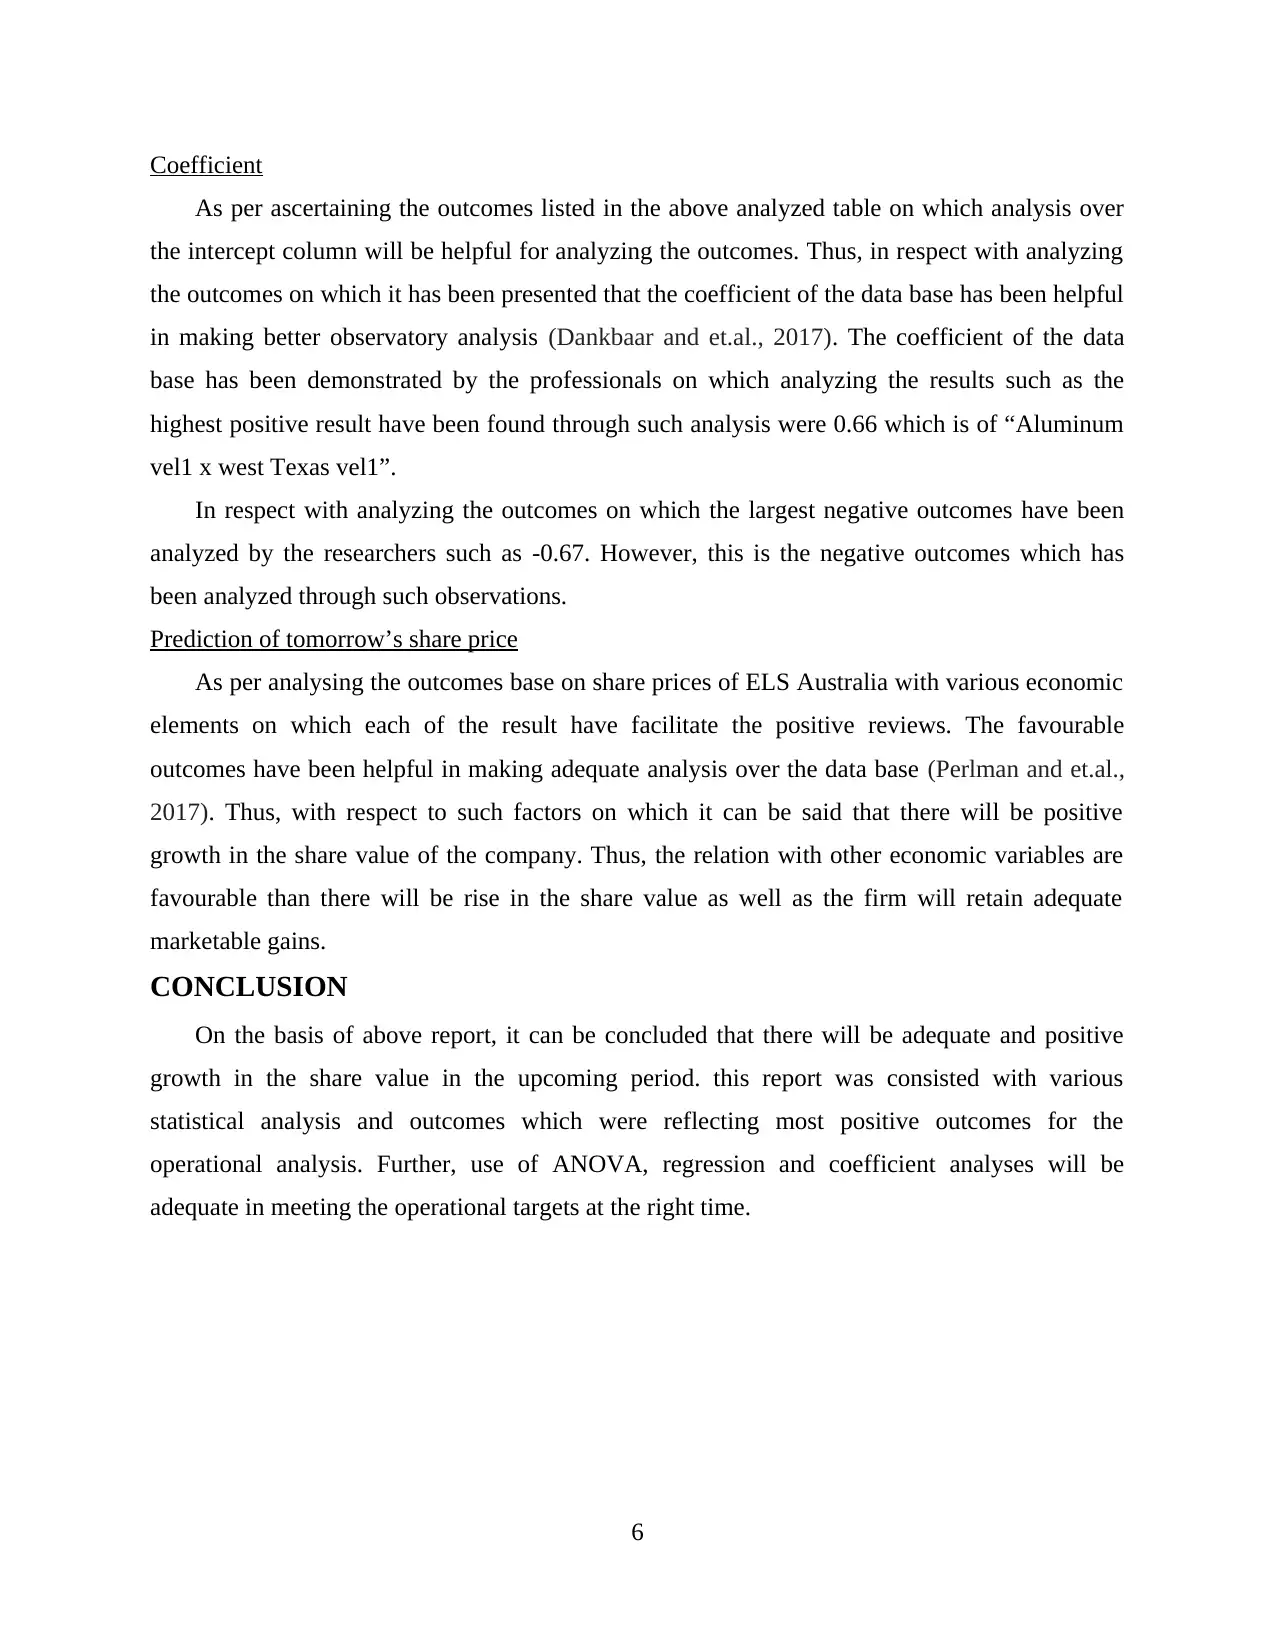
Coefficient
As per ascertaining the outcomes listed in the above analyzed table on which analysis over
the intercept column will be helpful for analyzing the outcomes. Thus, in respect with analyzing
the outcomes on which it has been presented that the coefficient of the data base has been helpful
in making better observatory analysis (Dankbaar and et.al., 2017). The coefficient of the data
base has been demonstrated by the professionals on which analyzing the results such as the
highest positive result have been found through such analysis were 0.66 which is of “Aluminum
vel1 x west Texas vel1”.
In respect with analyzing the outcomes on which the largest negative outcomes have been
analyzed by the researchers such as -0.67. However, this is the negative outcomes which has
been analyzed through such observations.
Prediction of tomorrow’s share price
As per analysing the outcomes base on share prices of ELS Australia with various economic
elements on which each of the result have facilitate the positive reviews. The favourable
outcomes have been helpful in making adequate analysis over the data base (Perlman and et.al.,
2017). Thus, with respect to such factors on which it can be said that there will be positive
growth in the share value of the company. Thus, the relation with other economic variables are
favourable than there will be rise in the share value as well as the firm will retain adequate
marketable gains.
CONCLUSION
On the basis of above report, it can be concluded that there will be adequate and positive
growth in the share value in the upcoming period. this report was consisted with various
statistical analysis and outcomes which were reflecting most positive outcomes for the
operational analysis. Further, use of ANOVA, regression and coefficient analyses will be
adequate in meeting the operational targets at the right time.
6
REFERENCES
Books and Journals
Dankbaar, J. W. and et.al., 2017. Prediction of clinical outcome after acute ischemic stroke: the
value of repeated noncontrast computed tomography, computed tomographic
angiography, and computed tomographic perfusion. Stroke. 48(9). pp.2593-2596.
Gao, Y. and et.al., 2018. RaptorX-Angle: real-value prediction of protein backbone dihedral
angles through a hybrid method of clustering and deep learning. BMC
bioinformatics. 19(4). p.100.
Perlman, S. and et.al., 2017. P12. 11: Prenatal severe hydronephrosis: the added value of
CAKUT in the prediction of postnatal outcome. Ultrasound in Obstetrics &
Gynecology. 50. pp.193-193.
Tura, A. and et.al., 2018. Prediction of clamp-derived insulin sensitivity from the oral glucose
insulin sensitivity index. Diabetologia. 61(5). pp.1135-1141.
Yang, Y. and et.al., 2017. Spider2: A package to predict secondary structure, accessible surface
area, and main-chain torsional angles by deep neural networks. In Prediction of Protein
Secondary Structure (pp. 55-63). Humana Press, New York, NY.
Online
Coefficient of Determination. 2018. [Online]. Available through :<
https://www.statisticshowto.datasciencecentral.com/probability-and-statistics/coefficient-
of-determination-r-squared/>.
7
⊘ This is a preview!⊘
Do you want full access?
Subscribe today to unlock all pages.
Trusted by 1+ million students worldwide

APPENDIX
VIF value:
8
VIF value:
8
1 out of 10
Related Documents


Your All-in-One AI-Powered Toolkit for Academic Success.
+13062052269
info@desklib.com
Available 24*7 on WhatsApp / Email
![[object Object]](/_next/static/media/star-bottom.7253800d.svg)
Unlock your academic potential
Copyright © 2020–2026 A2Z Services. All Rights Reserved. Developed and managed by ZUCOL.