Real Estate Data Analysis Report: Price Prediction and Adv Spending
VerifiedAdded on 2019/11/26
|9
|2032
|304
Report
AI Summary
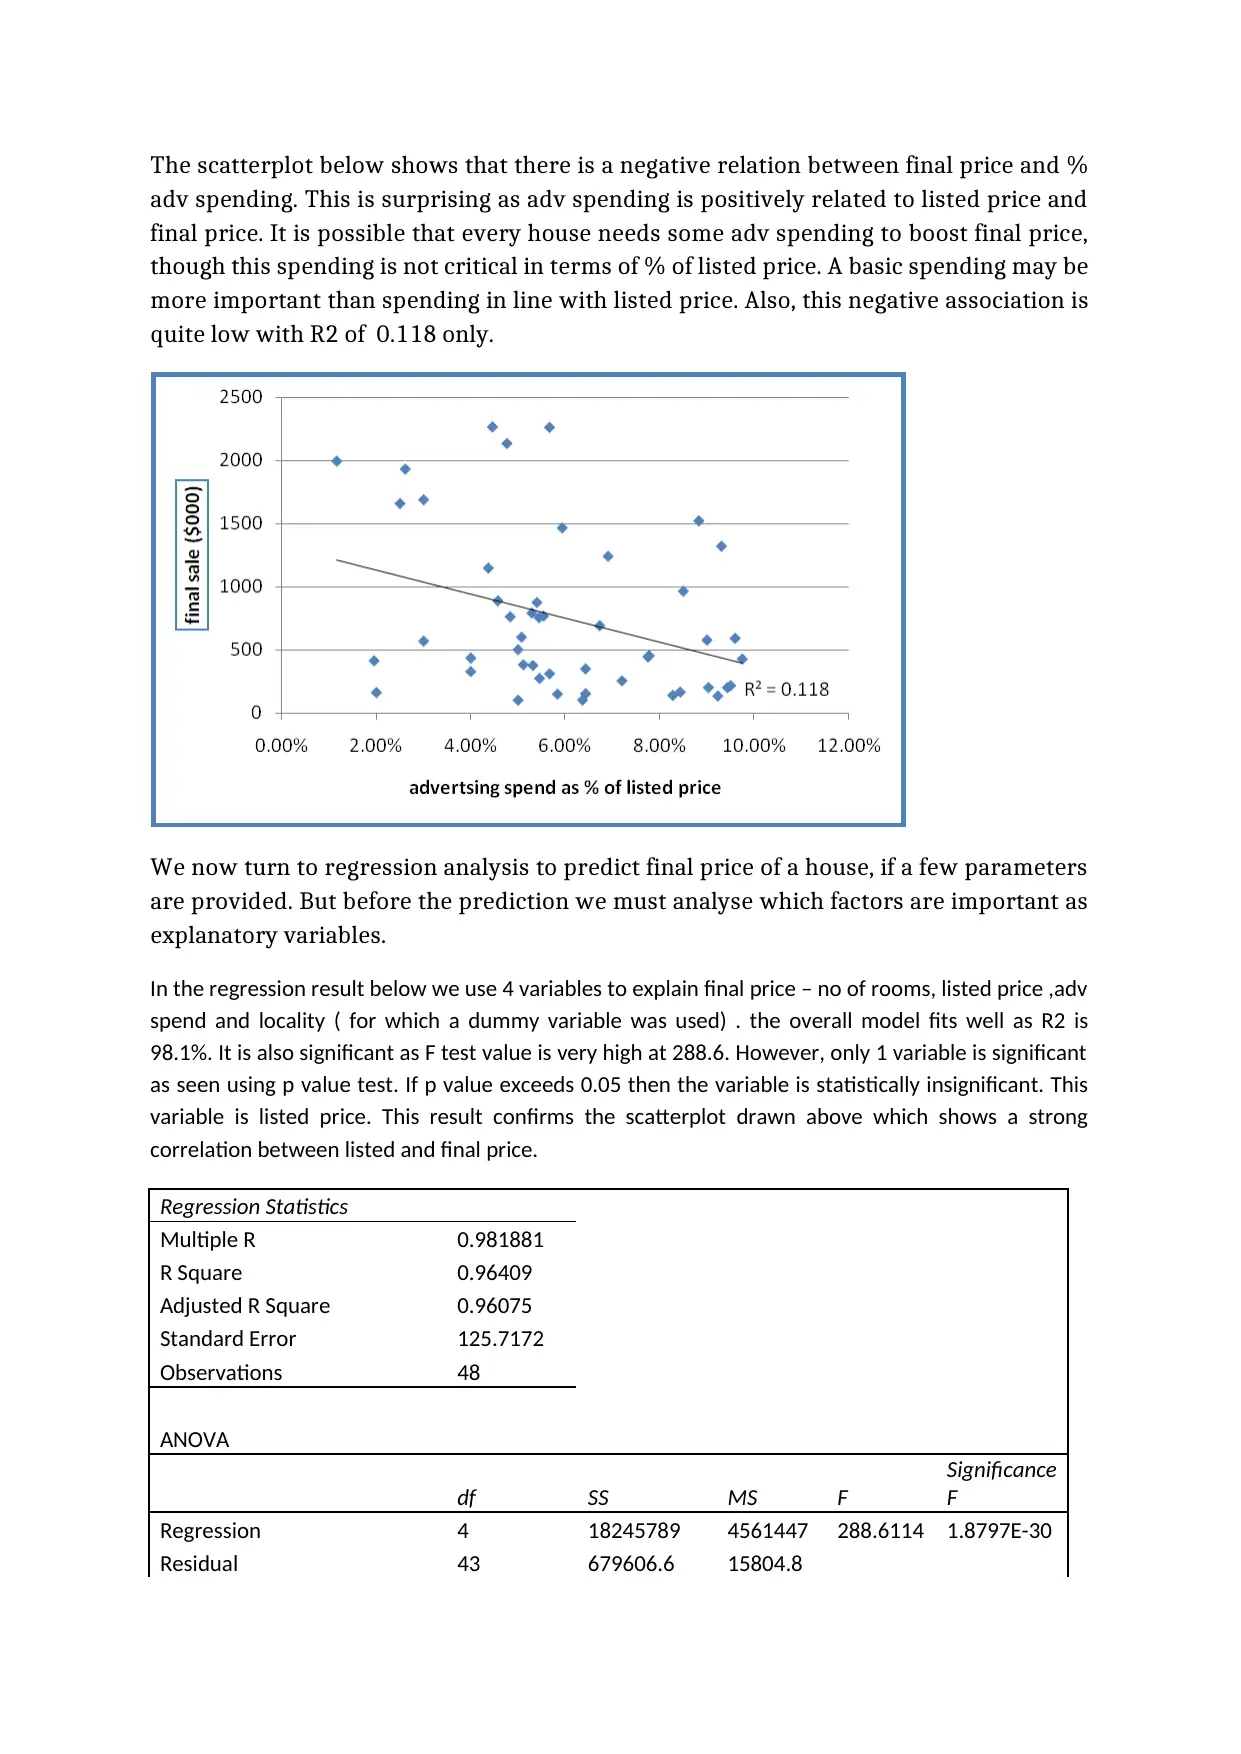
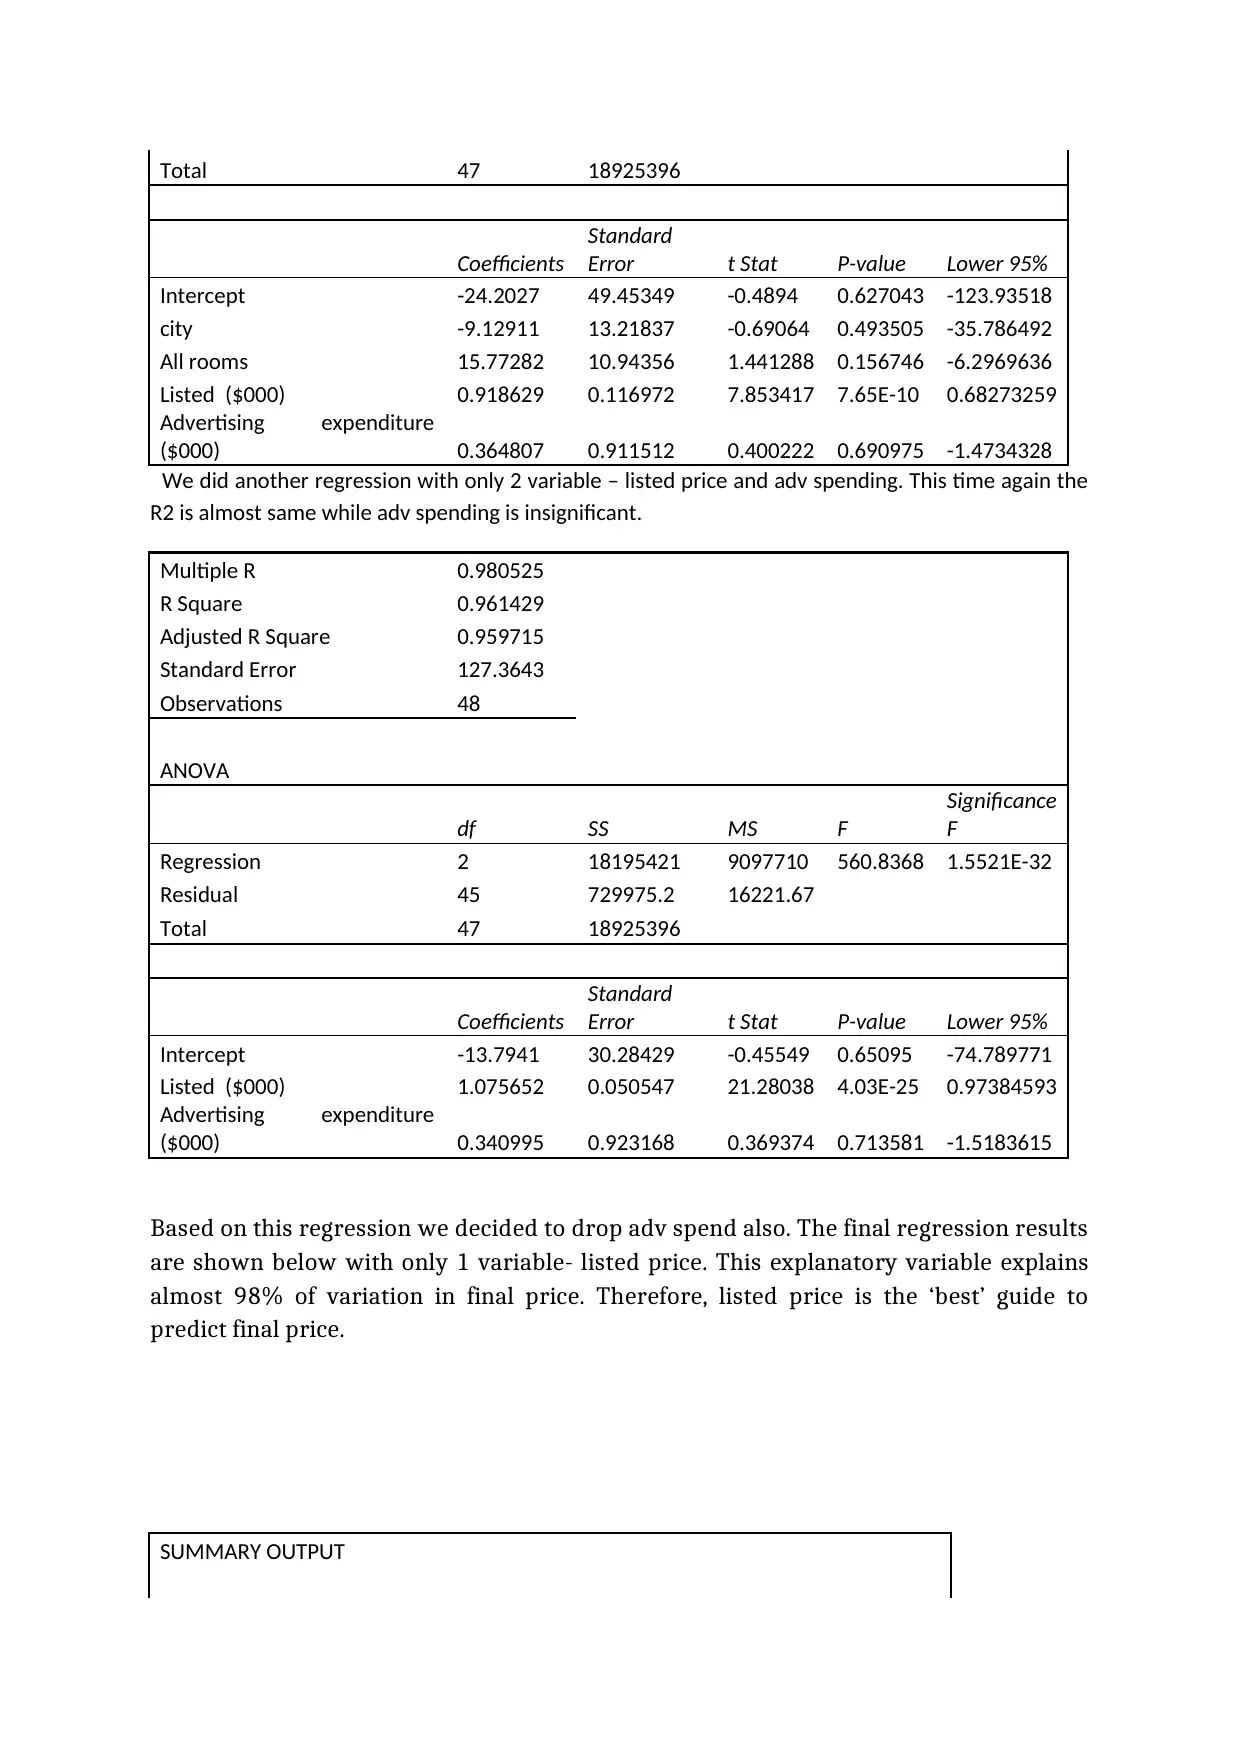
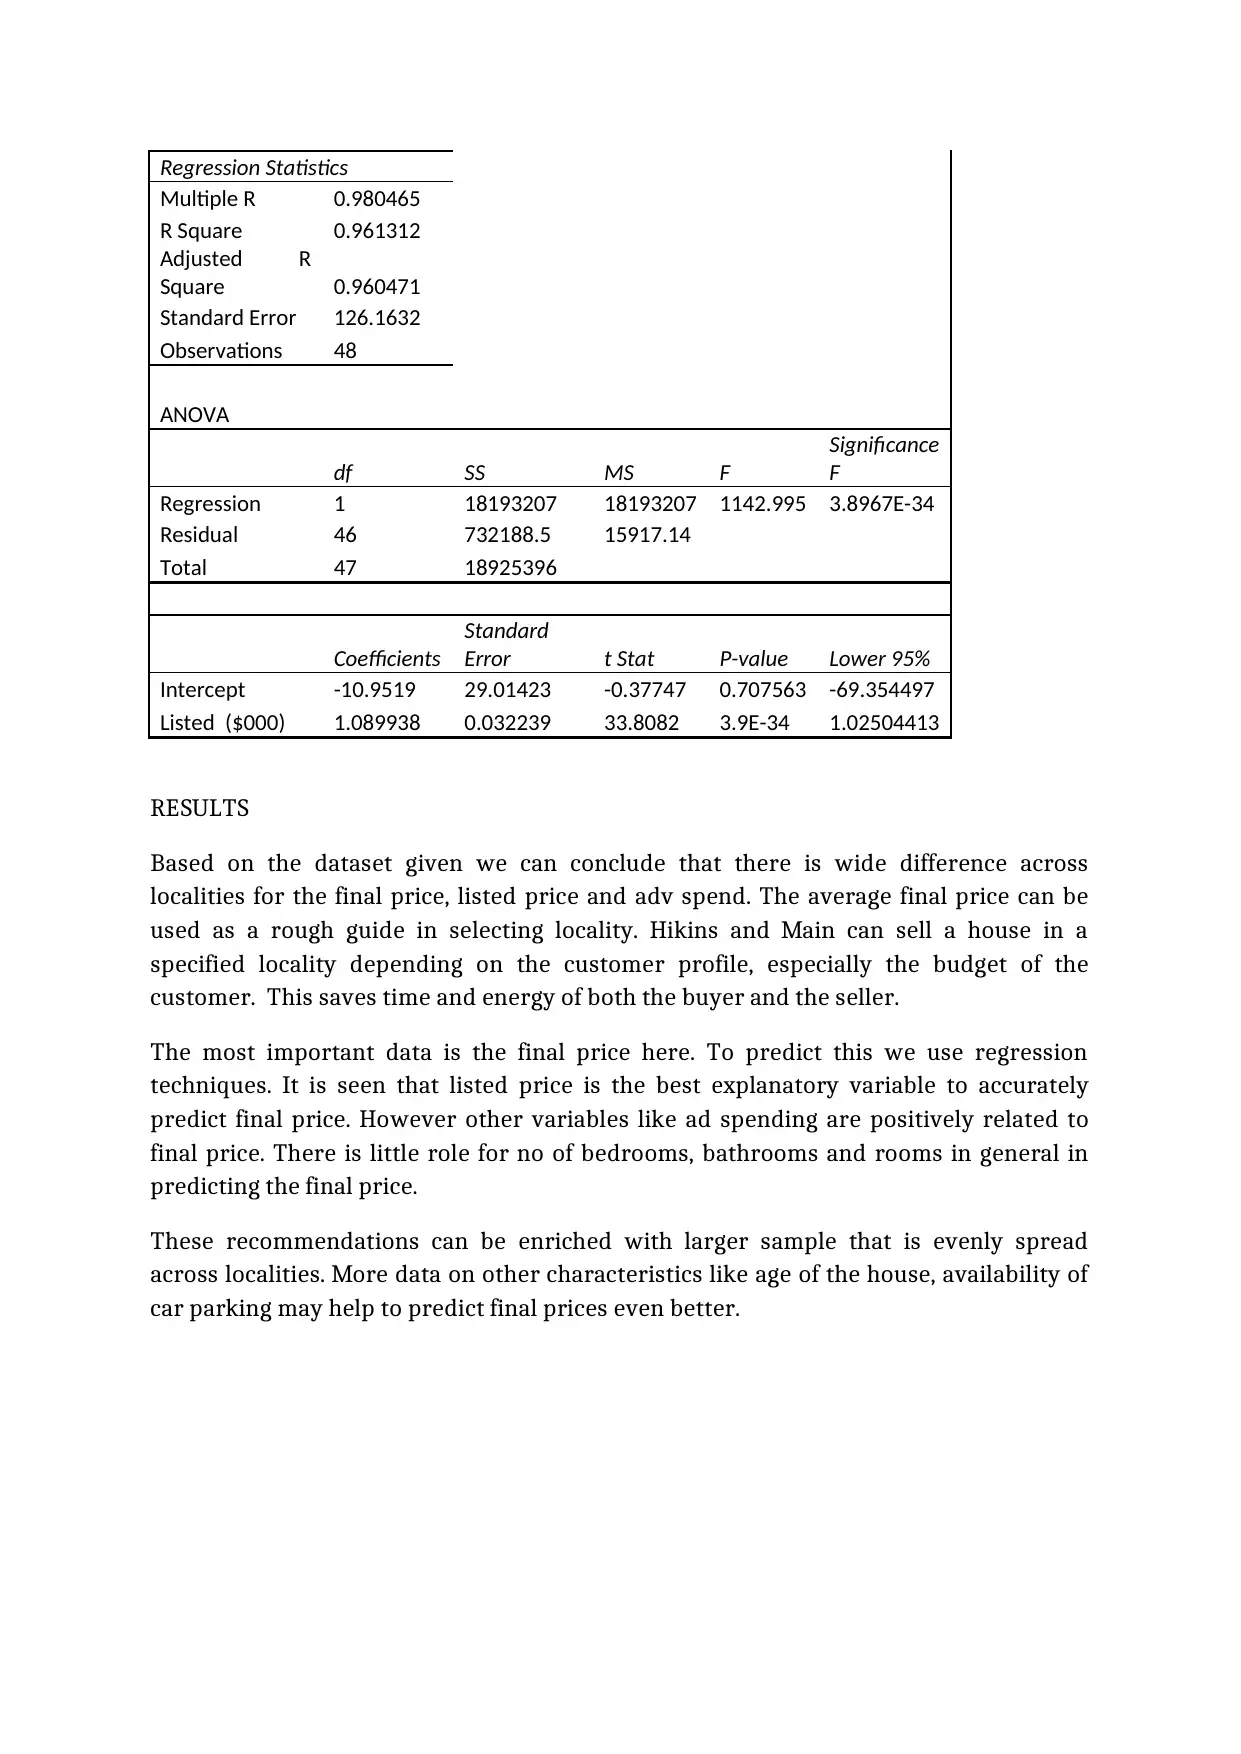
This report analyzes a dataset of 48 houses across different localities to address key research questions for real estate investment. The analysis employs statistical methods like measures of central tendency, dispersion, scatterplots, and regression techniques using Excel. The report investigates average house prices by locality, the impact of advertising spending on final prices, the relationship between listed and final prices, and predictive modeling for final prices. Key findings include the highest prices in Domaine, a positive correlation between advertising spend and final price (though moderate), and a strong positive association between listed and final prices. Regression analysis reveals that listed price is the most significant predictor of final price, explaining approximately 98% of the variation. The report concludes with recommendations for investors, emphasizing the importance of listed price in predicting final sale price and suggesting the need for a larger, more evenly distributed sample size for further analysis.

1 out of 9
Related Documents


Your All-in-One AI-Powered Toolkit for Academic Success.
+13062052269
info@desklib.com
Available 24*7 on WhatsApp / Email
![[object Object]](/_next/static/media/star-bottom.7253800d.svg)
Copyright © 2020–2026 A2Z Services. All Rights Reserved. Developed and managed by ZUCOL.