Detailed Solution of HI6007 Statistics Assignment-Holmes Institute
VerifiedAdded on 2023/06/04
|10
|1103
|376
Homework Assignment
AI Summary
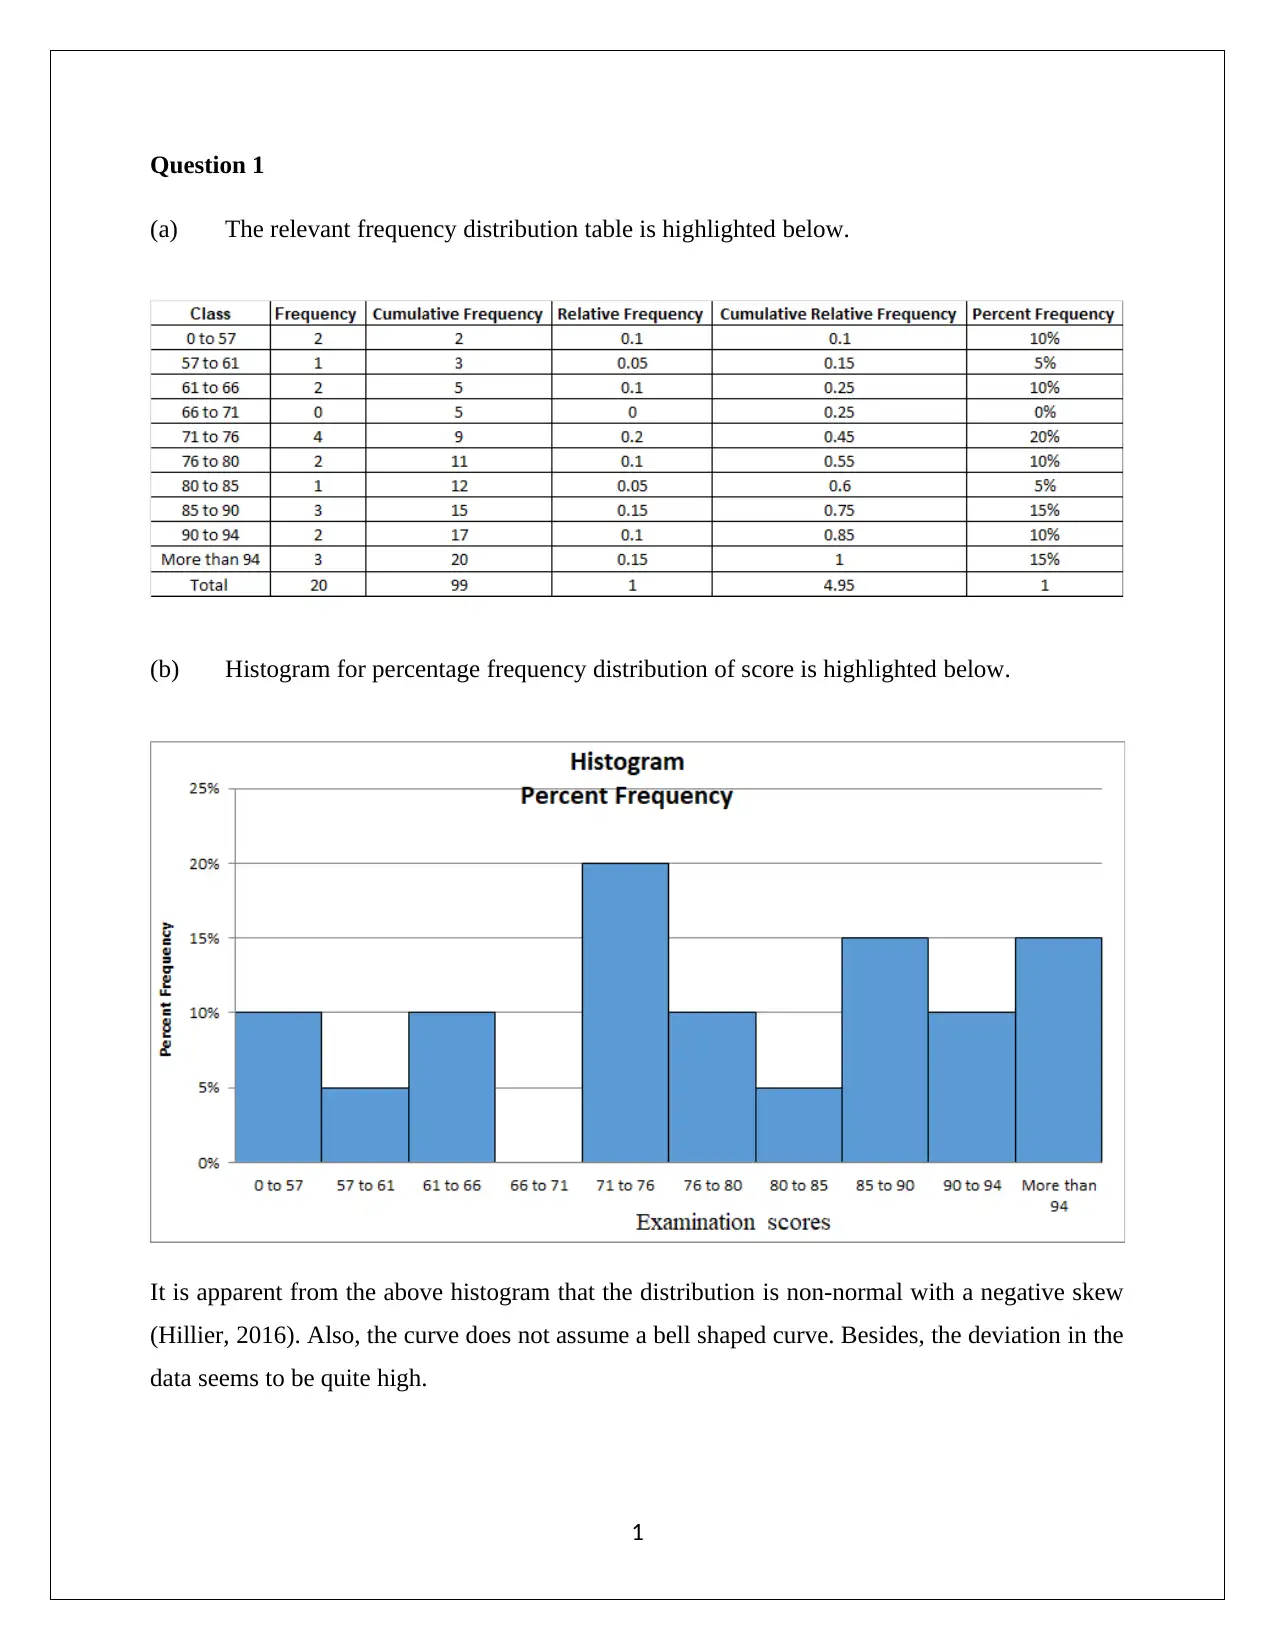
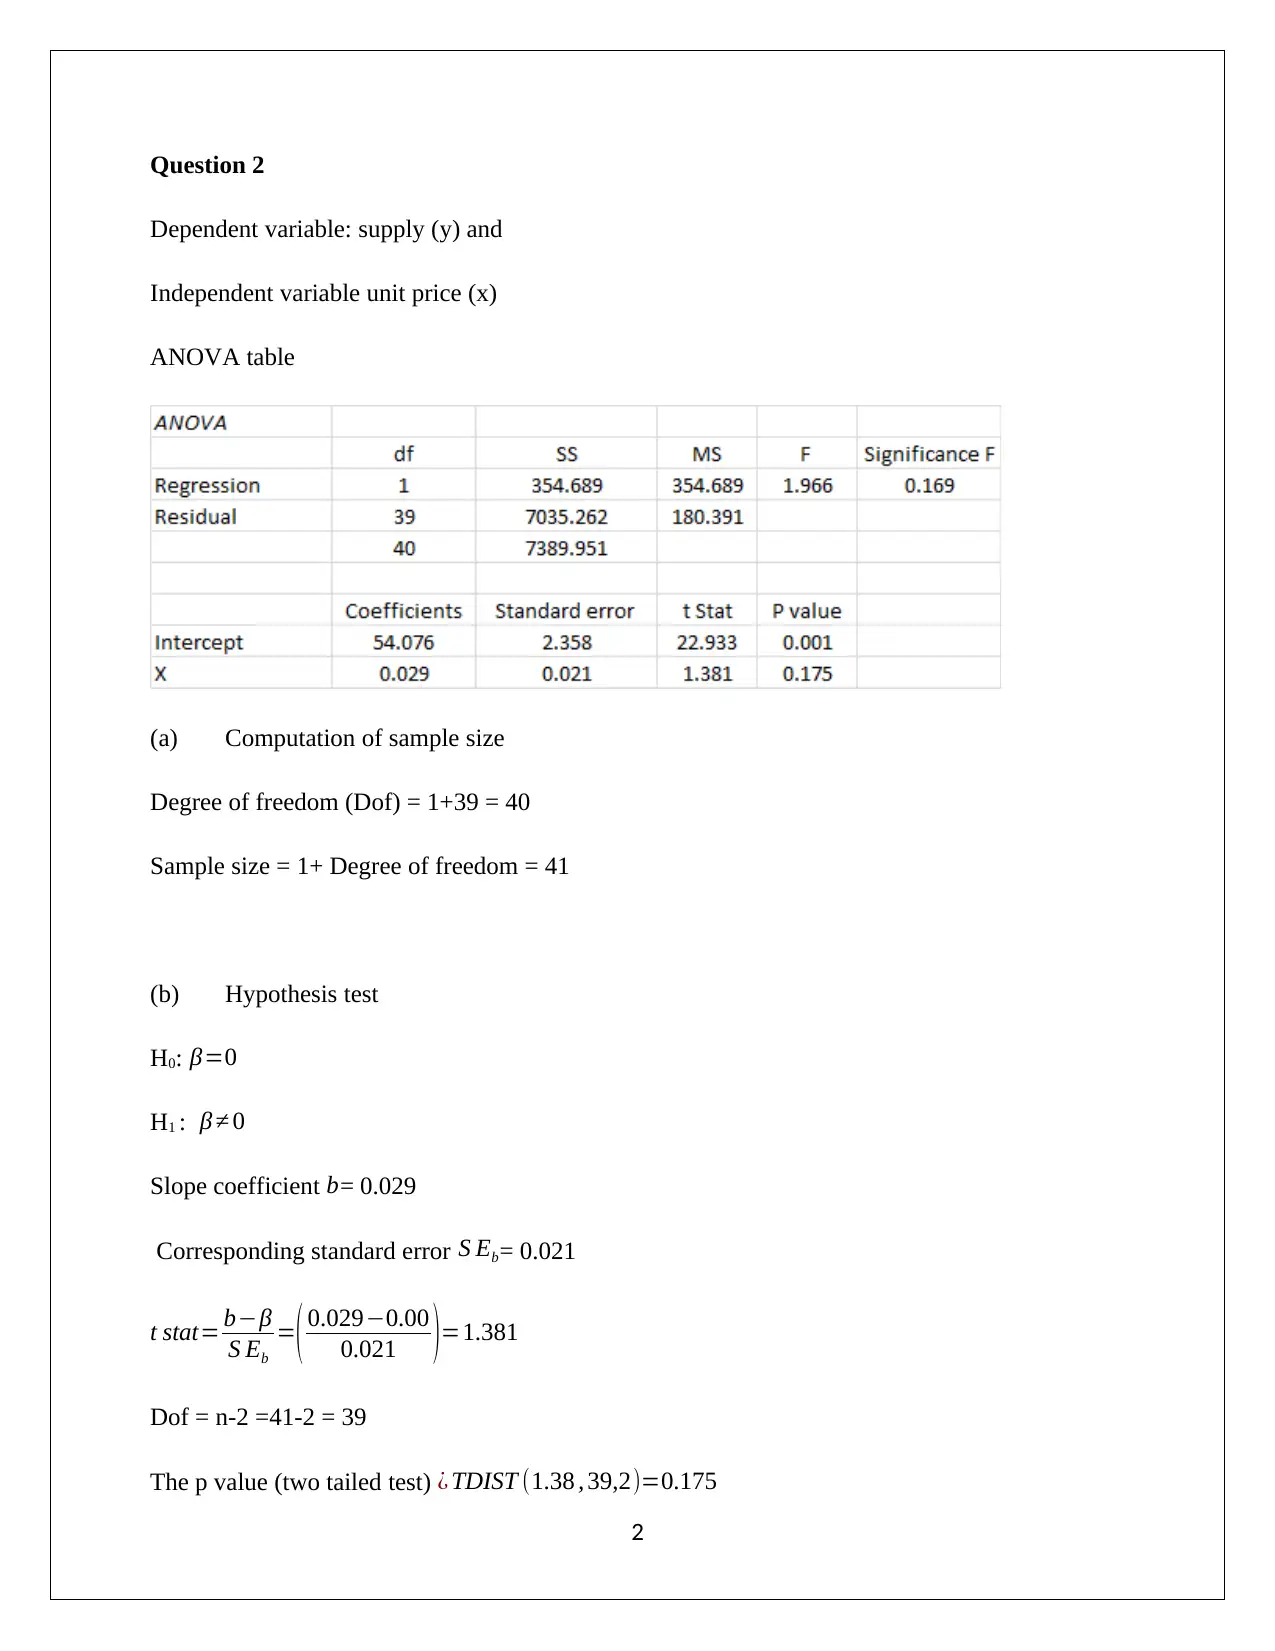
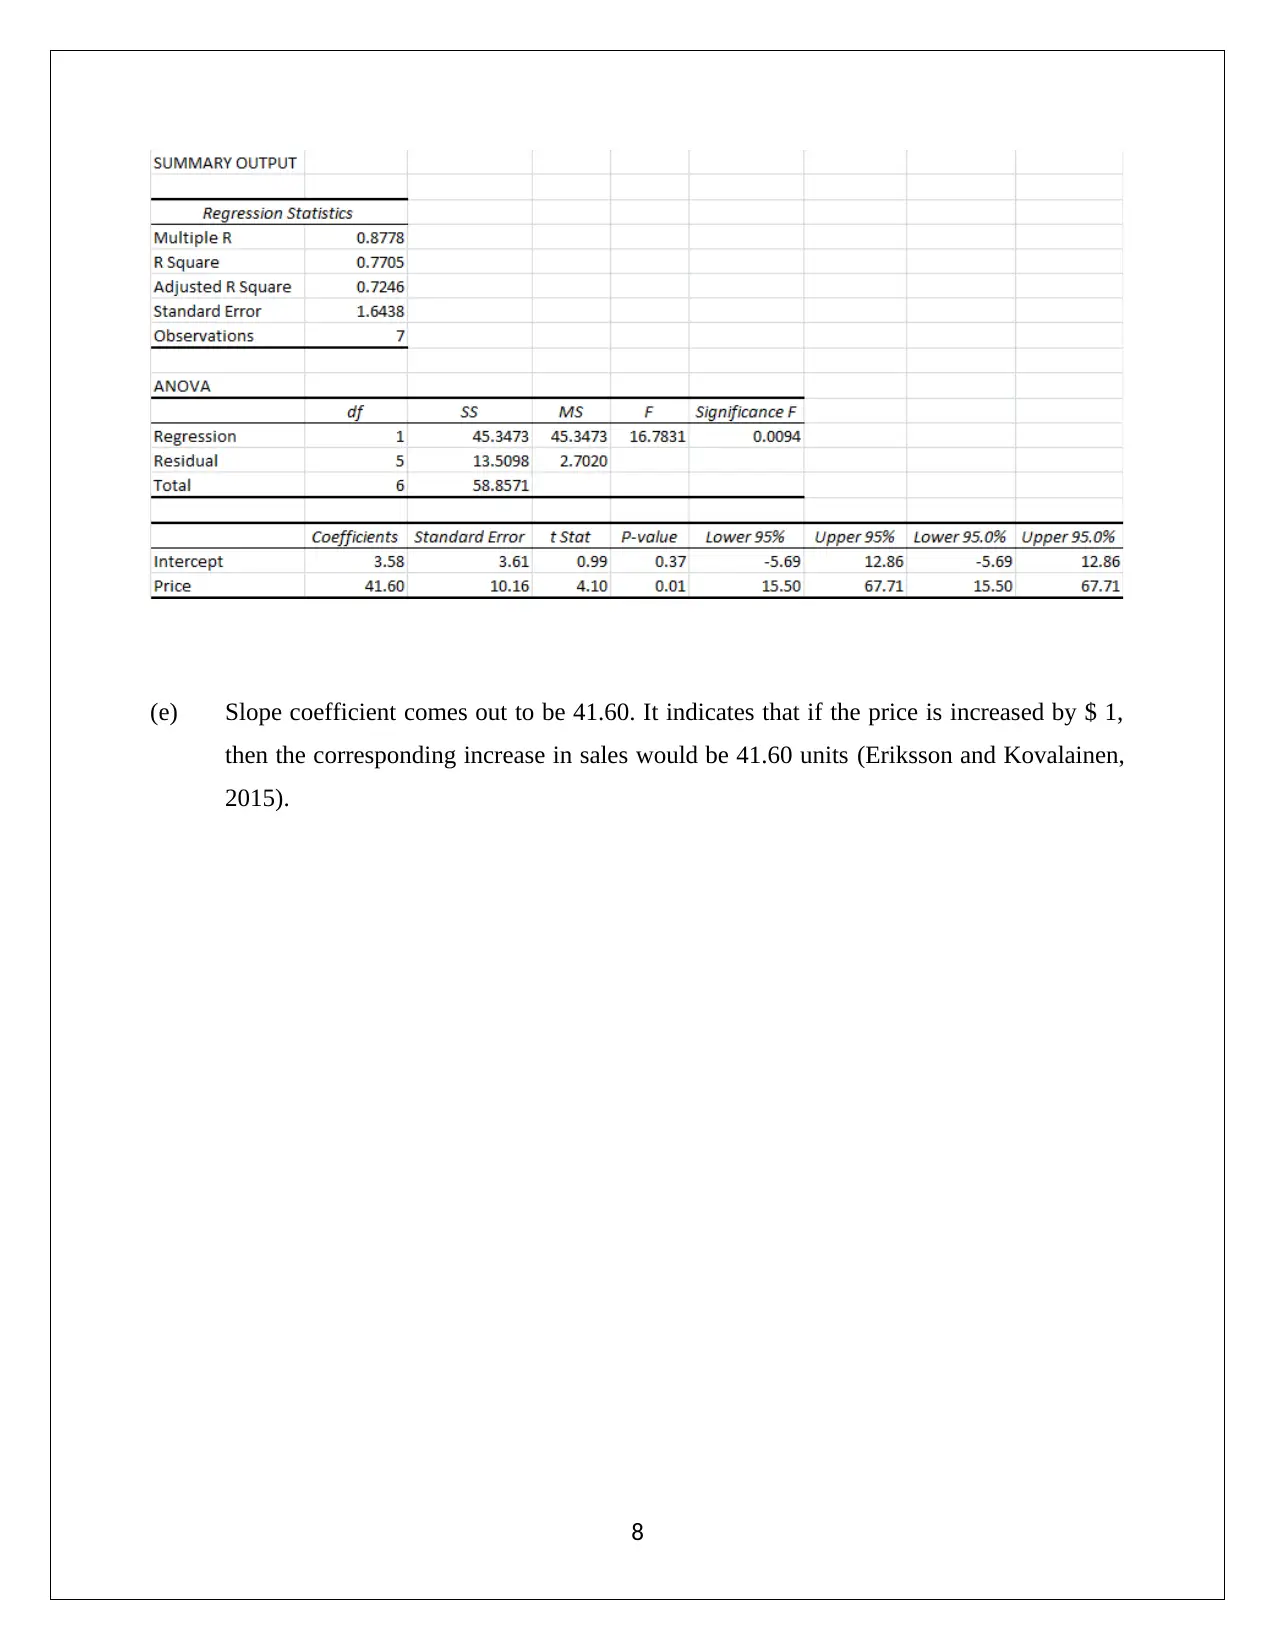
This document presents a comprehensive solution to a statistics assignment, addressing various problems including the construction of frequency distributions and histograms, hypothesis testing using ANOVA and t-tests, regression analysis, and interpretation of statistical outputs. The solution covers calculations for sample size, coefficients of determination and correlation, and the development of regression equations to predict supply and sales. Specific questions involve analyzing examination scores, determining the relationship between unit price and supply, comparing group means, and assessing the significance of price and advertising on sales. The analysis includes detailed explanations of statistical concepts and interpretations of results, providing a thorough understanding of the solutions.
1 out of 10
Related Documents


Your All-in-One AI-Powered Toolkit for Academic Success.
+13062052269
info@desklib.com
Available 24*7 on WhatsApp / Email
![[object Object]](/_next/static/media/star-bottom.7253800d.svg)
Copyright © 2020–2026 A2Z Services. All Rights Reserved. Developed and managed by ZUCOL.