Holmes Institute HI6007 Statistics Group Assignment - Semester 2
VerifiedAdded on 2023/06/04
|9
|832
|317
Homework Assignment
AI Summary
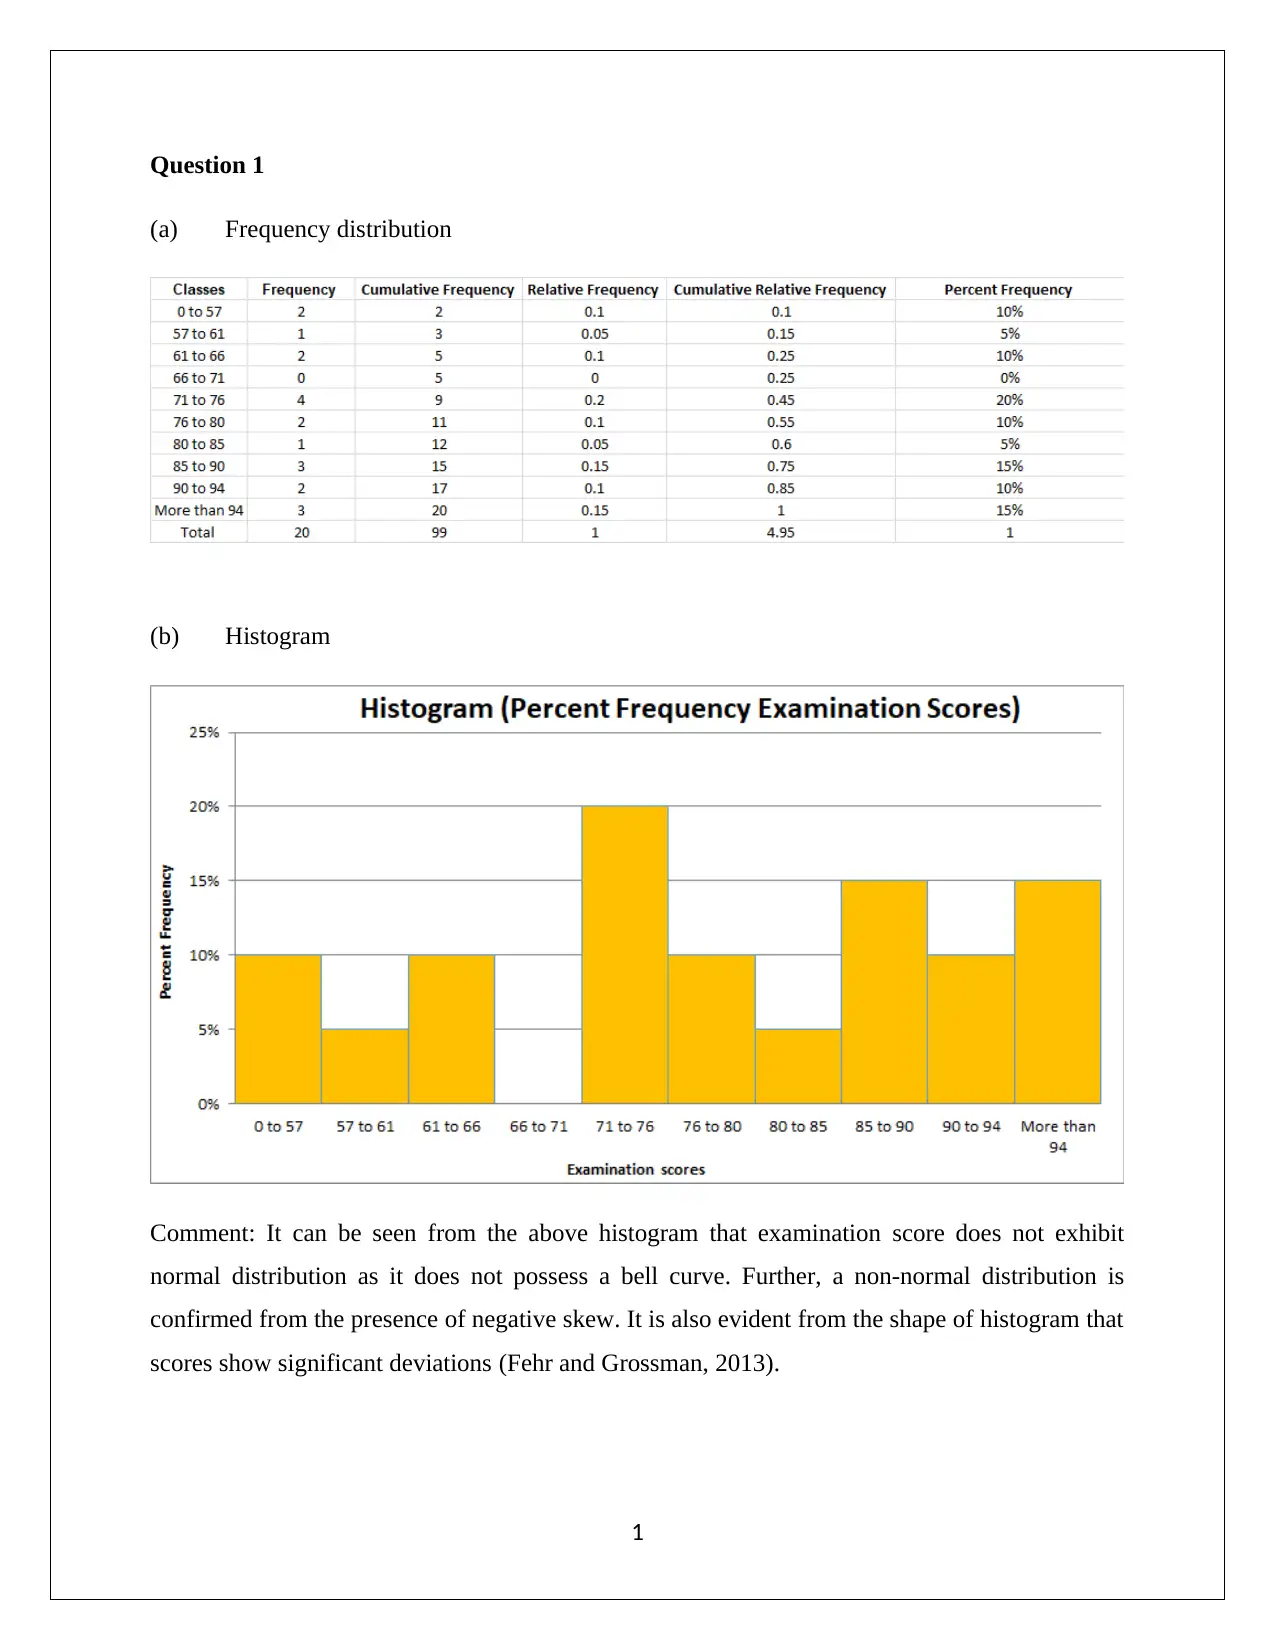
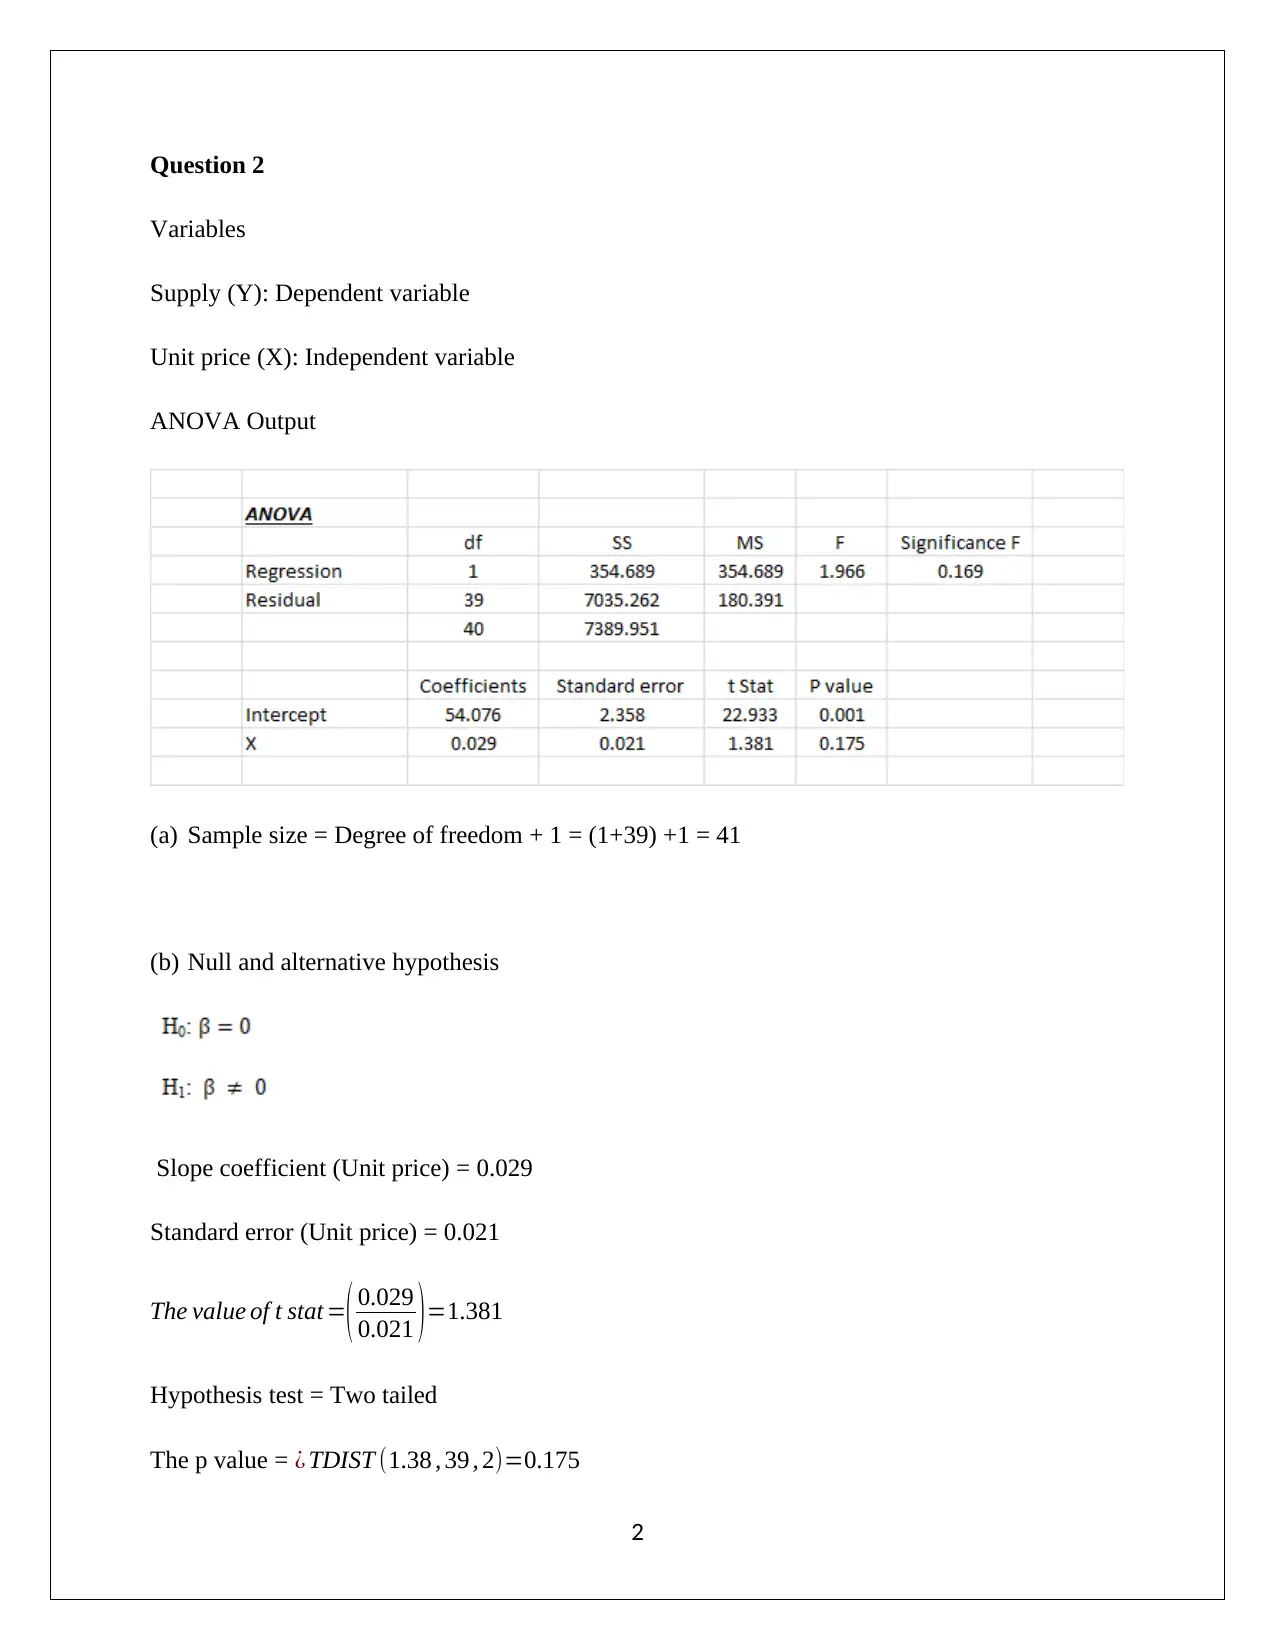
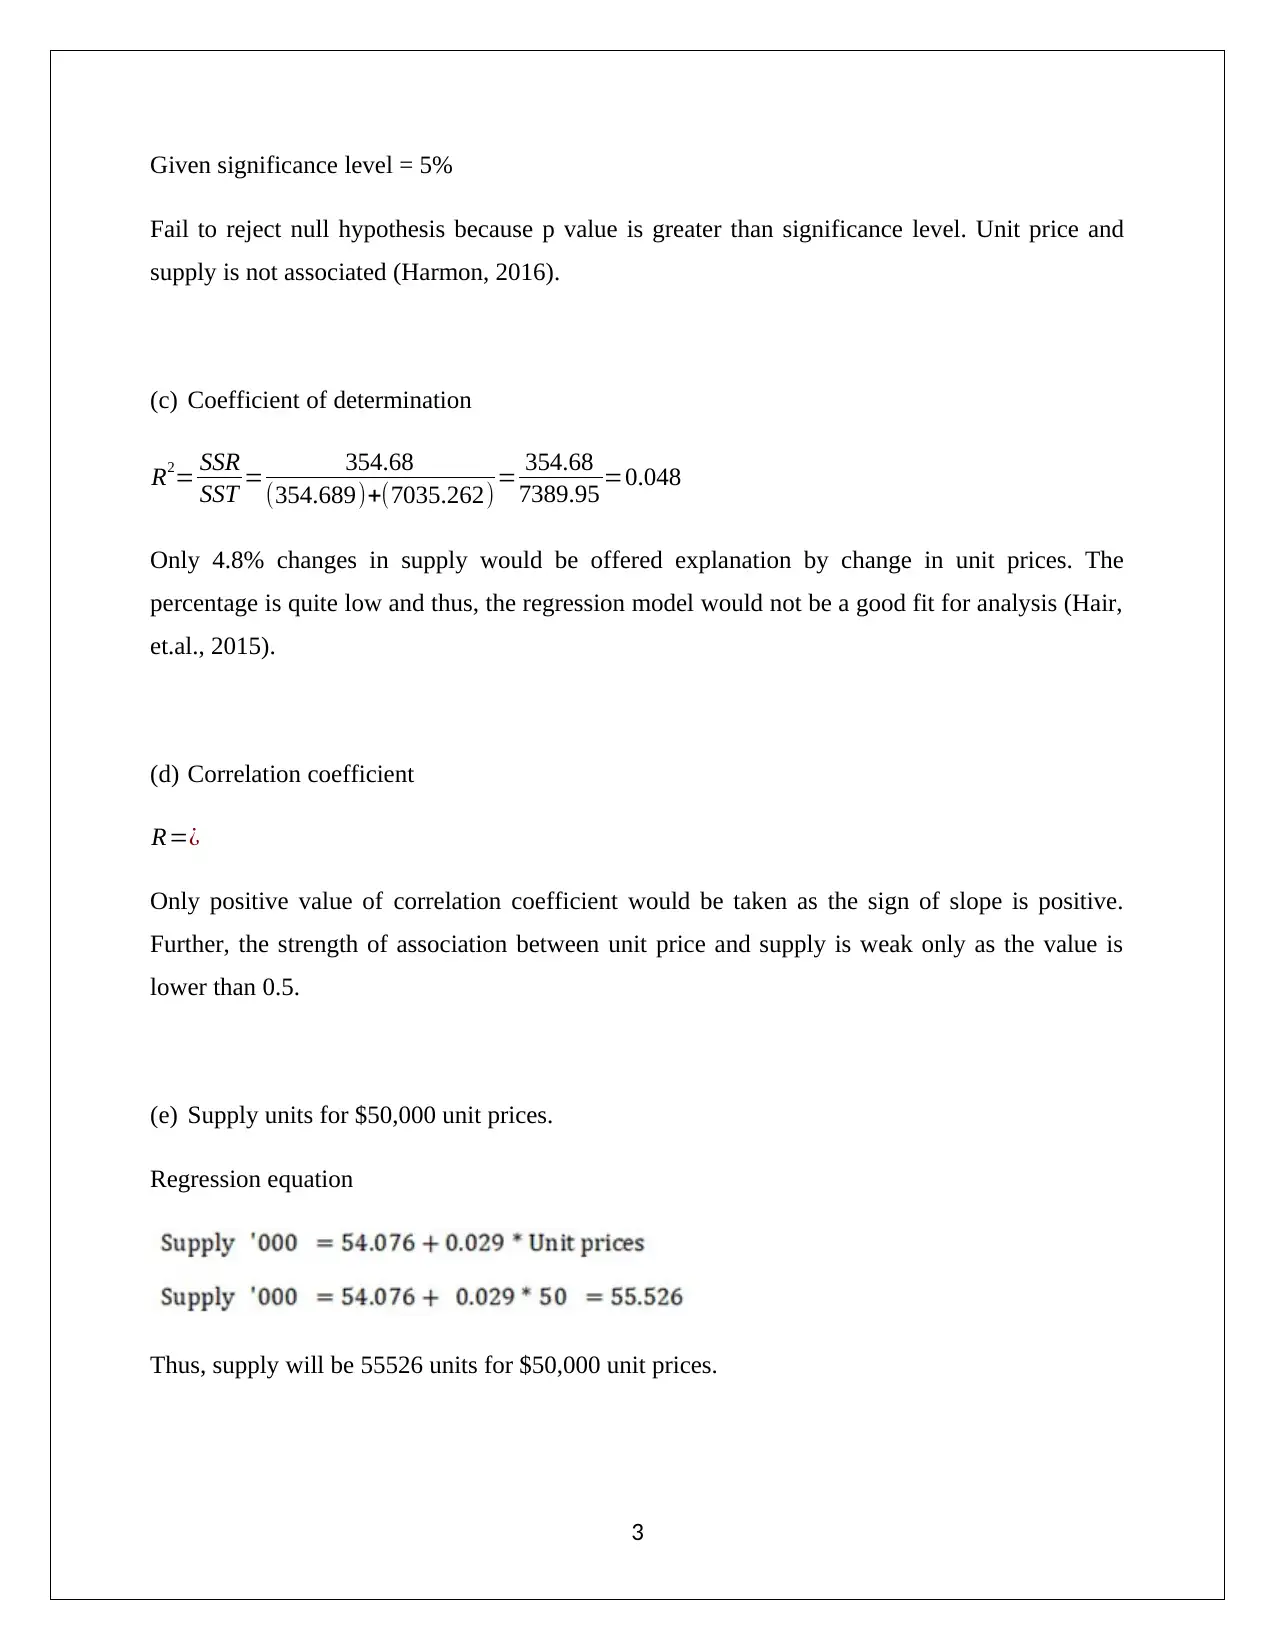
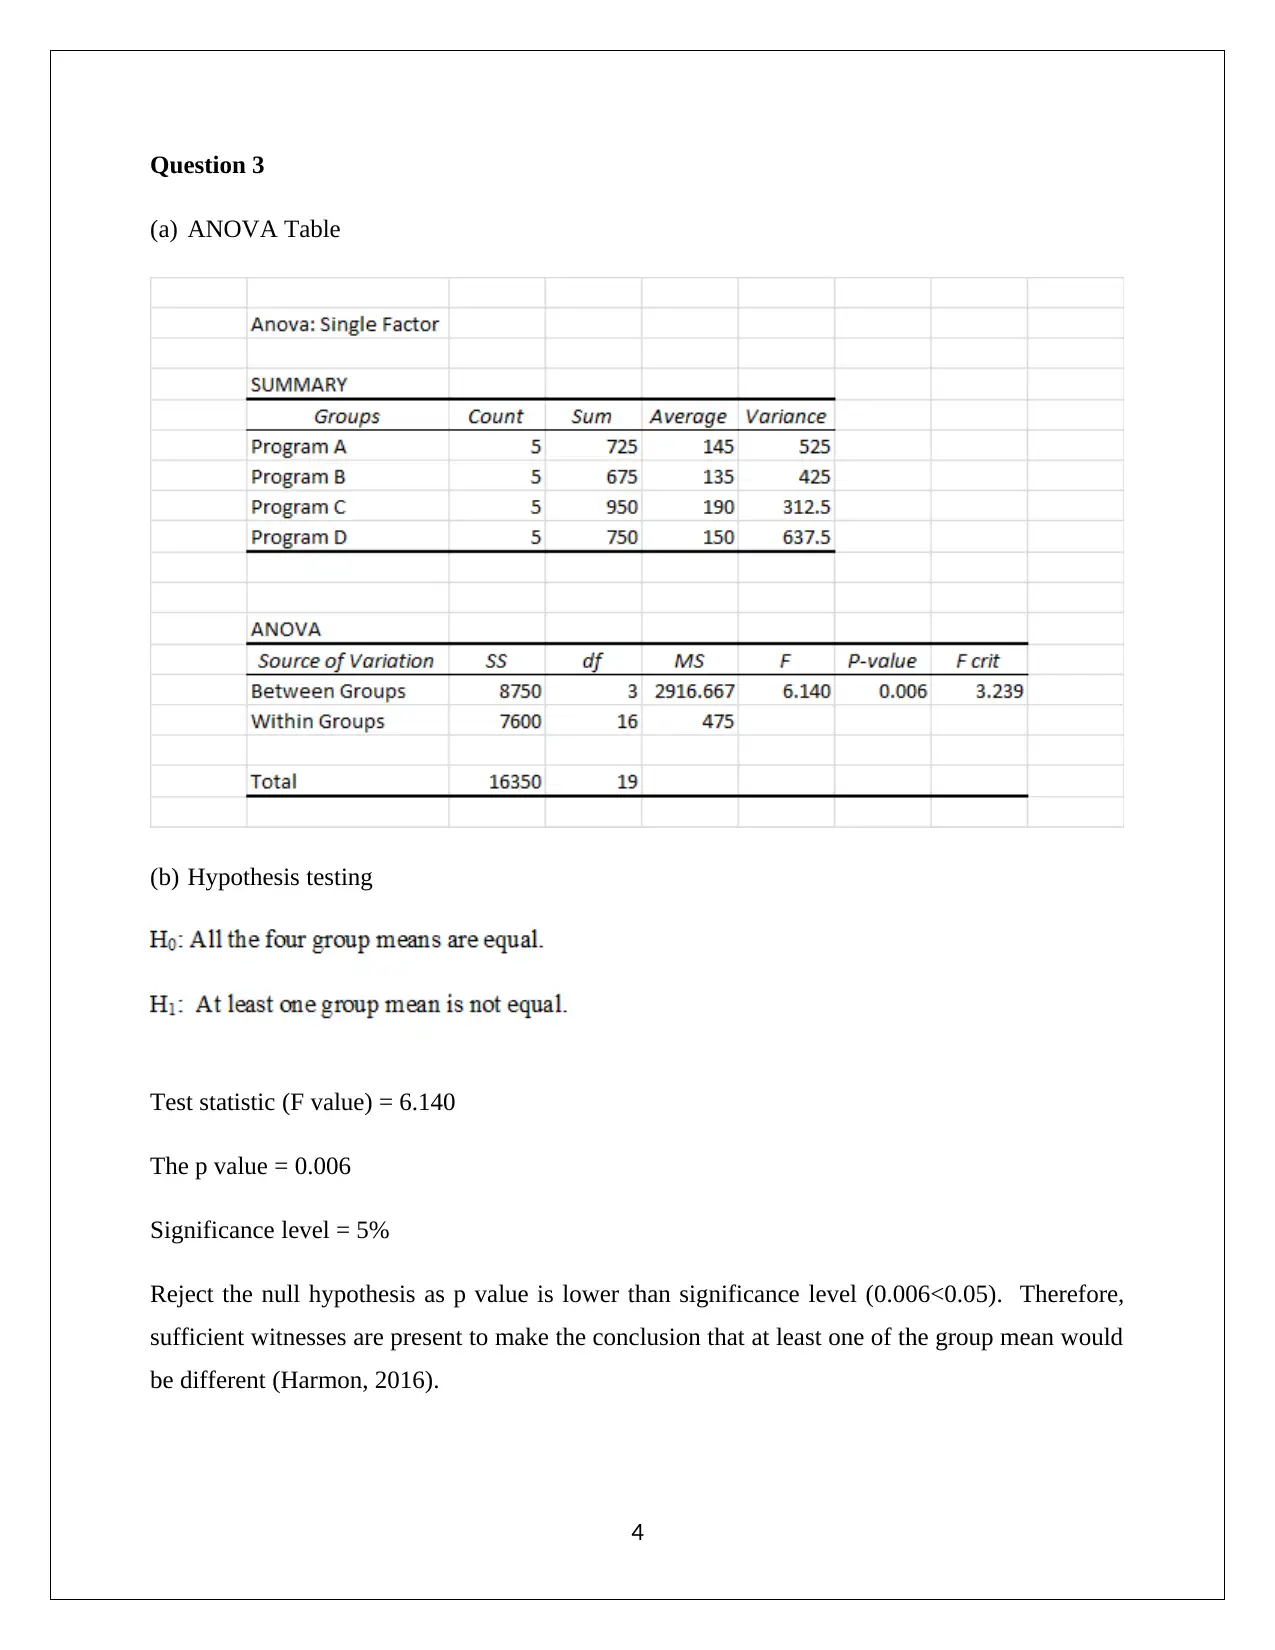
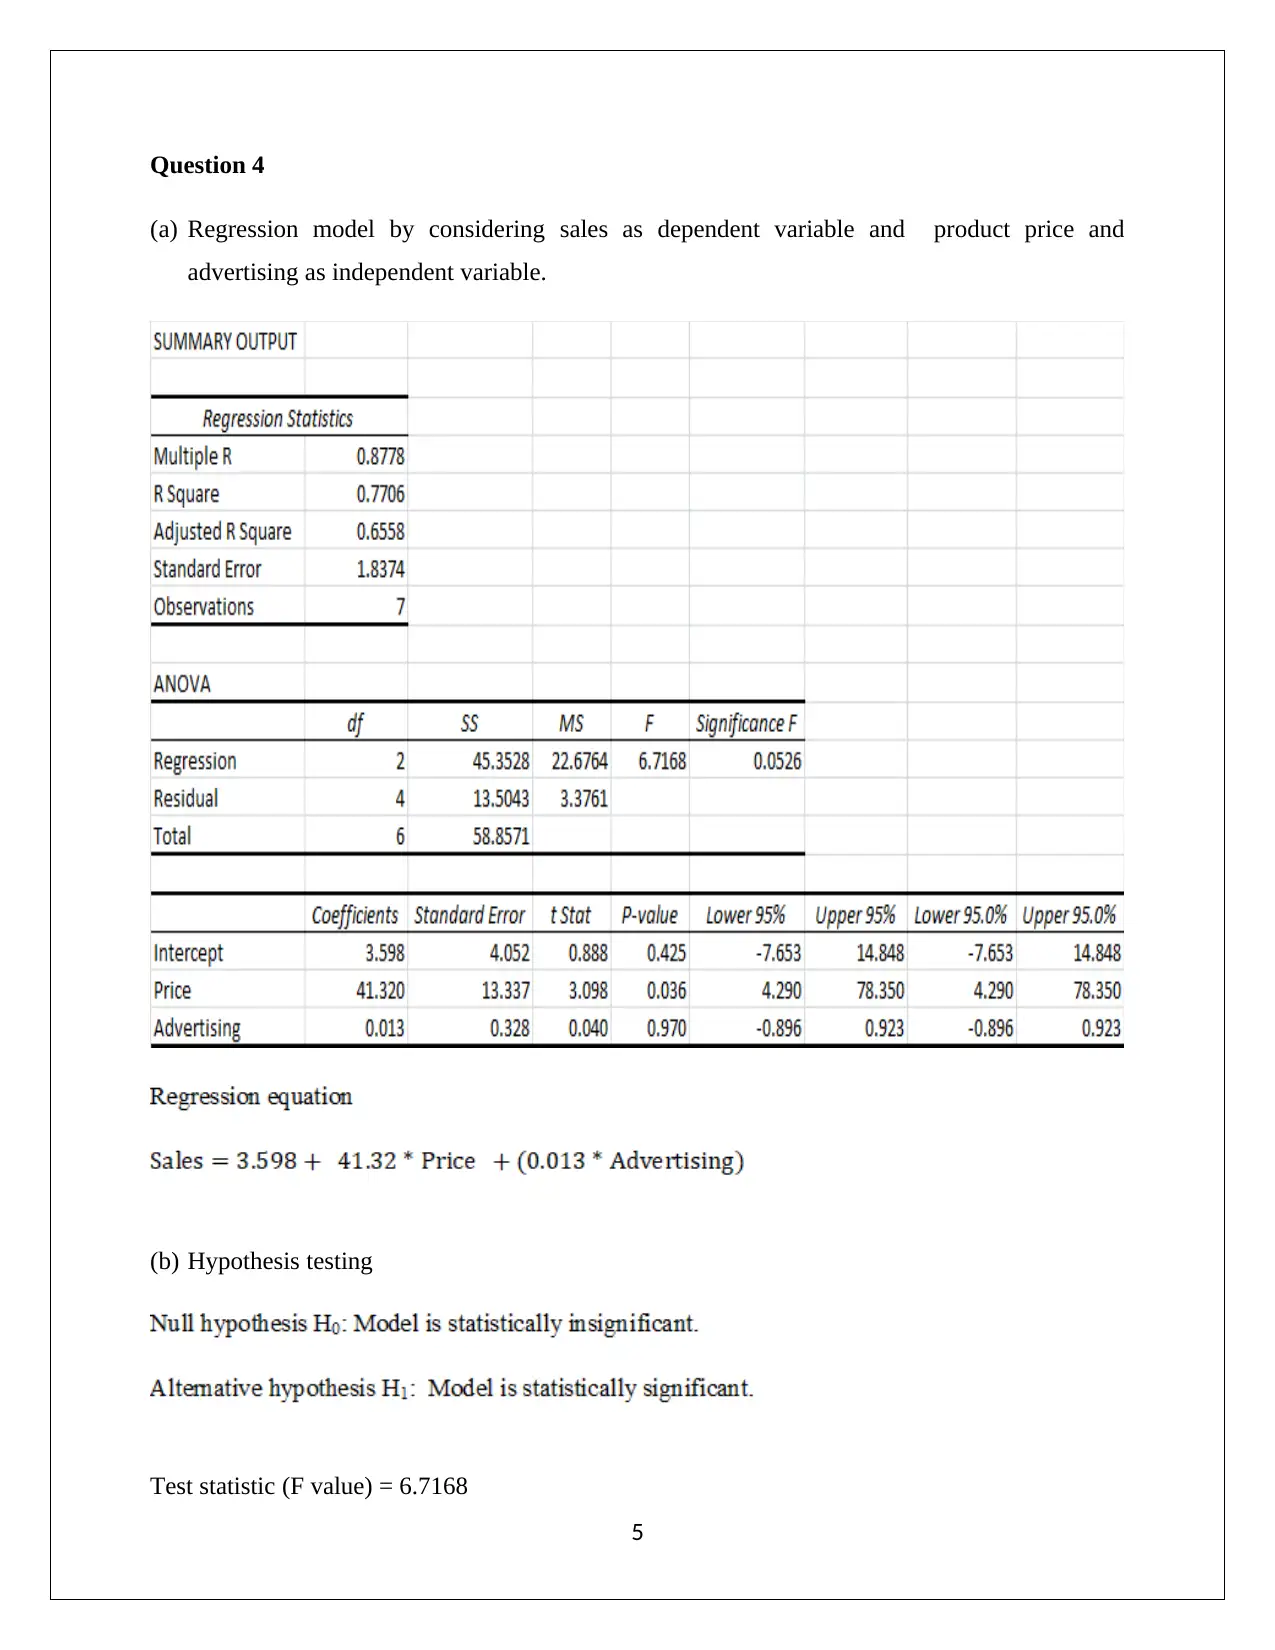
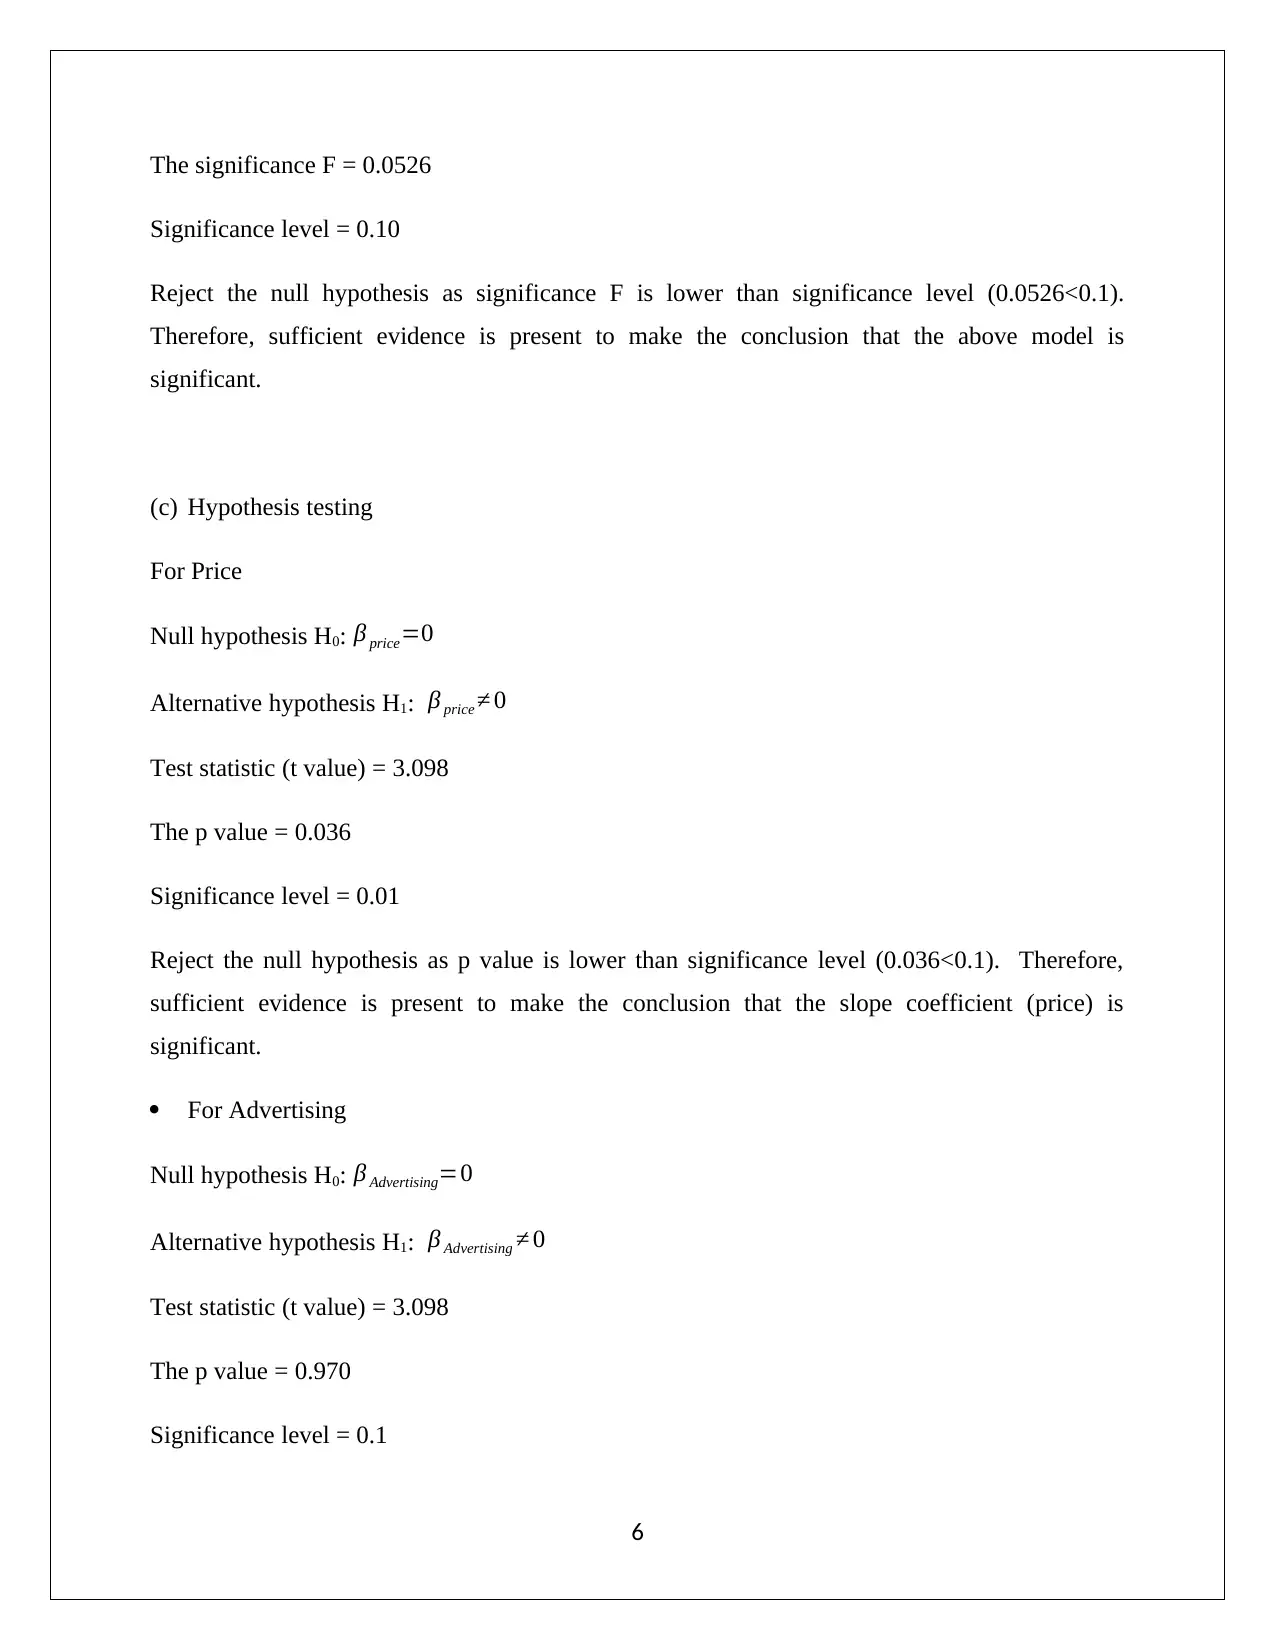
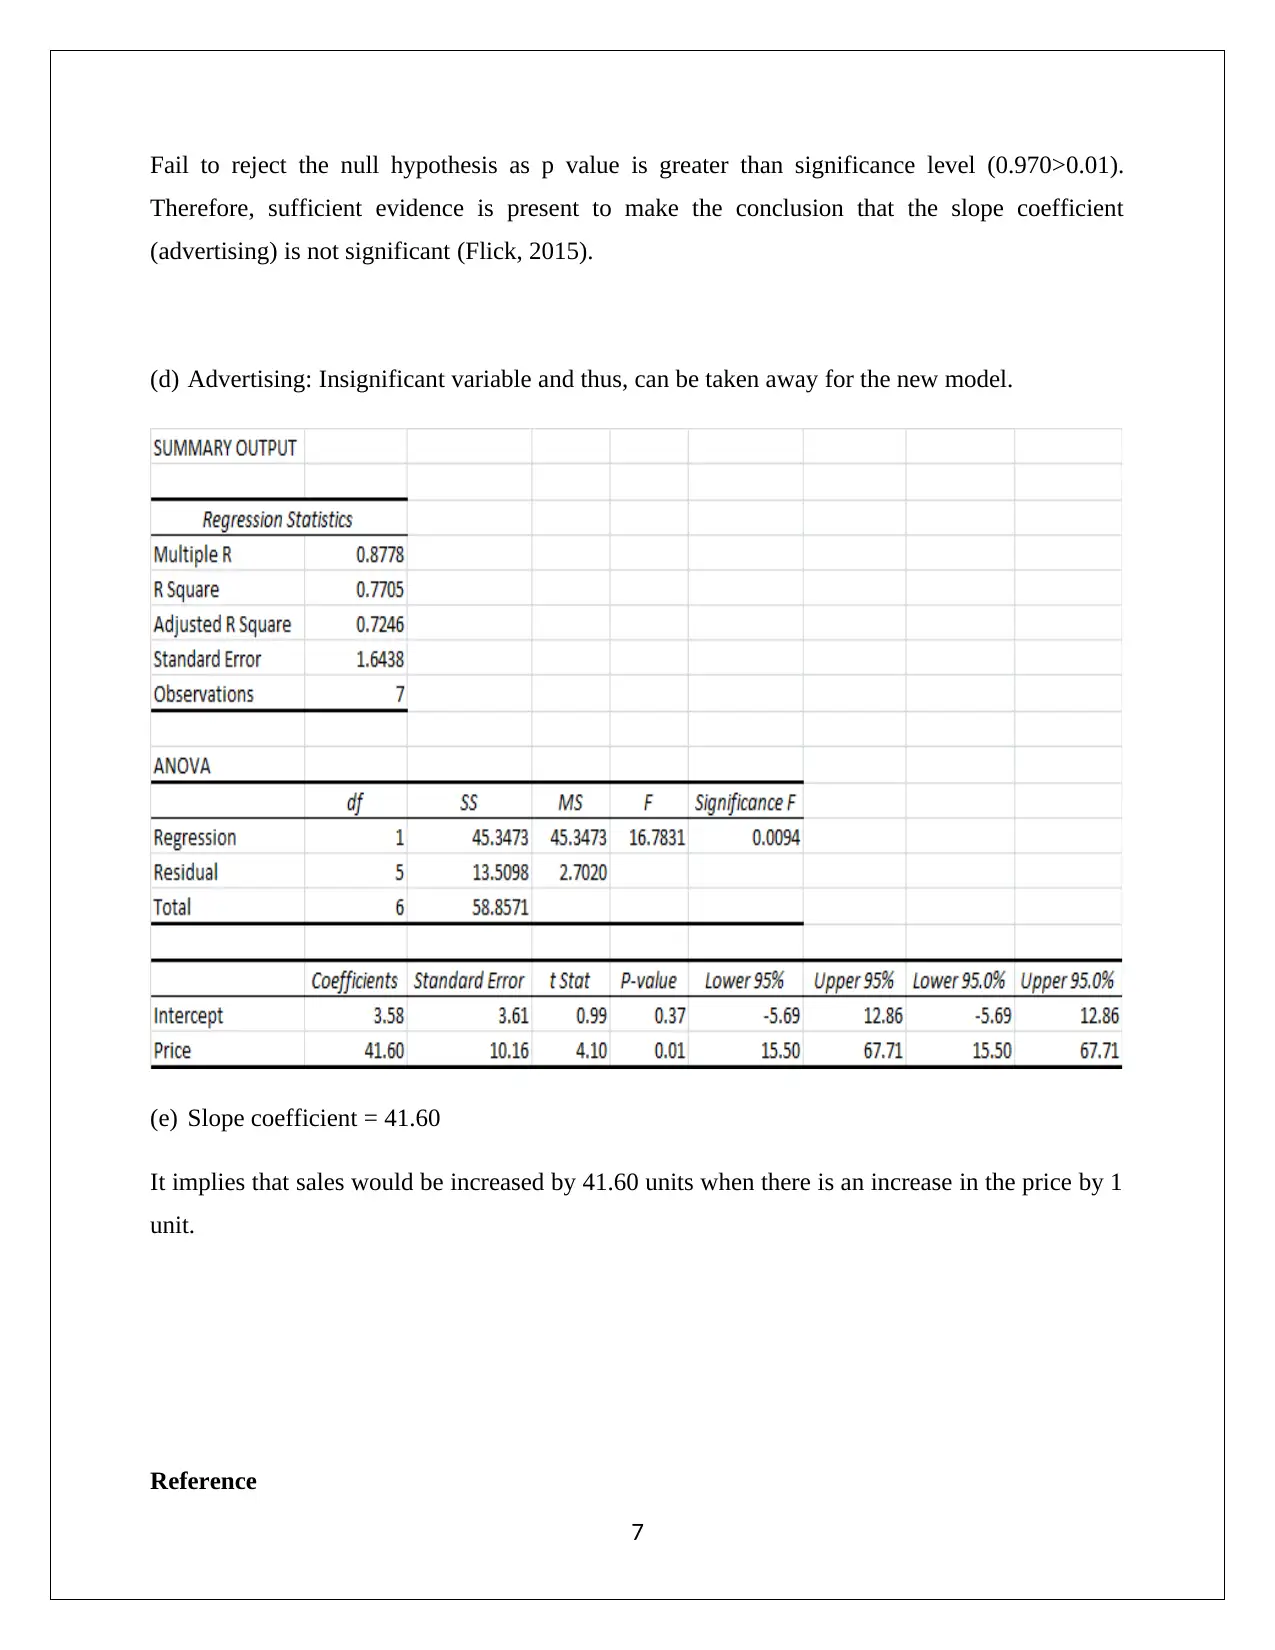
This document presents a complete solution to a statistics assignment for the HI6007 course. The solution includes detailed calculations and explanations for each question. Question 1 covers the construction and interpretation of frequency distributions, cumulative frequency distributions, relative frequency distributions, and histograms to analyze examination scores. Question 2 delves into regression analysis, interpreting ANOVA output, hypothesis testing for the relationship between supply and unit price, calculating the coefficient of determination and correlation coefficient, and predicting supply based on unit price. Question 3 involves ANOVA table construction and hypothesis testing to compare group means. Finally, Question 4 focuses on regression modeling, hypothesis testing for the significance of model parameters (price and advertising), and interpreting the slope coefficient. The assignment utilizes MS Excel for calculations and graphical presentations, referencing relevant statistical concepts and methodologies.

1 out of 9
Related Documents


Your All-in-One AI-Powered Toolkit for Academic Success.
+13062052269
info@desklib.com
Available 24*7 on WhatsApp / Email
![[object Object]](/_next/static/media/star-bottom.7253800d.svg)
Copyright © 2020–2026 A2Z Services. All Rights Reserved. Developed and managed by ZUCOL.