Solved: Statistics STAT-101 Assignment-2, Probability, SEU KSA
VerifiedAdded on 2023/06/03
|8
|959
|429
Homework Assignment
AI Summary
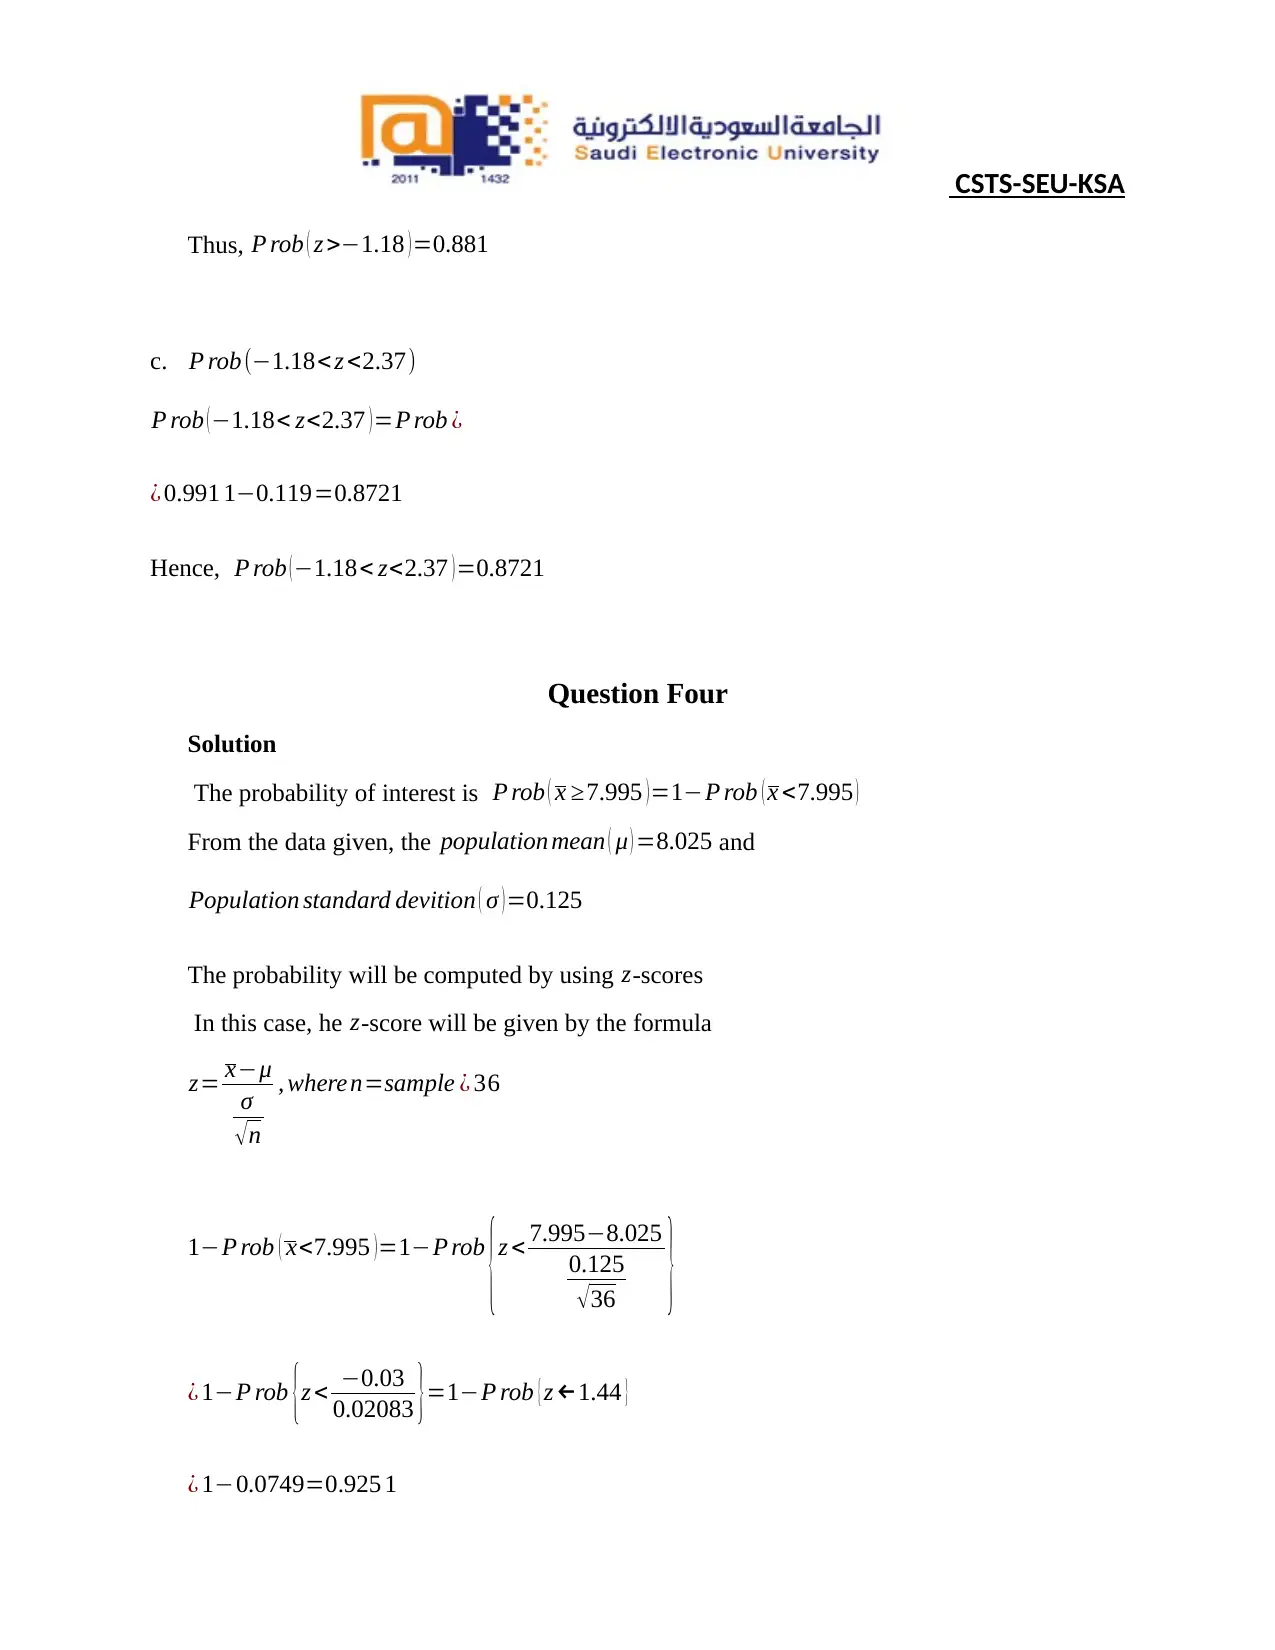
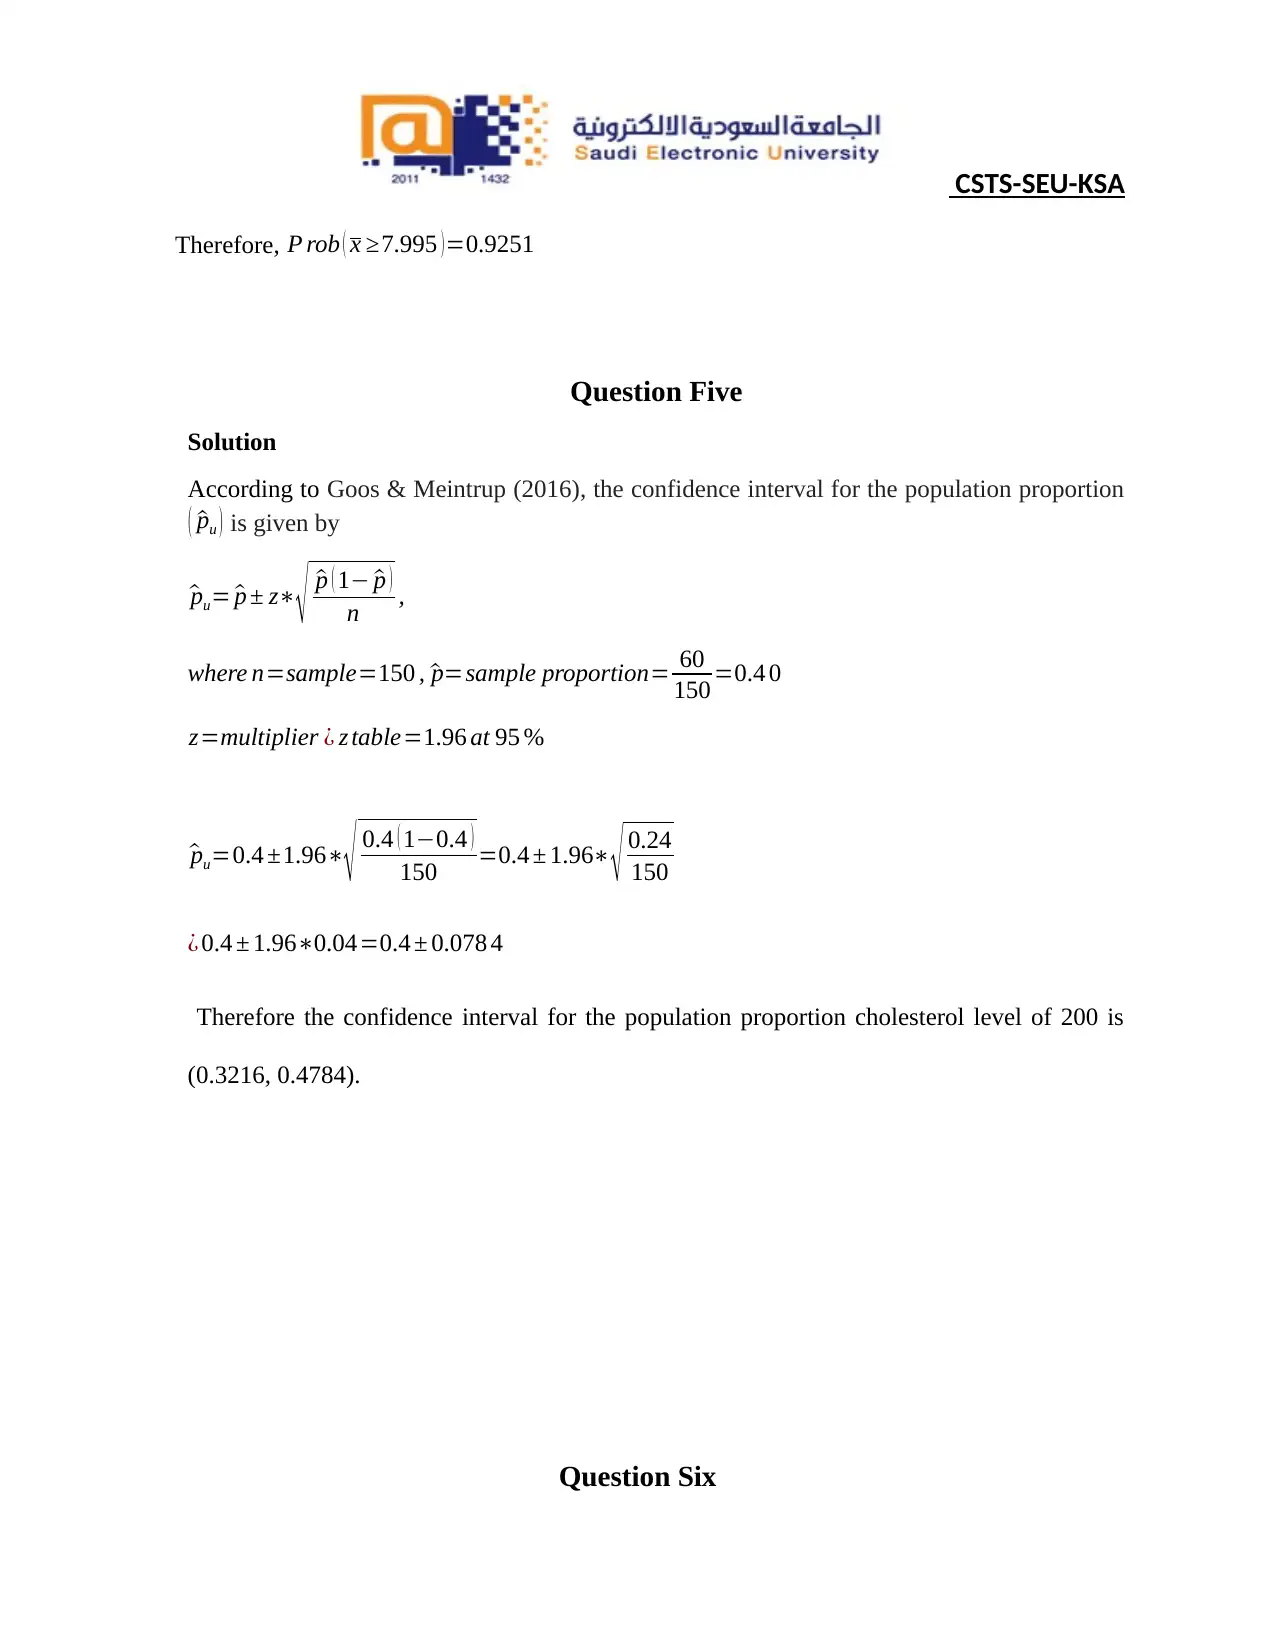
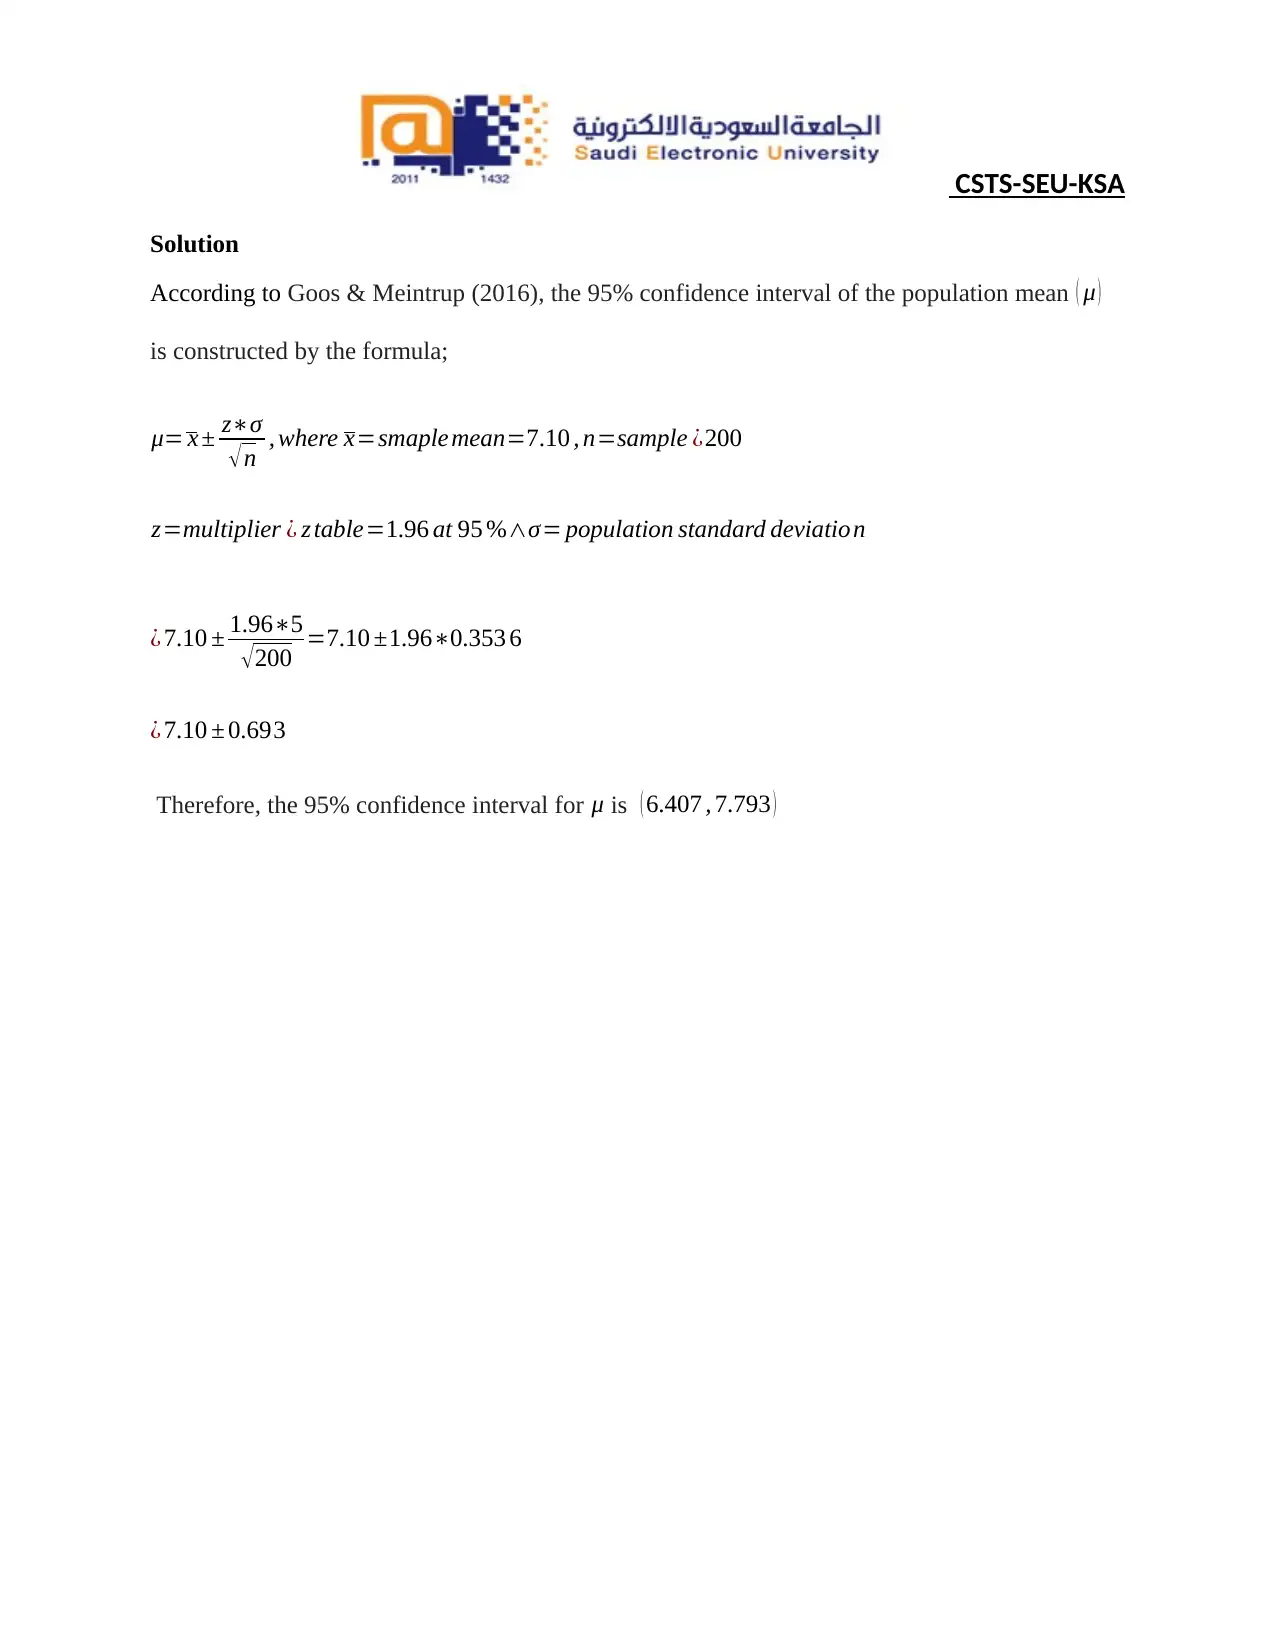
This assignment solution for Statistics (STAT-101) covers probability distributions, variance calculation, binomial distribution, normal distribution, and confidence intervals. It includes detailed solutions for six questions involving coin probabilities, part-time student probabilities, z-score calculations, cream cheese weight analysis, and population proportion and mean estimations. The solutions demonstrate the application of statistical formulas and concepts, providing a comprehensive guide for students studying statistics. Desklib offers more solved assignments and study resources for students.

CSTS-SEU-KSA
___________________________________________________________________
Statistics (STAT-101)
Assignment-2 (Weeks: 5-7)
1st Semester, 1439-1440 (2018-2019)
Due date: 20/10/2018 (Time: 10:30 PM)
Student’s Name
Student’s ID
Section/CRN
Location
Marking Scheme
Question Score Obtained Score
Q-1 3
Q-2 3
Q-3 3
Q-4 3
Q-5 3
Q-6 3
Total 18
Note: You are required to fill your full name, ID and CRN.
Solution to the Questions
Paraphrase This Document
Need a fresh take? Get an instant paraphrase of this document with our AI Paraphraser

CSTS-SEU-KSA
Question One
a. Probability distribution table for the random variable
Solution
Type of a Coin Frequency
f
Probability
p= f
∑ f
$ 1 2 0.22
$ 5 3 0.33
$ 10 1 0.11
$ 20 3 0.33
Total(∑) 9 1.00
b. Variance.
According to Hassett & Stewart (2006), the variance is given by the formula
Var ( x )=E ( x2 )−¿ ¿
¿ ∑ x2 ¿ px− ( ∑ x∗px )
2
The table below summarizes the result of the computation
Type of a Coin Frequency
f
x=coin $∗f Probability
px
x∗px x2∗px
$ 1 2 2 0.22 0.444 0.889
$ 5 3 15 0.33 5.000 75
$ 10 1 10 0.11 1.111 11.111
$ 20 3 60 0.33 20.000 1200
Total(∑) 9 1.00 26.556 1287

CSTS-SEU-KSA
Therefore,
¿ ∑ x2 ¿ px− ( ∑ x∗px )
2
=1287− ( 26.556 ) 2
¿ 1287−705.198=581.802 .
Therefore, the variance is $ 581.80
Question Two
Solution
The probability of interest isP rob ( x ≥3 )=1−P ( x <3 )
The distribution of the 5 students adopts binomial distribution with probability of
success ( p ) of an event been 0.13 and that of failed ( q ) event is 0.87. The number of
independent trials ( n ) is 5 and the number of success 3or more ( r )
According to Hassett & Stewart (2006), the probability of success in a binomial
distribution is given by
P rob ( x=r ) = [ n
r ] ( p ) r ( q ) n−r
Therefore,
P rob ( x ≥3 ) =1−P rob ( x<3 )
¿ 1− {P rob ( x=0 ) + P rob ( x=1 )+ P ( x=2 ) }
Therefore,
¿ ∑ x2 ¿ px− ( ∑ x∗px )
2
=1287− ( 26.556 ) 2
¿ 1287−705.198=581.802 .
Therefore, the variance is $ 581.80
Question Two
Solution
The probability of interest isP rob ( x ≥3 )=1−P ( x <3 )
The distribution of the 5 students adopts binomial distribution with probability of
success ( p ) of an event been 0.13 and that of failed ( q ) event is 0.87. The number of
independent trials ( n ) is 5 and the number of success 3or more ( r )
According to Hassett & Stewart (2006), the probability of success in a binomial
distribution is given by
P rob ( x=r ) = [ n
r ] ( p ) r ( q ) n−r
Therefore,
P rob ( x ≥3 ) =1−P rob ( x<3 )
¿ 1− {P rob ( x=0 ) + P rob ( x=1 )+ P ( x=2 ) }
⊘ This is a preview!⊘
Do you want full access?
Subscribe today to unlock all pages.

Trusted by 1+ million students worldwide

CSTS-SEU-KSA
P rob ( x=0 )= [5
0 ] ( 0.13 )0 ( 0.87 )5−0= ( 0.87 )5=0.498
P rob ( x=1 ) =
[ 5
1 ] ( 0.13 )1 ( 0.87 ) 5−1=5∗0.13∗( 0.87 ) 4=0.372
P rob ( x=2 ) =[ 5
2 ] ( 0.13 ) 2 ( 0.87 )5 −2 =5∗0.0169∗( 0.87 )3 =0.111
Thus,
1− { P rob ( x=0 ) + P rob ( x=1 ) + Prob ( x=2 ) } =1− {0.498+ 0.372+ 0.111 }
¿ 0.01 8
Hence, P rob ( x ≥3 )=0.018
Question Three
Solution
The answer will be obtained from the normal distribution tables
a. P rob( z< 2.37)
P rob ( z <2.37 )=0.991 1
b. P rob(z>−1.18)
P rob ( z >−1.18 )=1−P rob ( z <−1.18 )
¿ 1−0.119=0.881
Paraphrase This Document
Need a fresh take? Get an instant paraphrase of this document with our AI Paraphraser

CSTS-SEU-KSA
Thus, P rob ( z >−1.18 )=0.881
c. P rob(−1.18< z <2.37)
P rob (−1.18< z<2.37 )=P rob ¿
¿ 0.991 1−0.119=0.8721
Hence, P rob (−1.18< z<2.37 )=0.8721
Question Four
Solution
The probability of interest is P rob ( x ≥7.995 )=1−P rob ( x <7.995 )
From the data given, the population mean ( μ ) =8.025 and
Population standard devition ( σ )=0.125
The probability will be computed by using z-scores
In this case, he z-score will be given by the formula
z= x−μ
σ
√ n
, where n=sample ¿ 36
1−P rob ( x<7.995 ) =1−P rob
{z < 7.995−8.025
0.125
√ 36 }
¿ 1−P rob {z < −0.03
0.02083 }=1−P rob { z ←1.44 }
¿ 1−0.0749=0.925 1

CSTS-SEU-KSA
Therefore, P rob ( x ≥7.995 )=0.9251
Question Five
Solution
According to Goos & Meintrup (2016), the confidence interval for the population proportion
( ^pu ) is given by
^pu= ^p ± z∗
√ ^p ( 1− ^p )
n ,
where n=sample=150 , ^p=sample proportion= 60
150 =0.4 0
z=multiplier ¿ z table=1.96 at 95 %
^pu=0.4 ±1.96∗
√ 0.4 ( 1−0.4 )
150 =0.4 ± 1.96∗ √ 0.24
150
¿ 0.4 ± 1.96∗0.04=0.4 ± 0.078 4
Therefore the confidence interval for the population proportion cholesterol level of 200 is
(0.3216, 0.4784).
Question Six
⊘ This is a preview!⊘
Do you want full access?
Subscribe today to unlock all pages.

Trusted by 1+ million students worldwide

CSTS-SEU-KSA
Solution
According to Goos & Meintrup (2016), the 95% confidence interval of the population mean ( μ )
is constructed by the formula;
μ= x ± z∗σ
√n , where x=smaple mean=7.10 , n=sample ¿200
z=multiplier ¿ z table=1.96 at 95 %∧σ= population standard deviation
¿ 7.10 ± 1.96∗5
√200 =7.10 ±1.96∗0.353 6
¿ 7.10 ± 0.693
Therefore, the 95% confidence interval for μ is ( 6.407 , 7.793 )
Paraphrase This Document
Need a fresh take? Get an instant paraphrase of this document with our AI Paraphraser

CSTS-SEU-KSA
Reference
Goos, P., & Meintrup, D. (2016). Statistics with JMP: Hypothesis Tests, ANOVA and
Regression. John Wiley & Sons.
Hassett, M. J., & Stewart, D. (2006). Probability for risk management. Actex Publications.
Reference
Goos, P., & Meintrup, D. (2016). Statistics with JMP: Hypothesis Tests, ANOVA and
Regression. John Wiley & Sons.
Hassett, M. J., & Stewart, D. (2006). Probability for risk management. Actex Publications.
1 out of 8

Your All-in-One AI-Powered Toolkit for Academic Success.
+13062052269
info@desklib.com
Available 24*7 on WhatsApp / Email
Unlock your academic potential
© 2024 | Zucol Services PVT LTD | All rights reserved.