Statistics Assignment: UK and US Economic Data Analysis
VerifiedAdded on 2020/04/15
|11
|2228
|65
Homework Assignment
AI Summary
This statistics assignment delves into the analysis of economic data from the UK and US, employing various statistical concepts. The assignment explores the differences between stock and flow data, nominal and real measures, and differential indices. It examines wage rate indices, share price indices, and their ratios to understand economic trends and inequality. The analysis includes calculating real GDP growth rates, exploring the impacts of neo-liberalism, and comparing the financial performance of Microsoft and Apple, focusing on net income, sales revenue, and markup ratios. The assignment uses tables and graphs to illustrate the data and draws conclusions about economic policies and their effects on various sectors and populations. The assignment covers topics such as the global financial crisis and the distributional effects of foreign capital flows.
qwertyuiopasdfghjklzxcvbnmqwertyui
opasdfghjklzxcvbnmqwertyuiopasdfgh
jklzxcvbnmqwertyuiopasdfghjklzxcvb
nmqwertyuiopasdfghjklzxcvbnmqwer
tyuiopasdfghjklzxcvbnmqwertyuiopas
dfghjklzxcvbnmqwertyuiopasdfghjklzx
cvbnmqwertyuiopasdfghjklzxcvbnmq
wertyuiopasdfghjklzxcvbnmqwertyuio
pasdfghjklzxcvbnmqwertyuiopasdfghj
klzxcvbnmqwertyuiopasdfghjklzxcvbn
mqwertyuiopasdfghjklzxcvbnmqwerty
uiopasdfghjklzxcvbnmqwertyuiopasdf
ghjklzxcvbnmqwertyuiopasdfghjklzxc
vbnmqwertyuiopasdfghjklzxcvbnmrty
uiopasdfghjklzxcvbnmqwertyuiopasdf
ghjklzxcvbnmqwertyuiopasdfghjklzxc
Statistics
[Type the document subtitle]
[Pick the date]
ABC
Paraphrase This Document
Need a fresh take? Get an instant paraphrase of this document with our AI Paraphraser
Contents
Question 1...................................................................................................................................................3
Question 2...................................................................................................................................................3
Question 3...................................................................................................................................................6
Question 4...................................................................................................................................................8
References.................................................................................................................................................11
Table 1 The Percentage Growth Rate of GDP (in Million Pound, Current Prices)........................................5
Table 3 Microsoft - Net Income, Sales Revenues, Mark Up Ratio................................................................7
Table 4 Apple Net Income, Sales Revenue,, Mark Up Ratio.........................................................................9
Graph 1 Wage Rate Index and Share Price Index........................................................................................3
Graph 2 Ratio of Wage Rate Index and Share PRice Index for UK Since 1960.............................................5
Graph 3 Maicro Soft Mark Up Ration; Net Income and Sales Revenues......................................................9
Graph 4 Apple Ince: Net Income, Sales Revenue and Markup Ratio........................................................10
Question 1
‘ Stock Data’ provides information a given point in time. In the given example, the real wage index of
United States in the year 1989 would be an example of stock data
Flow data proved information for a given interval in time. Changes in Wage Rate between the year 1989
and 1990 are an example. (Trochim, 2006)
As the words suggest, “stock Data” measures the stock, while “flow Data” measures the flow.
A differential Index measures the proportionate change i.e the index simply calculates the ration of two
variables . It simply compares the changes in one variable from a given point as a base up to a point as
compared to the changes in another variable during the same period , given the same starting point as a
base value. A real index rate calculates the intrinsic shift in the values of a given variable. (Trochim,
2006)
The data above compares the “Real Total Returns Index” i.e. the return on investment in stocks for S&P
5oo companies. The worker’s hourly wage rate has not increased in the same proportion as the
investment in stocks. i.e companies performed well in the United States (i.e large companies , as given in
the graph) but that did not translate into higher real wages increase for workers in the same proportion.
This graph can be used to explain inequality in the United States of America. Additionally, the S&P 500
may contain stocks from all sectors of the economy such as information technology, Real Estate etc
while the given hourly wage rate only symbolizes the hourly wage rate of workers in manufacturing. It
may be possible that the manufacturing sector underperformed as compared to the rest of the
economy.
Question 2
1) ‘Nominal’ measures are measures that capture data in their observed states i.e as measured.
For example Nominal GDP incomes GDP as an aggregate of all the dollar value of the goods and
services produced in the country. Real measures are measures that have been adjusted to
discount for the impact of inflating factors like inflation etc.
Real values are calculated to understand the intrinsic changes and discount for exogenous,
unrelated factors. (Trochim, 2006)
The Country taken here is United Kingdom. For UK, Wage Rates have increased continually in trend with
the returns on the stock exchange. (Real GDP rates were not available. Hence, the Index of Seasonally
Adjusted Rates have been taken to avoid the influence of inflating factors). This implies, that workers
⊘ This is a preview!⊘
Do you want full access?
Subscribe today to unlock all pages.
Trusted by 1+ million students worldwide
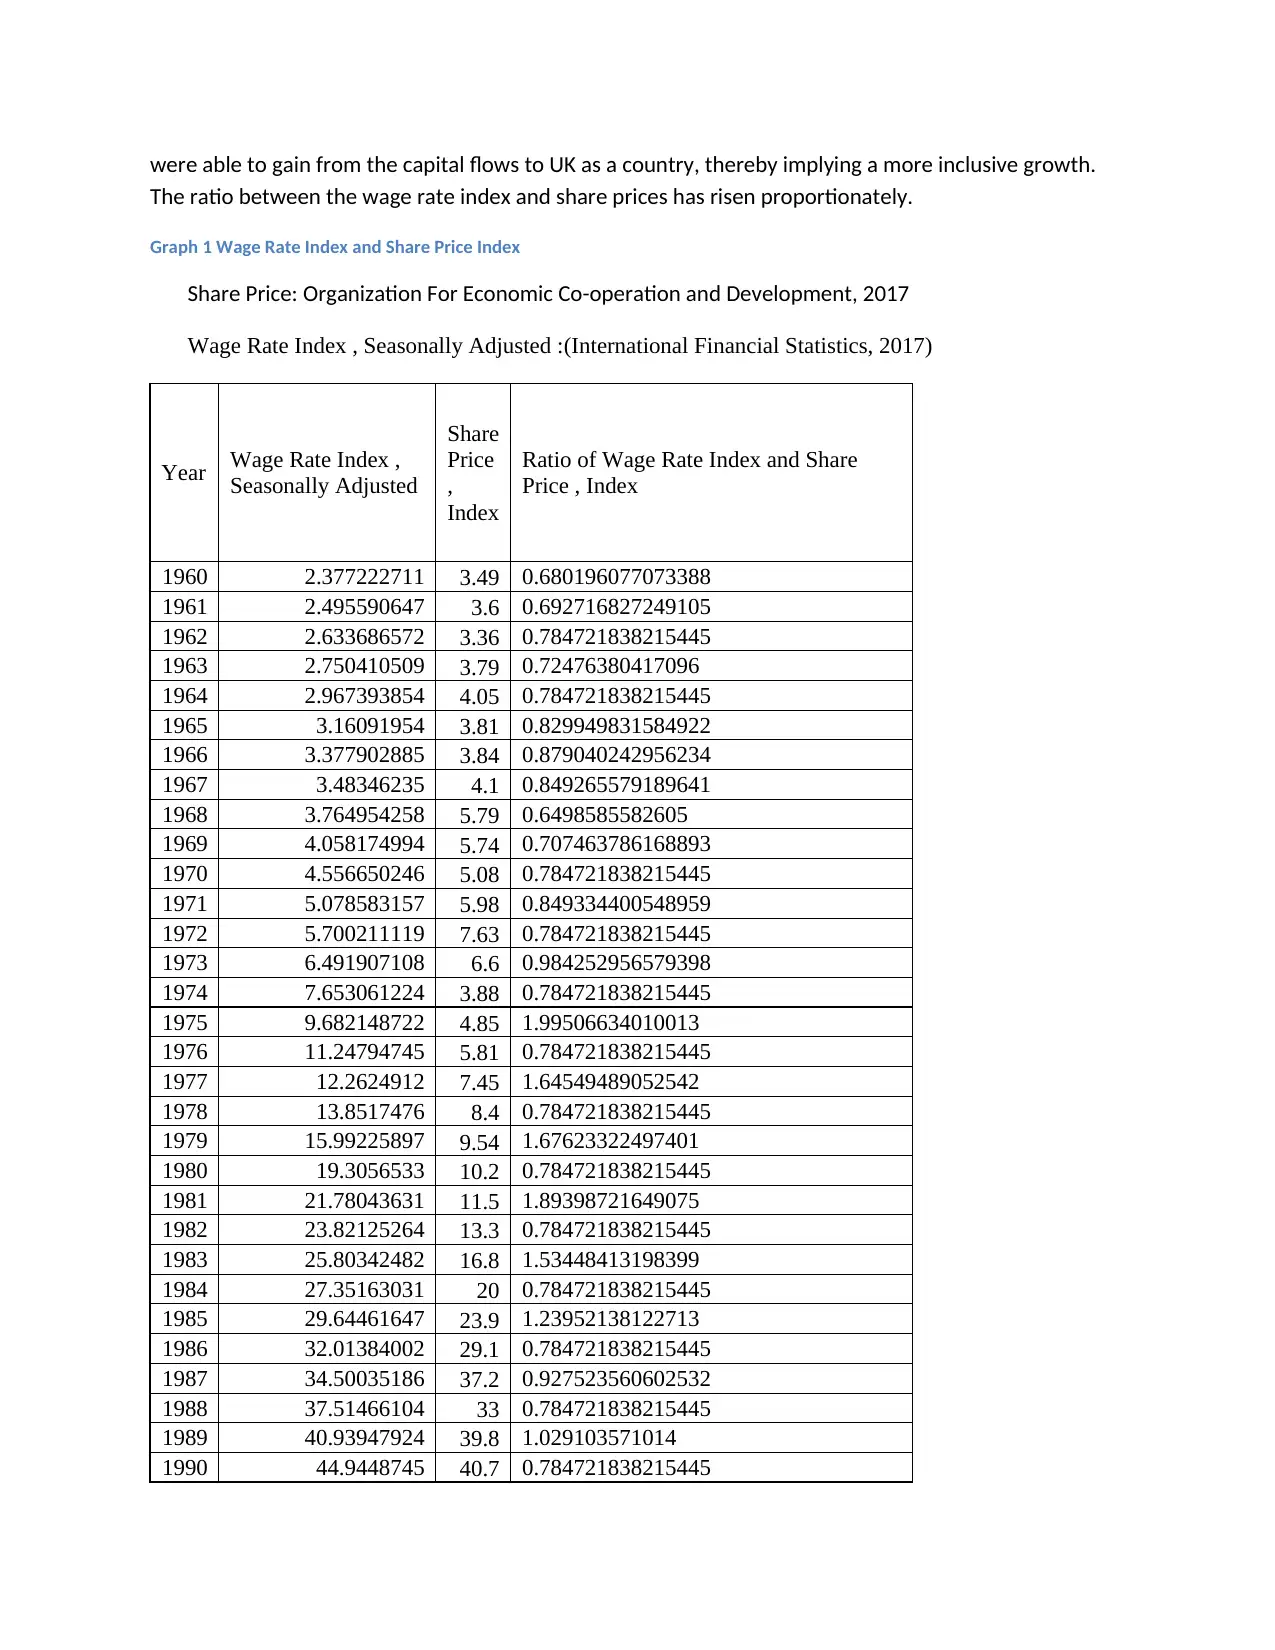
were able to gain from the capital flows to UK as a country, thereby implying a more inclusive growth.
The ratio between the wage rate index and share prices has risen proportionately.
Graph 1 Wage Rate Index and Share Price Index
Share Price: Organization For Economic Co-operation and Development, 2017
Wage Rate Index , Seasonally Adjusted :(International Financial Statistics, 2017)
Year Wage Rate Index ,
Seasonally Adjusted
Share
Price
,
Index
Ratio of Wage Rate Index and Share
Price , Index
1960 2.377222711 3.49 0.680196077073388
1961 2.495590647 3.6 0.692716827249105
1962 2.633686572 3.36 0.784721838215445
1963 2.750410509 3.79 0.72476380417096
1964 2.967393854 4.05 0.784721838215445
1965 3.16091954 3.81 0.829949831584922
1966 3.377902885 3.84 0.879040242956234
1967 3.48346235 4.1 0.849265579189641
1968 3.764954258 5.79 0.6498585582605
1969 4.058174994 5.74 0.707463786168893
1970 4.556650246 5.08 0.784721838215445
1971 5.078583157 5.98 0.849334400548959
1972 5.700211119 7.63 0.784721838215445
1973 6.491907108 6.6 0.984252956579398
1974 7.653061224 3.88 0.784721838215445
1975 9.682148722 4.85 1.99506634010013
1976 11.24794745 5.81 0.784721838215445
1977 12.2624912 7.45 1.64549489052542
1978 13.8517476 8.4 0.784721838215445
1979 15.99225897 9.54 1.67623322497401
1980 19.3056533 10.2 0.784721838215445
1981 21.78043631 11.5 1.89398721649075
1982 23.82125264 13.3 0.784721838215445
1983 25.80342482 16.8 1.53448413198399
1984 27.35163031 20 0.784721838215445
1985 29.64461647 23.9 1.23952138122713
1986 32.01384002 29.1 0.784721838215445
1987 34.50035186 37.2 0.927523560602532
1988 37.51466104 33 0.784721838215445
1989 40.93947924 39.8 1.029103571014
1990 44.9448745 40.7 0.784721838215445
Paraphrase This Document
Need a fresh take? Get an instant paraphrase of this document with our AI Paraphraser
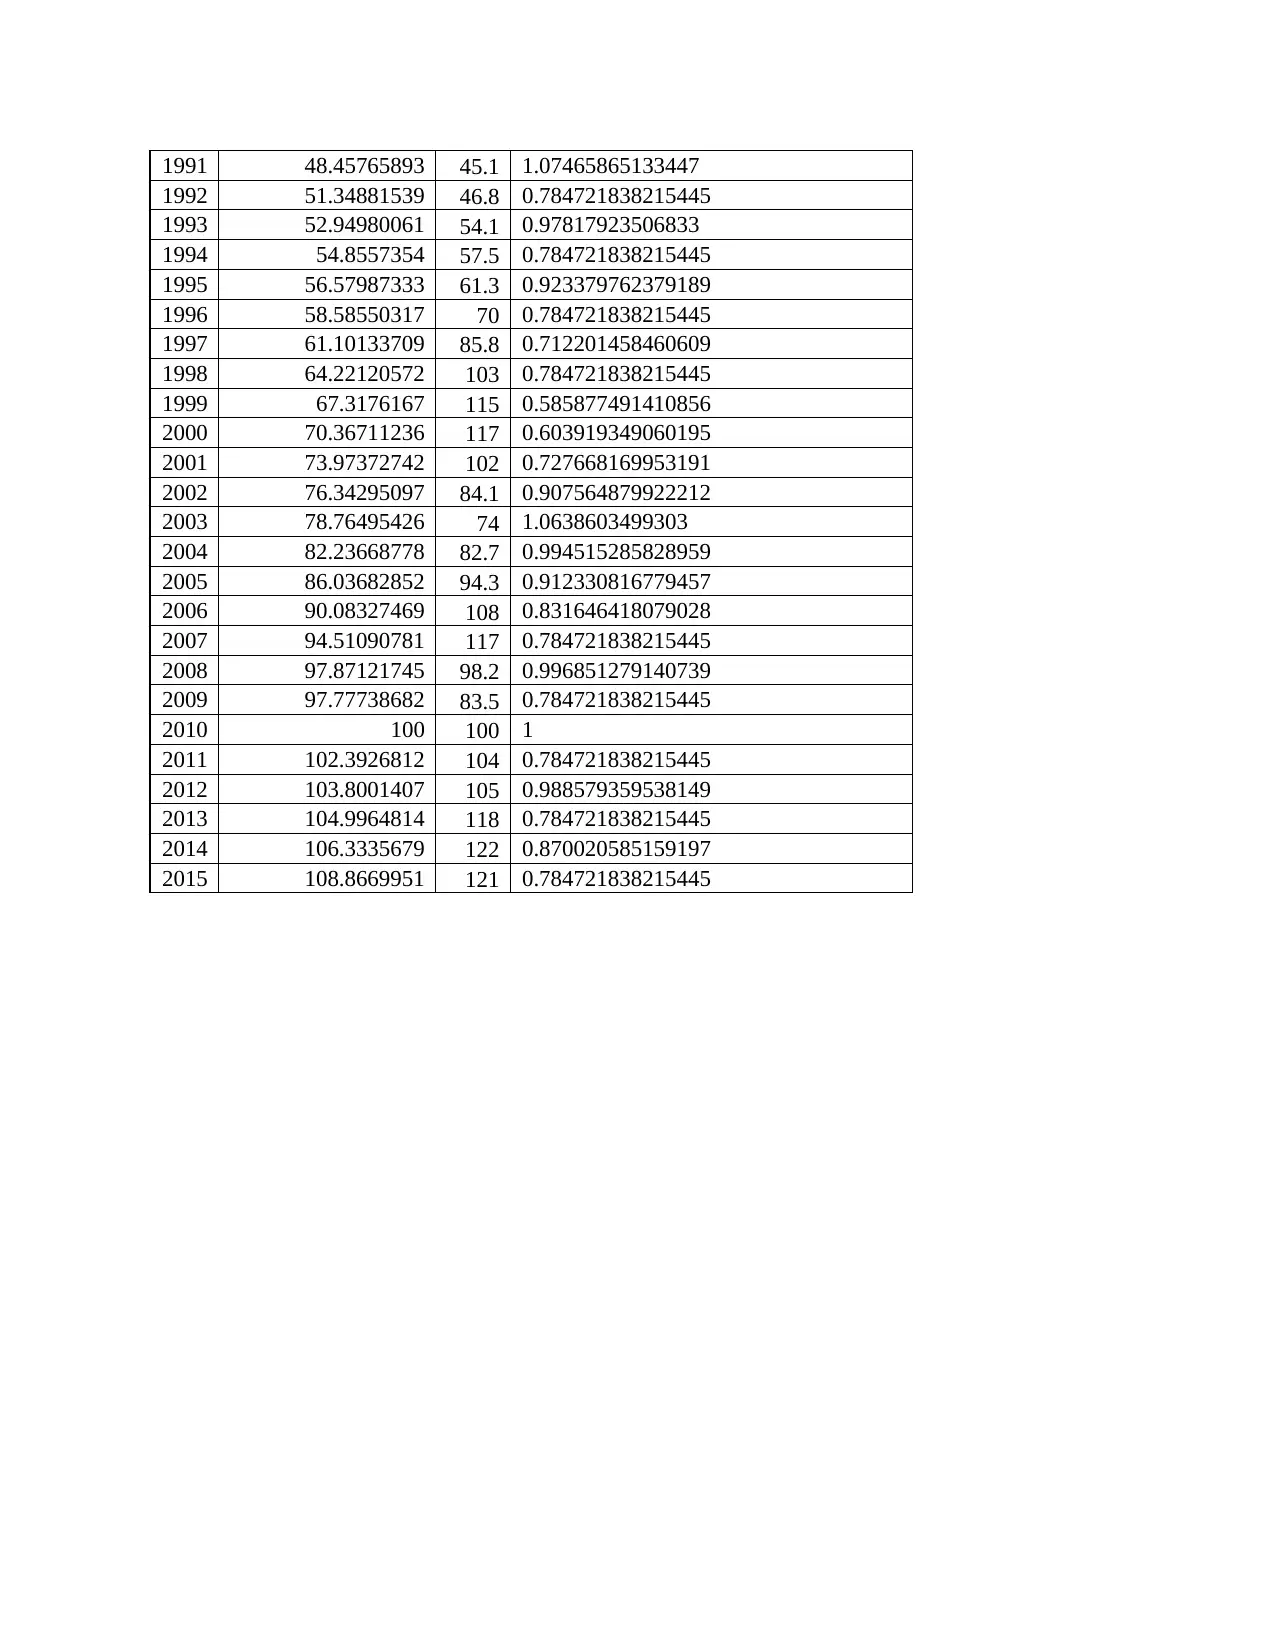
1991 48.45765893 45.1 1.07465865133447
1992 51.34881539 46.8 0.784721838215445
1993 52.94980061 54.1 0.97817923506833
1994 54.8557354 57.5 0.784721838215445
1995 56.57987333 61.3 0.923379762379189
1996 58.58550317 70 0.784721838215445
1997 61.10133709 85.8 0.712201458460609
1998 64.22120572 103 0.784721838215445
1999 67.3176167 115 0.585877491410856
2000 70.36711236 117 0.603919349060195
2001 73.97372742 102 0.727668169953191
2002 76.34295097 84.1 0.907564879922212
2003 78.76495426 74 1.0638603499303
2004 82.23668778 82.7 0.994515285828959
2005 86.03682852 94.3 0.912330816779457
2006 90.08327469 108 0.831646418079028
2007 94.51090781 117 0.784721838215445
2008 97.87121745 98.2 0.996851279140739
2009 97.77738682 83.5 0.784721838215445
2010 100 100 1
2011 102.3926812 104 0.784721838215445
2012 103.8001407 105 0.988579359538149
2013 104.9964814 118 0.784721838215445
2014 106.3335679 122 0.870020585159197
2015 108.8669951 121 0.784721838215445
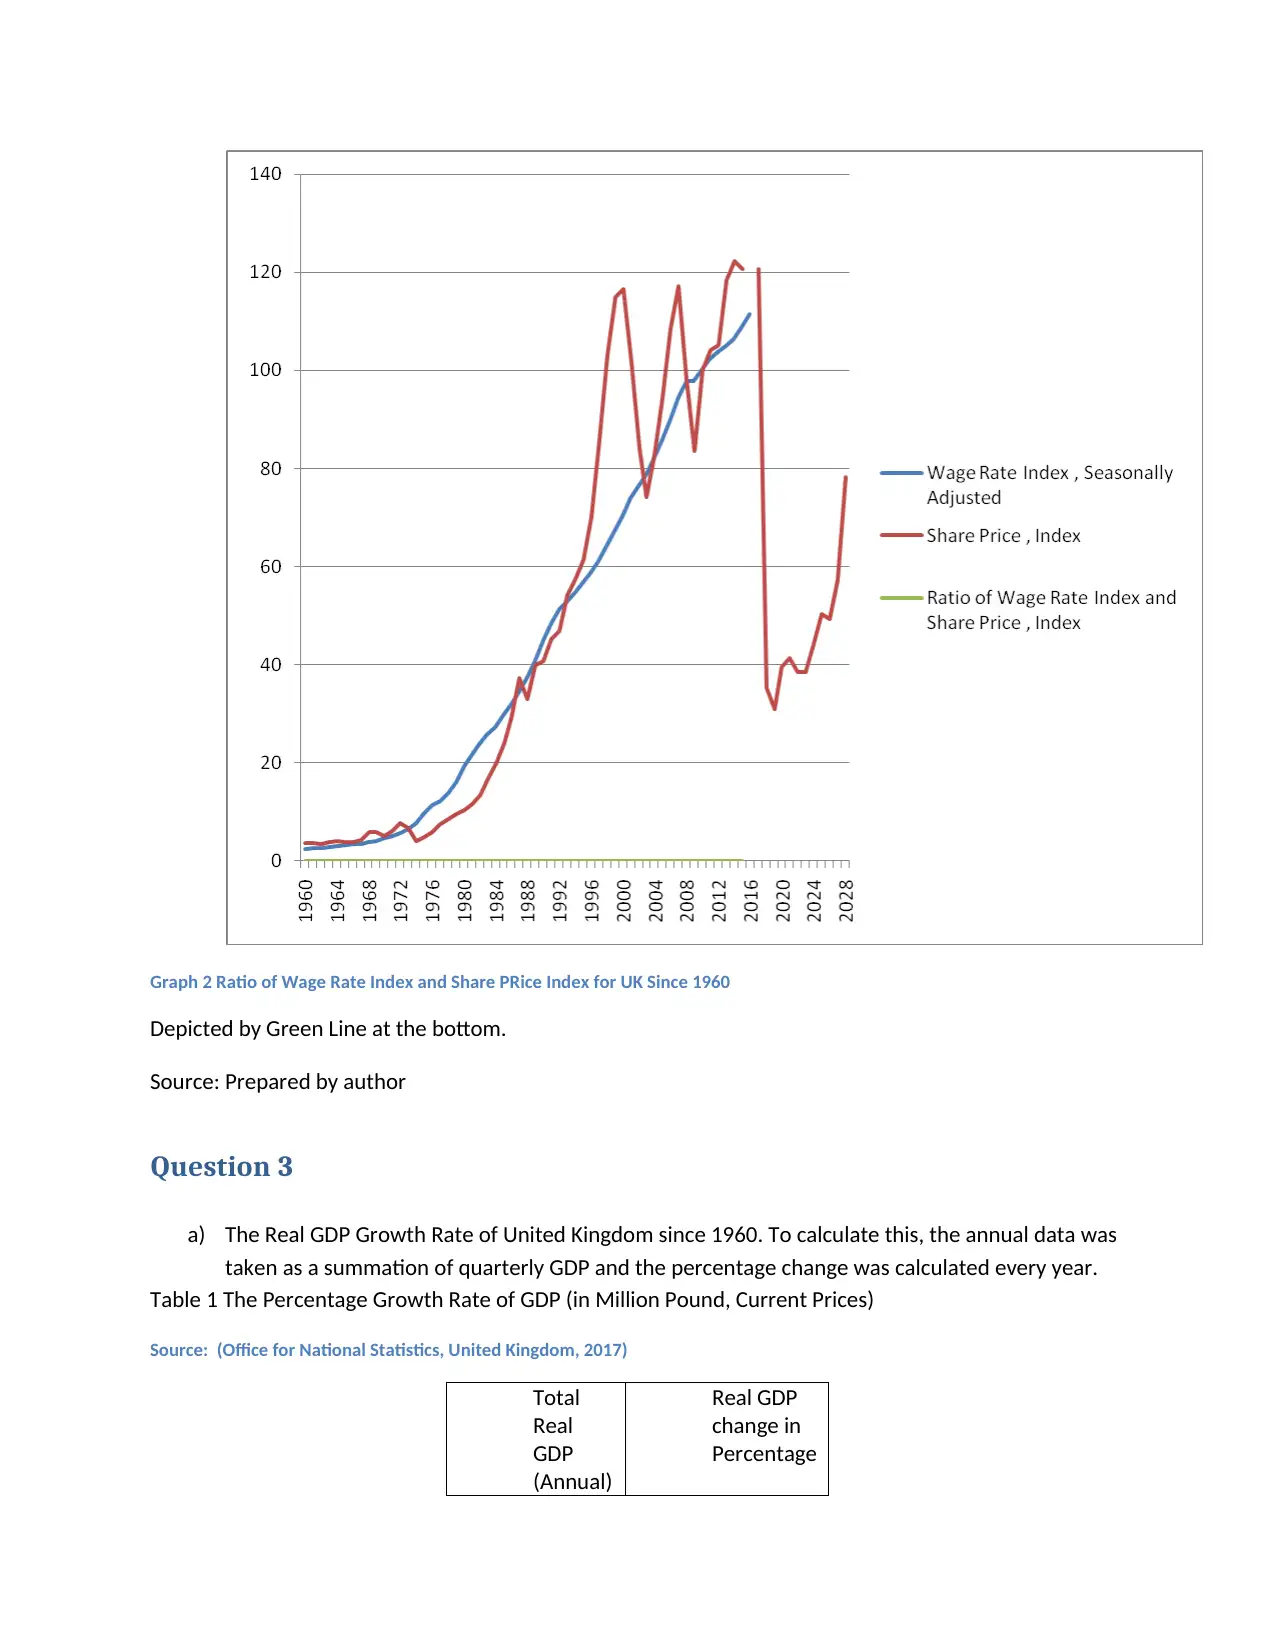
Graph 2 Ratio of Wage Rate Index and Share PRice Index for UK Since 1960
Depicted by Green Line at the bottom.
Source: Prepared by author
Question 3
a) The Real GDP Growth Rate of United Kingdom since 1960. To calculate this, the annual data was
taken as a summation of quarterly GDP and the percentage change was calculated every year.
Table 1 The Percentage Growth Rate of GDP (in Million Pound, Current Prices)
Source: (Office for National Statistics, United Kingdom, 2017)
Total
Real
GDP
(Annual)
Real GDP
change in
Percentage
⊘ This is a preview!⊘
Do you want full access?
Subscribe today to unlock all pages.
Trusted by 1+ million students worldwide
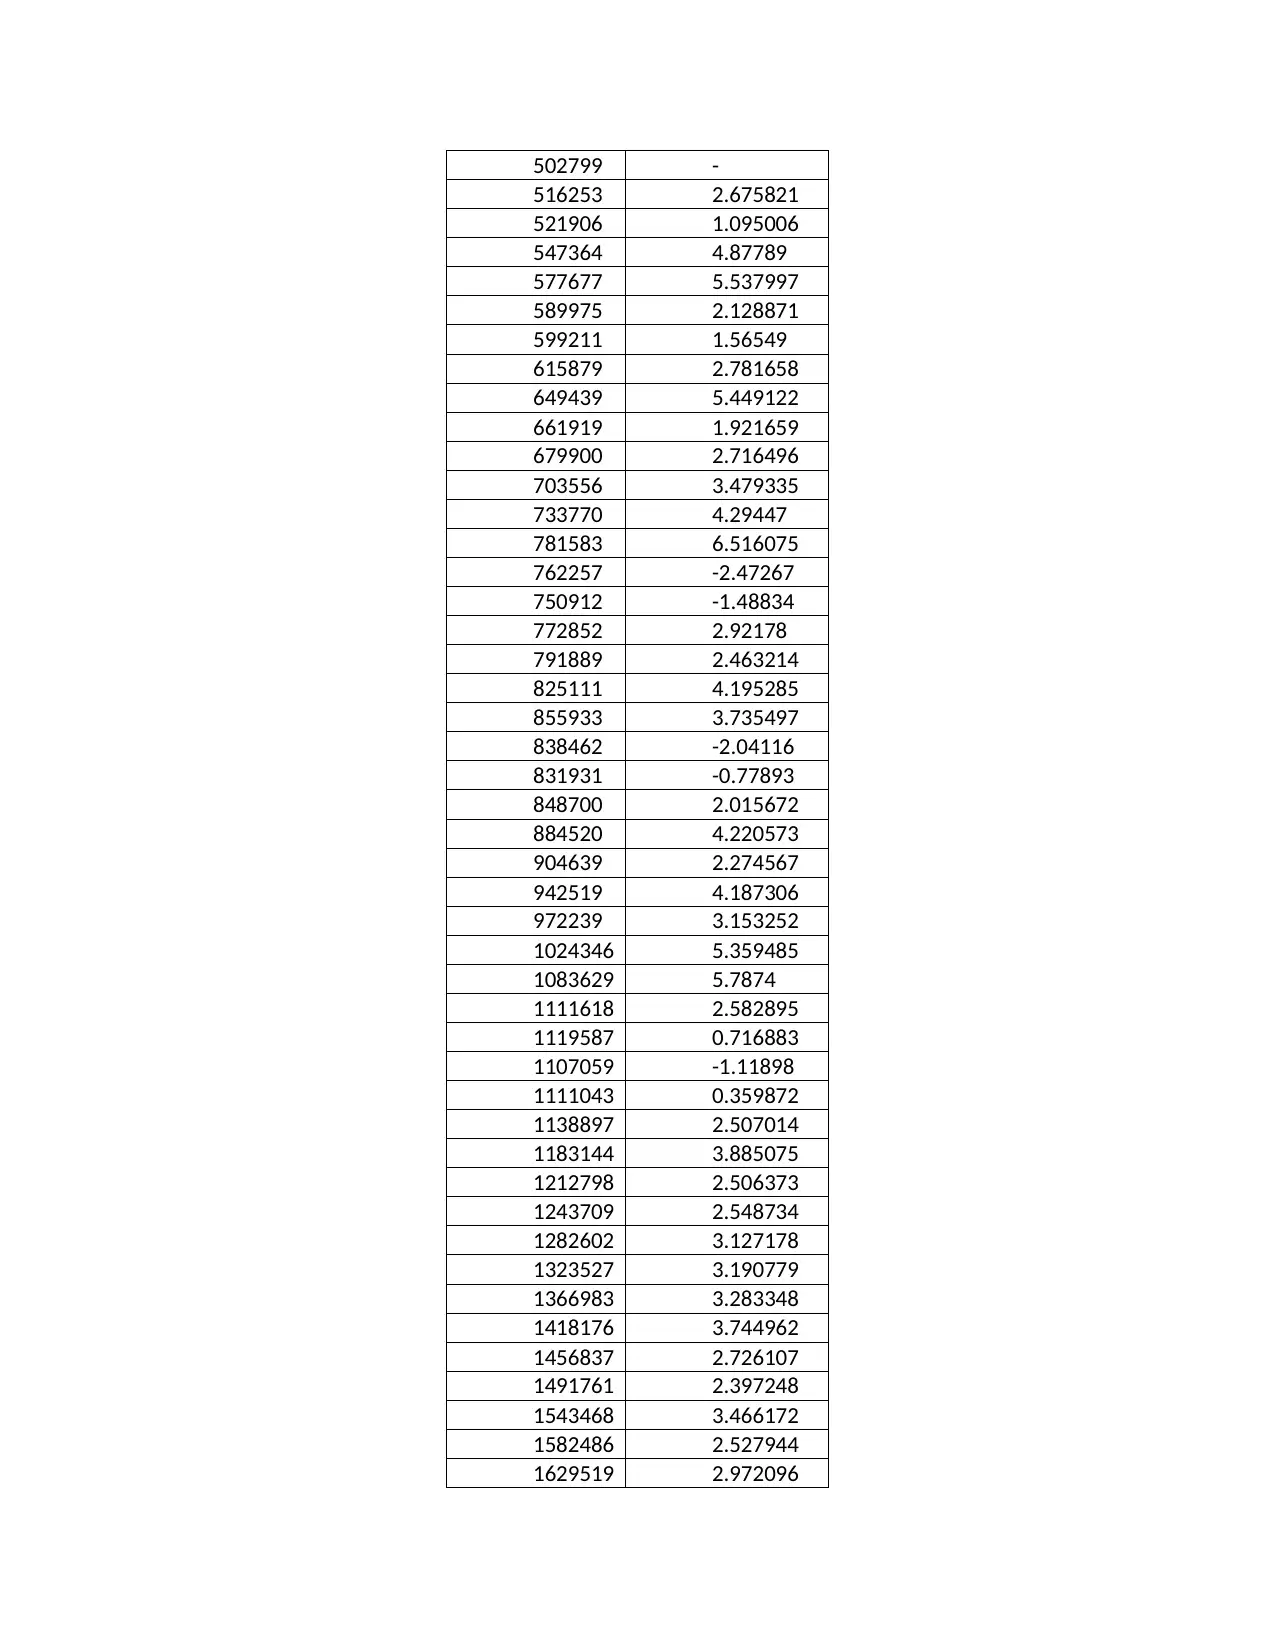
502799 -
516253 2.675821
521906 1.095006
547364 4.87789
577677 5.537997
589975 2.128871
599211 1.56549
615879 2.781658
649439 5.449122
661919 1.921659
679900 2.716496
703556 3.479335
733770 4.29447
781583 6.516075
762257 -2.47267
750912 -1.48834
772852 2.92178
791889 2.463214
825111 4.195285
855933 3.735497
838462 -2.04116
831931 -0.77893
848700 2.015672
884520 4.220573
904639 2.274567
942519 4.187306
972239 3.153252
1024346 5.359485
1083629 5.7874
1111618 2.582895
1119587 0.716883
1107059 -1.11898
1111043 0.359872
1138897 2.507014
1183144 3.885075
1212798 2.506373
1243709 2.548734
1282602 3.127178
1323527 3.190779
1366983 3.283348
1418176 3.744962
1456837 2.726107
1491761 2.397248
1543468 3.466172
1582486 2.527944
1629519 2.972096
Paraphrase This Document
Need a fresh take? Get an instant paraphrase of this document with our AI Paraphraser
1670306 2.503009
1712996 2.555819
1702252 -0.62721
1628583 -4.32774
1659772 1.9151
1684820 1.509123
1724569 2.359243
1739563 0.869435
1792976 3.070484
1832318 2.194229
1865410 1.806018
In the table above the Annual GDP was contained as a summation of Quarterly GDP in the given
year. The Change in GDP (Current GDP - Previous GDP) is obtained as a percentage.
b) There are primarily two distinct ideas that symbolize Neo Liberalism – greater competition and Less
Government regulation. (Ostry, Lungani, & Furceri, 2016) (Venugopal, 2015)
Neo Liberalism has often been criticized as being exploitative of the majority. (Ostry, Lungani, & Furceri,
2016) (Centeno & Cohen, 2012)
One of the biggest arguments that has been used against neo –liberlism in the recent times is the Global
Financial Crisis. This can be seen is the drop in GDP given in the above table. The lack of regulation led
to an economic collapse in the United States. This contagion spread further in the UK due to the
openness of financial markets in the UK. Some have even questioned the need for such open ness such
as the need for short term foreign capital flows. Short Term Foreign Capital comes into the country only
when the markets are set for a surge and leave the country at the slightest hint of a risk , creating
greater instability. The distributional effect of foreign flows has been questioned capital flows into
larger companies or foreign investments by large companies raised real wages proportionately. (Ostry,
Lungani, & Furceri, 2016) (Blanton and Peksen).Some believe that Neo Liberal policies have merely
increased inequality by helping only those who are already rich. (Ostry, Lungani, & Furceri, 2016)
(Centeno & Cohen, 2012)
Question 4
For both Apple , both net income that increases with sales revenue. This implies that the mark up ratio
has been maintained, implying operational efficiency. However, the net income of Microsoft has fallen in
many places, despite an large increase in sales. The mark up has remained more or less flat (as
symbolised by the green line in the graph below. The reason for lower income may not be sales but poor
investment decisions and operational inefficiency.
Table 2 Microsoft - Net Income, Sales Revenues, Mark Up Ratio
(Microsoft Corporation)
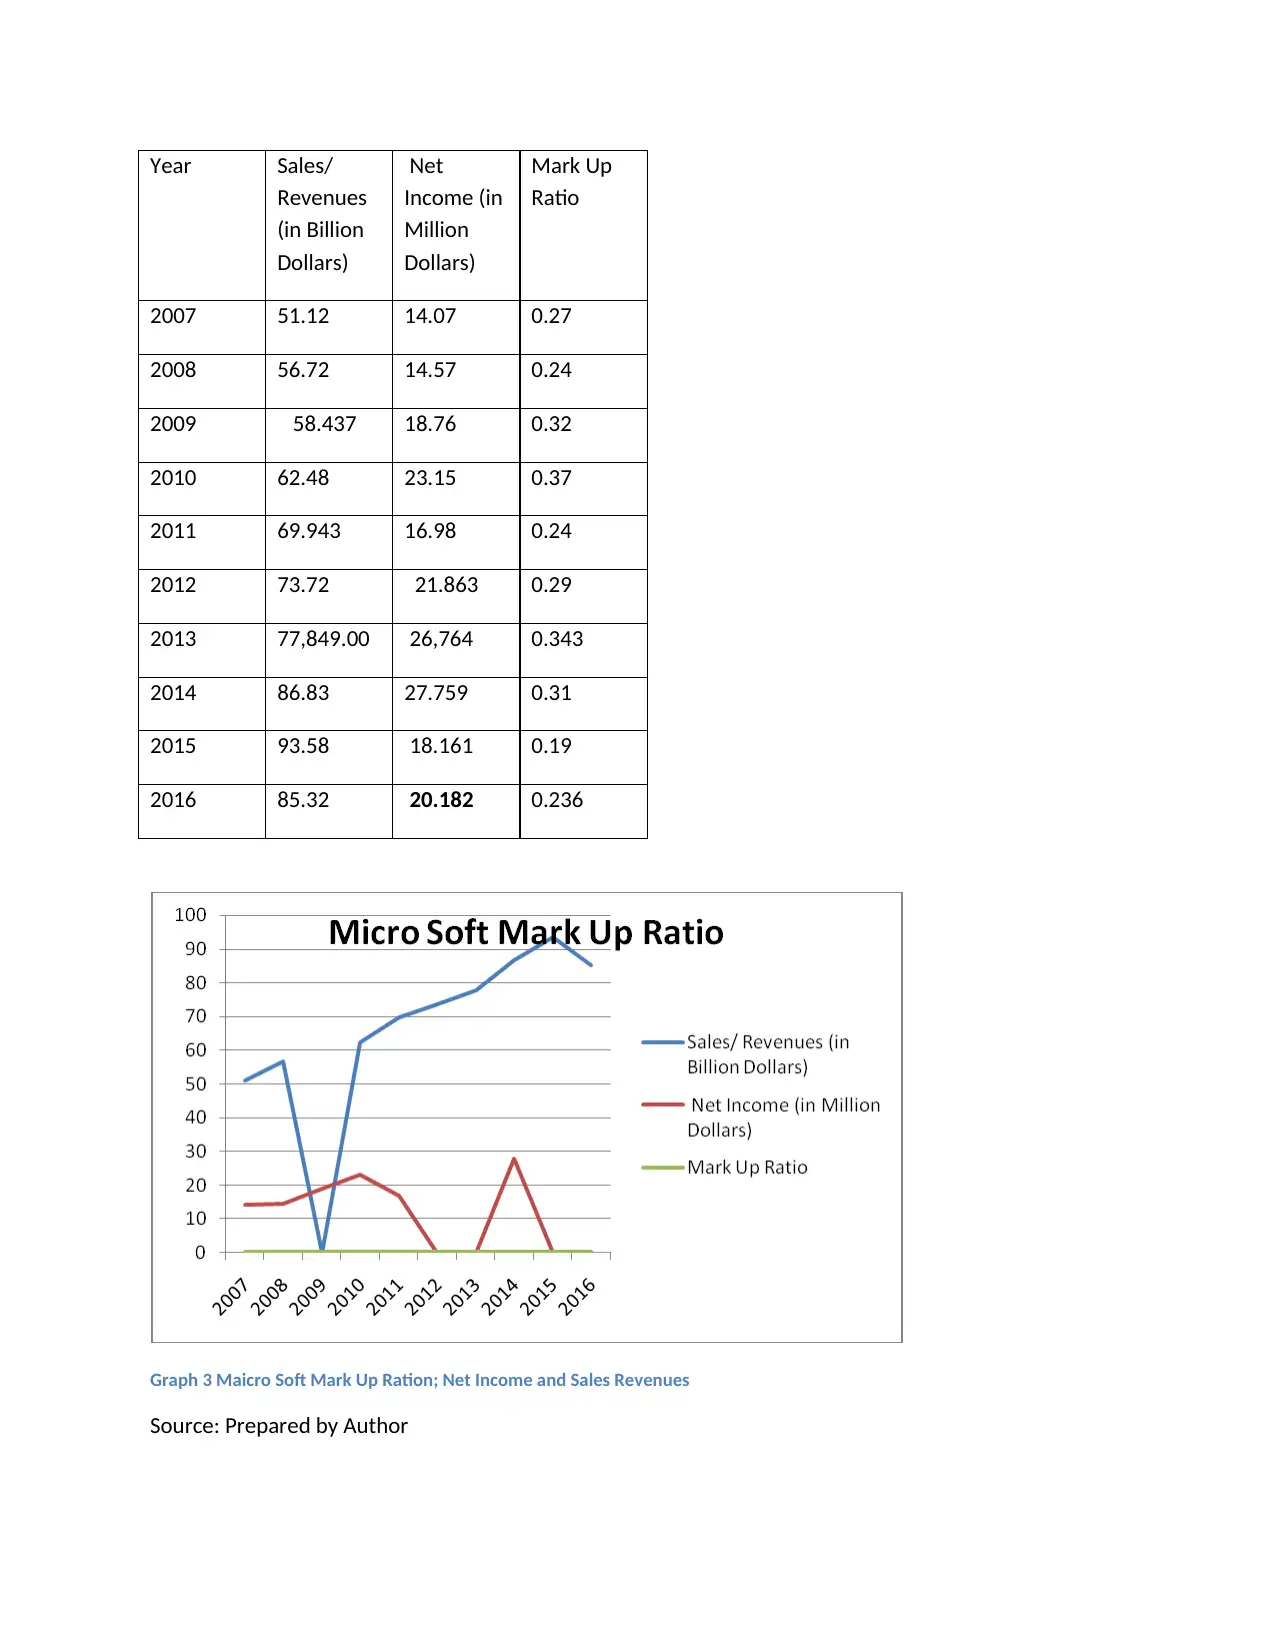
Year Sales/
Revenues
(in Billion
Dollars)
Net
Income (in
Million
Dollars)
Mark Up
Ratio
2007 51.12 14.07 0.27
2008 56.72 14.57 0.24
2009 58.437 18.76 0.32
2010 62.48 23.15 0.37
2011 69.943 16.98 0.24
2012 73.72 21.863 0.29
2013 77,849.00 26,764 0.343
2014 86.83 27.759 0.31
2015 93.58 18.161 0.19
2016 85.32 20.182 0.236
Graph 3 Maicro Soft Mark Up Ration; Net Income and Sales Revenues
Source: Prepared by Author
⊘ This is a preview!⊘
Do you want full access?
Subscribe today to unlock all pages.
Trusted by 1+ million students worldwide
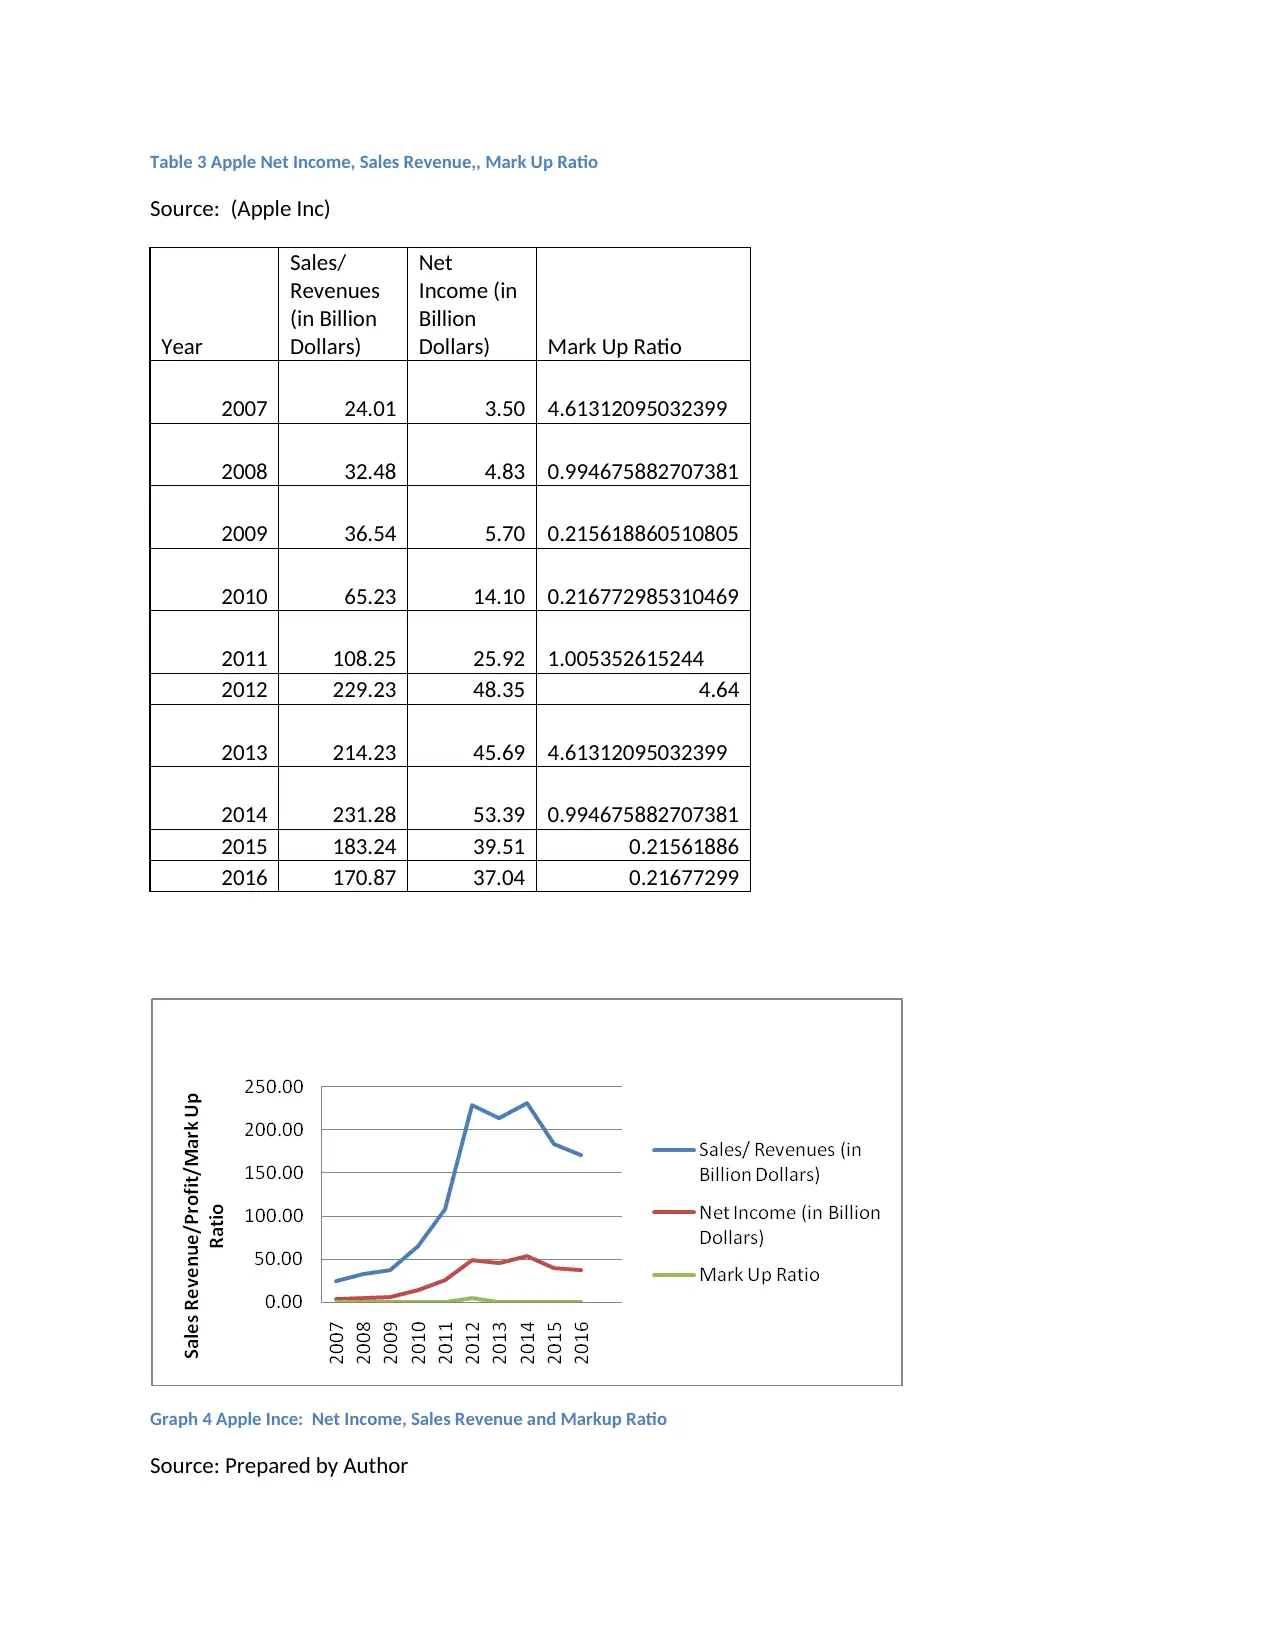
Table 3 Apple Net Income, Sales Revenue,, Mark Up Ratio
Source: (Apple Inc)
Year
Sales/
Revenues
(in Billion
Dollars)
Net
Income (in
Billion
Dollars) Mark Up Ratio
2007 24.01 3.50 4.61312095032399
2008 32.48 4.83 0.994675882707381
2009 36.54 5.70 0.215618860510805
2010 65.23 14.10 0.216772985310469
2011 108.25 25.92 1.005352615244
2012 229.23 48.35 4.64
2013 214.23 45.69 4.61312095032399
2014 231.28 53.39 0.994675882707381
2015 183.24 39.51 0.21561886
2016 170.87 37.04 0.21677299
Graph 4 Apple Ince: Net Income, Sales Revenue and Markup Ratio
Source: Prepared by Author
Paraphrase This Document
Need a fresh take? Get an instant paraphrase of this document with our AI Paraphraser
Reference
Apple Inc. http://investor.apple.com/. September 2017. 20 November 2017
<http://investor.apple.com/>.
Blanton, Robert and Dursun Peksen. The Dark Side of Economic Freedom: NEo Liberalism has
Deleterious Effects on Labour Rights. 2015. 20 November 2017
<blogs/lse.ac.uk/asappblog/2016/08/20/the-dark-side-of-economic-freedom-neo-liberalism-has-
deleterious-effects-on-labour-rights>.
Centeno, Miguel A and Joseph N Cohen. "The Arc of NeoLiberalism." Annual Review of Sociologu (2012).
Intenrational Financial Statistics. IMF Data : Access to Macro Economic and Financial Data. 2017. 20
November 2017 <http://data.imf.org/?sk=388DFA60-1D26-4ADE-B505-
A05A558D9A42&sId=1479331931186>.
Microsoft Corporation. Investors. 2017. 21 November 2017
<https://www.microsoft.com/en-us/investor/>.
OECD Library. "Country Statistical Profile: United Kingdom 2013." Country statistical profiles: Key tables
from OECD. OECD, 28 Feb 2013.
Office for National Statistics, United Kingdom. 2017. 11 November 2017.
Organization For Economic Co-operation and Development. Monthly Monetary and Financial Statistics
(MEI). 2017. 6 September 2017 <http://stats.oecd.org/Index.aspx?DatasetCode=MEI_FIN#>.
Organization for Economic Development and Co-operation. OECD Stat. 2017. 21 September 2017
<http://stats.oecd.org/>.
Ostry, Jonathan D, Praksh Lungani and Davide Furceri. "Neo Liberlism : Oversold." Finance and
Development (2016): 38-41.
Trochim, William M K. Levels of Measurement. 10 October 2006. 20 November 2017
<https://www.socialresearchmethods,net/kb/measlevi,php>.
Venugopal, Rajesh. "Neo Liberalism as a Concept." Economy and Scoiety (2015): 1-22.
1 out of 11


Your All-in-One AI-Powered Toolkit for Academic Success.
+13062052269
info@desklib.com
Available 24*7 on WhatsApp / Email
![[object Object]](/_next/static/media/star-bottom.7253800d.svg)
Unlock your academic potential
Copyright © 2020–2026 A2Z Services. All Rights Reserved. Developed and managed by ZUCOL.