Statistics Assignment: Data Analysis, Probability, and Inference
VerifiedAdded on 2020/05/16
|10
|1880
|101
Homework Assignment
AI Summary
This statistics assignment provides a comprehensive analysis of various statistical concepts. It begins with data analysis, including stem-and-leaf displays, histograms, and grouped bar charts, comparing turnover amounts in different regions. The assignment then delves into descriptive statistics, calculating means, standard deviations, and constructing box-whisker plots for financial data. Probability is explored through binomial and exponential distributions, with examples related to real estate and customer service. The assignment continues with hypothesis testing using normal approximations and t-tests, analyzing video game purchases and dental expenses. The solution demonstrates the application of statistical methods to interpret data, draw inferences, and make informed decisions, providing a valuable resource for students studying statistics. The assignment covers a range of topics, including descriptive statistics, probability distributions, hypothesis testing, and statistical inference.

Running head: STATSTICS
Statistics
Name of the Student:
Name of the University:
Author’s note:
Statistics
Name of the Student:
Name of the University:
Author’s note:
Paraphrase This Document
Need a fresh take? Get an instant paraphrase of this document with our AI Paraphraser
1STATSTICS
Table of Contents
Question 1:...................................................................................................................................................................................................................2
Part A........................................................................................................................................................................................................................2
Part B........................................................................................................................................................................................................................2
Part C........................................................................................................................................................................................................................3
Question 2:...................................................................................................................................................................................................................4
Part A........................................................................................................................................................................................................................4
Part B........................................................................................................................................................................................................................4
Part C........................................................................................................................................................................................................................4
Question 3:...................................................................................................................................................................................................................5
Question 4:...................................................................................................................................................................................................................5
Part A........................................................................................................................................................................................................................5
Part B........................................................................................................................................................................................................................6
Part C........................................................................................................................................................................................................................6
Question 5:...................................................................................................................................................................................................................7
Part A........................................................................................................................................................................................................................7
Part B........................................................................................................................................................................................................................7
Part C........................................................................................................................................................................................................................8
2STATSTICS
Question 1:
Part A
a) The stem-and-leaf display with one stem value in the middle and Australian Capital Territory leaves on the right side and Tasmania
leaves on the left side is constructed in the following:
Turnover ; Tasmania ; Total ($ millions)
Turnover ; Australian Capital Territory ;
Total ($ millions)
Minimum 493.50 456.1
Maximum 519 479.3
Stem & Leaf Diagram
Turnover ; Tasmania ; Total
($ millions)
Turnover ; Australian Capital Territory ;
Total ($ millions)
Leaf Stem Leaf
45 6.1 8.8 9.5 9.6 9.6
46 0.8 3.3 6.4 9.2
47 1.2 2.1 2.4 2.9 4.2 6.1 7.7 7.8 8.6 9 9.1 9.3
48
3.5 5.3 7 8.4 9.6 49
0.8 2 3.6 5.5 7 8 8.4 9.1 50
0.5 2.7 5.2 7.3 8.6 9 8.4 8.9 51
52
Part B
b)
A relative frequency histogram for Tasmania and a frequency polygon for Australian Capital Territory on the same graph with equal
class widths are constructed in the following:
Turnover ; Tasmania ; Total ($
millions)
Turnover ; Australian Capital
Territory ; Total ($ millions)
Group
Group
Interval Class wise frequencies
Relative
Frequencies Class wise frequencies
$400-$450 $399.5-$450.5 0 0 0
$451-$460 $450.5-$460.5 0 0 0
$461-$470 $460.5-$470.5 0 0 0
$471-$480 $470.5-$480.5 0 0 0
$481-$490 $480.5-$490.5 0 0 0
$491-$500 $490.5-$500.5 5 0.238095238 5
$501-$510 $500.5-$510.5 8 0.380952381 8
$511-$520 $510.5-$520.5 8 0.380952381 8
Greater than
$521 $520.5-$530.5 0 0 0
Total 21 1 21
⊘ This is a preview!⊘
Do you want full access?
Subscribe today to unlock all pages.
Trusted by 1+ million students worldwide
3STATSTICS
$400-$450 $451-$460 $461-$470 $471-$480 $481-$490 $491-$500 $501-$510 $511-$520 Greater than
$521
0
2
4
6
8
10
12
14
Relative Frequency Histogram and Frequency Polygon
Turnover ; Tasmania ; Total ($
millions) classwise frequencies
Turnover ; Australian Capital
Territory ; Total ($ millions) class
wise frequencies
Classes of amount of Turnover
Figure 1: A relative frequency histogram of Turnover Amount in Tasmania and a frequency polygon for Australian Capital Territory
Part C
c)
Jan-16
Feb-16
Mar-16
Apr-16
May-16
Jun-16
Jul-16
Aug-16
Sep-16
Oct-16
Nov-16
Dec-16
Jan-17
Feb-17
Mar-17
Apr-17
May-17
Jun-17
Jul-17
Aug-17
Sep-17
420
440
460
480
500
520
540
Grouped bar-chart of two types of Turnover Totals
Turnover ;
Tasmania ; Total ($
millions)
Turnover ; Australian
Capital Territory ;
Total ($ millions)
Month
Amount in $ million
Figure 3: A grouped bar chart for Tasmanian and Australian Capital Territory
The data wise grouped bar chart of Capital Territory of Tasmania and Australia shows that throughout the whole tenure of observation
that is January 2016 to September 2017, Turnover amount ($ millions) in Tasmania is greater than Australian Territory. Both are increasing
significantly year after year. The overall increment of Turnover amount is slightly greater for Tasmania than Australia.
Question 2:
Part A
a)
Paraphrase This Document
Need a fresh take? Get an instant paraphrase of this document with our AI Paraphraser
4STATSTICS
S&P/ASX 50 Price ($) S&P/ASX 200 Price ($)
Mean 5,742.29 5,821.73
Standard Deviation 83.22296 93.48074
Part B
b)
S&P/ASX 50 Price ($) S&P/ASX 200 Price ($)
Minimum 5,584.02 5,651.77
1st Quartile (Q1) 5,669.22 5,738.40
Median (Q2) 5,786.52 5,868.19
3rd Quartile (Q3) 5,810.18 5,901.77
Maximum 5,825.99 5,919.08
Part C
c)
S&P/ASX 50 Price ($) S&P/ASX 200 Price ($)
5,550.00
5,600.00
5,650.00
5,700.00
5,750.00
5,800.00
5,850.00
5,900.00
5,950.00
Grouped Box plot shows the distribution of both types of S&P/ASX Prices ($)
S&P/ASX 50 Price ($) indexes
d) The grouped Box-Whisker’s plot of “S&P/ASX 50 Price ($)” and “S&P/ASX 200 Price ($)” shows that minimum, 1 st quartile, median, 3rd
quartile and maximum values of S&P/ASX 200 Price index are greater than S&P/ASX 50 Price index. The range (=Maximum-Minimum) of
S&P/ASX 200 Price index is also greater than the other one.
Question 3:
Dwelling Structure Total
occupied
private
dwellings
Separate
house
Semi-detached,
row or terrace
house,
townhouse
Flat, unit or
apartment
Mortgage Repayment (monthly)
Total
Total 2709429.00 2324546.0
0
190411 187375 5411761.0
0
$0-$299 114197 99624 7352 6694 227867.00
S&P/ASX 50 Price ($) S&P/ASX 200 Price ($)
Mean 5,742.29 5,821.73
Standard Deviation 83.22296 93.48074
Part B
b)
S&P/ASX 50 Price ($) S&P/ASX 200 Price ($)
Minimum 5,584.02 5,651.77
1st Quartile (Q1) 5,669.22 5,738.40
Median (Q2) 5,786.52 5,868.19
3rd Quartile (Q3) 5,810.18 5,901.77
Maximum 5,825.99 5,919.08
Part C
c)
S&P/ASX 50 Price ($) S&P/ASX 200 Price ($)
5,550.00
5,600.00
5,650.00
5,700.00
5,750.00
5,800.00
5,850.00
5,900.00
5,950.00
Grouped Box plot shows the distribution of both types of S&P/ASX Prices ($)
S&P/ASX 50 Price ($) indexes
d) The grouped Box-Whisker’s plot of “S&P/ASX 50 Price ($)” and “S&P/ASX 200 Price ($)” shows that minimum, 1 st quartile, median, 3rd
quartile and maximum values of S&P/ASX 200 Price index are greater than S&P/ASX 50 Price index. The range (=Maximum-Minimum) of
S&P/ASX 200 Price index is also greater than the other one.
Question 3:
Dwelling Structure Total
occupied
private
dwellings
Separate
house
Semi-detached,
row or terrace
house,
townhouse
Flat, unit or
apartment
Mortgage Repayment (monthly)
Total
Total 2709429.00 2324546.0
0
190411 187375 5411761.0
0
$0-$299 114197 99624 7352 6694 227867.00
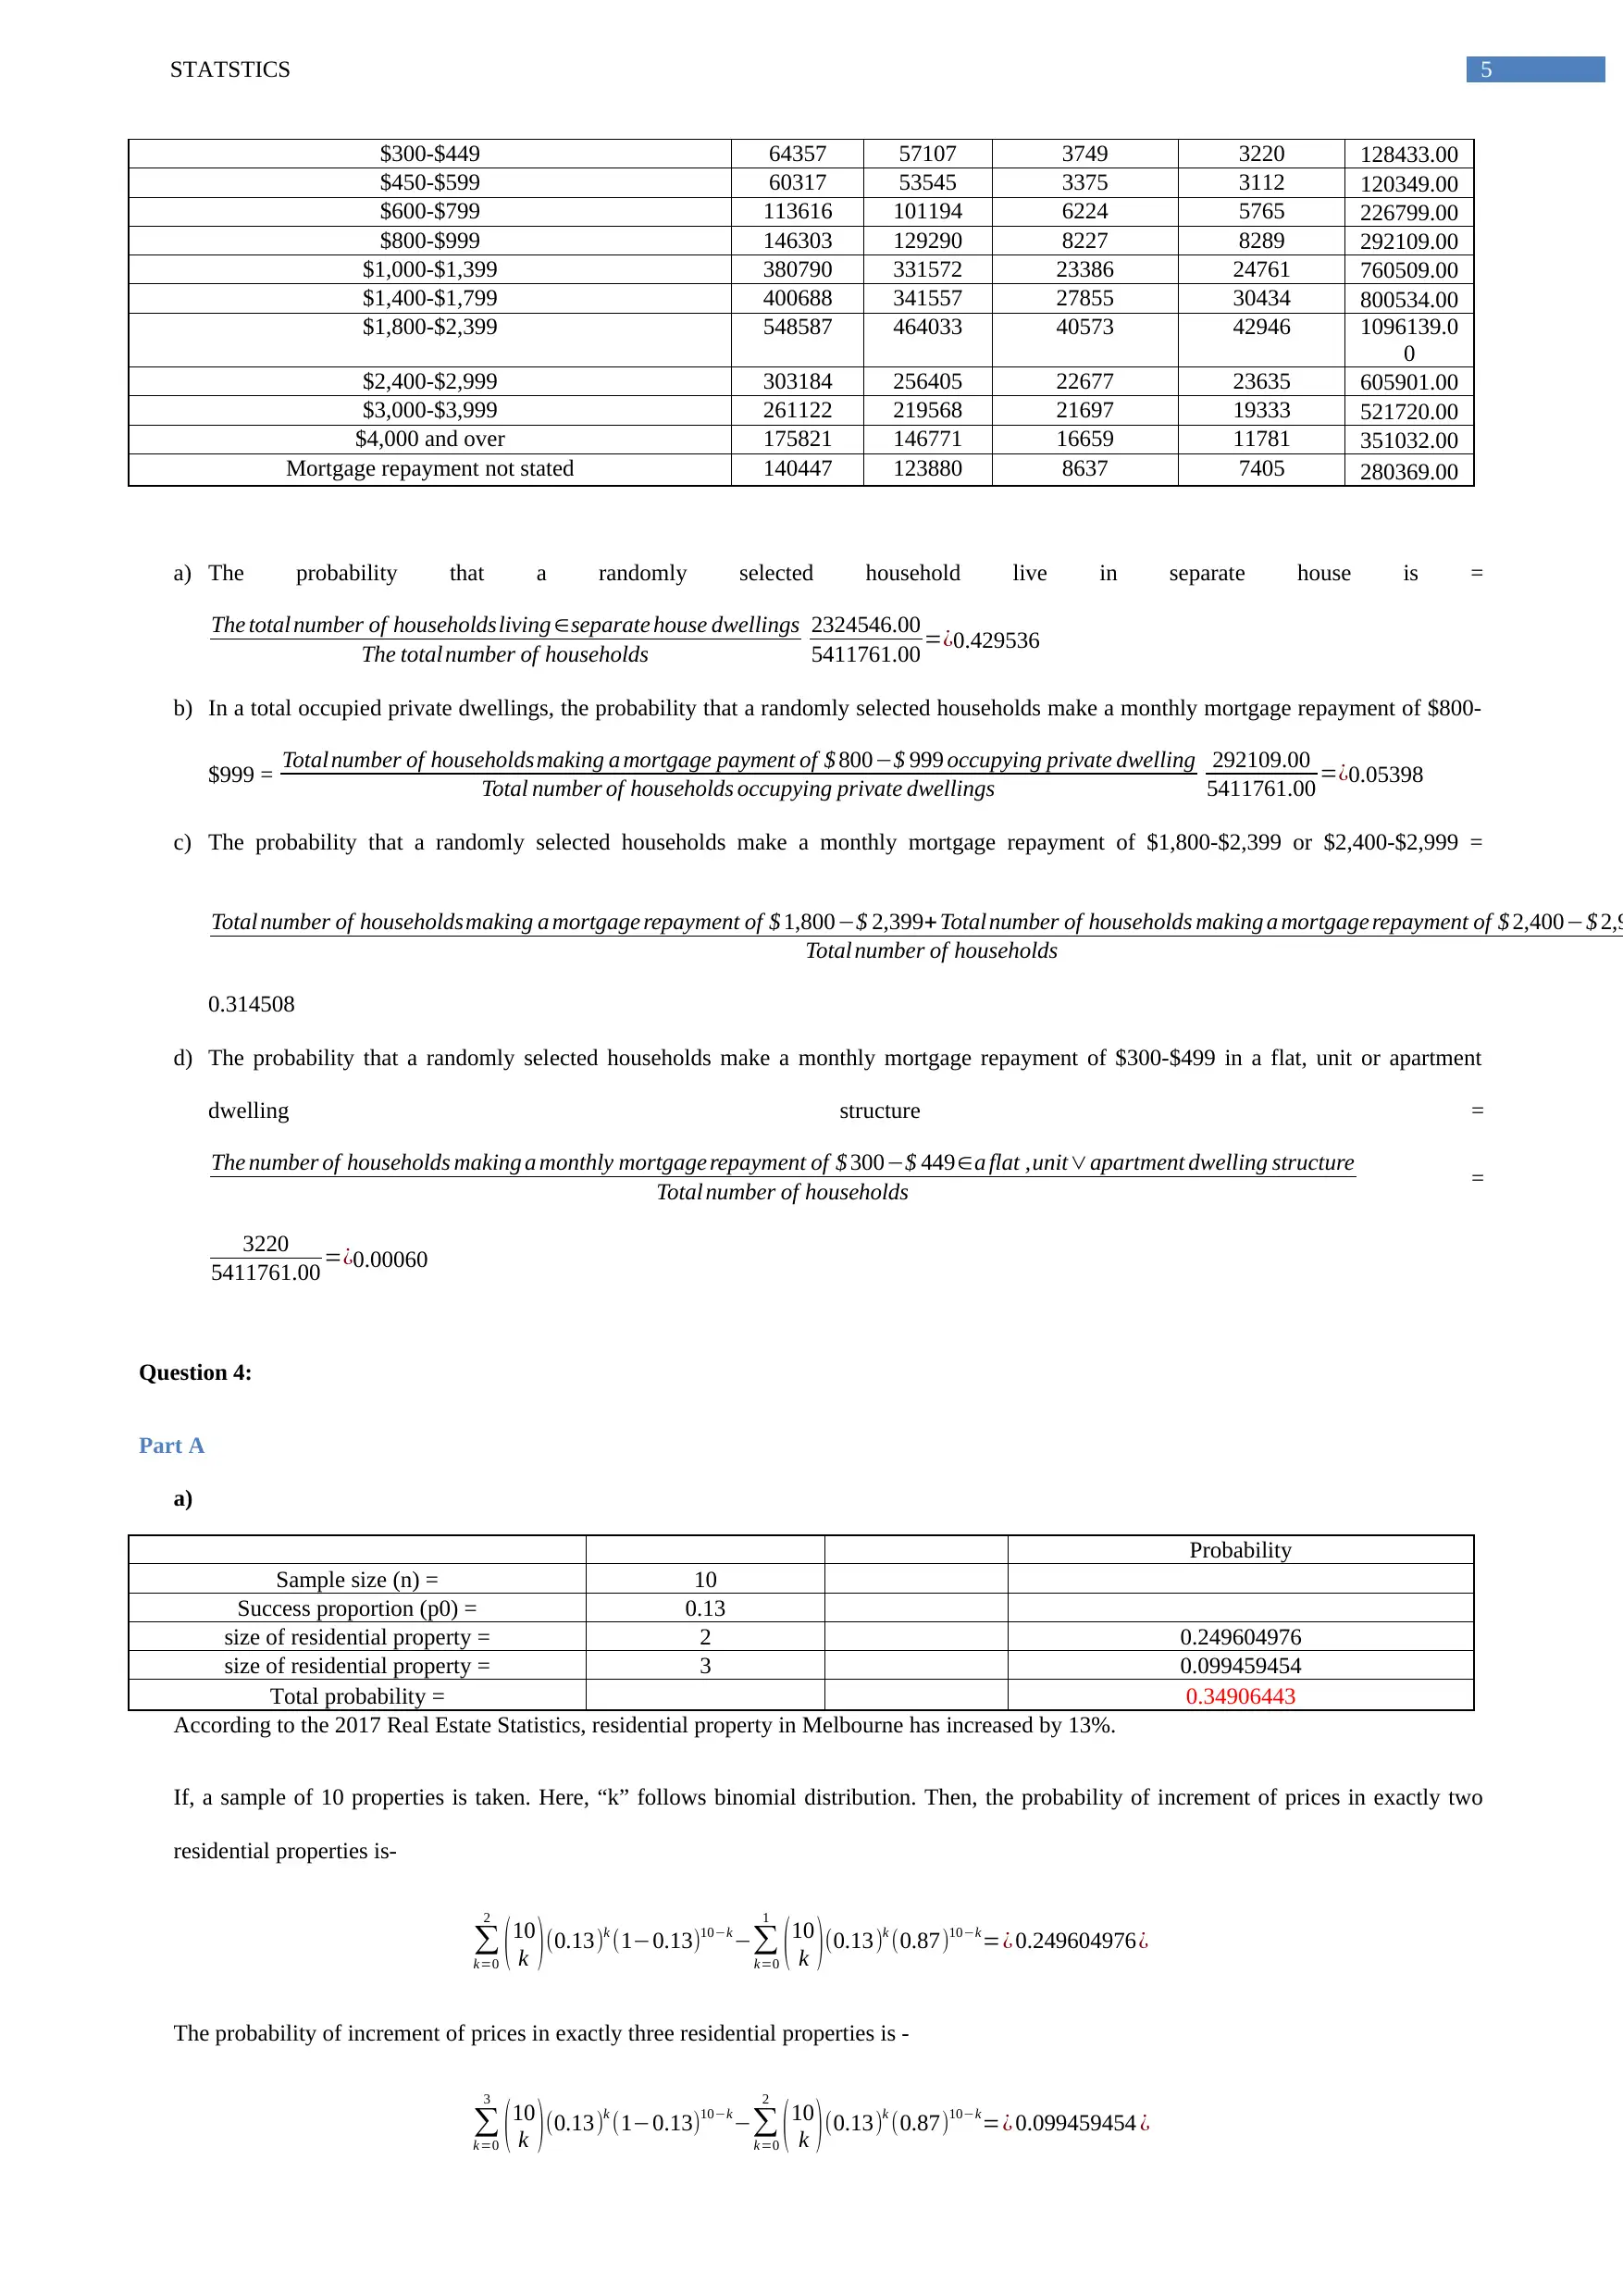
5STATSTICS
$300-$449 64357 57107 3749 3220 128433.00
$450-$599 60317 53545 3375 3112 120349.00
$600-$799 113616 101194 6224 5765 226799.00
$800-$999 146303 129290 8227 8289 292109.00
$1,000-$1,399 380790 331572 23386 24761 760509.00
$1,400-$1,799 400688 341557 27855 30434 800534.00
$1,800-$2,399 548587 464033 40573 42946 1096139.0
0
$2,400-$2,999 303184 256405 22677 23635 605901.00
$3,000-$3,999 261122 219568 21697 19333 521720.00
$4,000 and over 175821 146771 16659 11781 351032.00
Mortgage repayment not stated 140447 123880 8637 7405 280369.00
a) The probability that a randomly selected household live in separate house is =
The total number of householdsliving ∈separate house dwellings
The total number of households
2324546.00
5411761.00 =¿0.429536
b) In a total occupied private dwellings, the probability that a randomly selected households make a monthly mortgage repayment of $800-
$999 = Total number of householdsmaking a mortgage payment of $ 800−$ 999 occupying private dwelling
Total number of households occupying private dwellings
292109.00
5411761.00 =¿0.05398
c) The probability that a randomly selected households make a monthly mortgage repayment of $1,800-$2,399 or $2,400-$2,999 =
Total number of householdsmaking a mortgage repayment of $ 1,800−$ 2,399+ Total number of households making a mortgage repayment of $ 2,400−$ 2,9
Total number of households
0.314508
d) The probability that a randomly selected households make a monthly mortgage repayment of $300-$499 in a flat, unit or apartment
dwelling structure =
The number of households making a monthly mortgage repayment of $ 300−$ 449∈a flat ,unit∨apartment dwelling structure
Total number of households =
3220
5411761.00 =¿0.00060
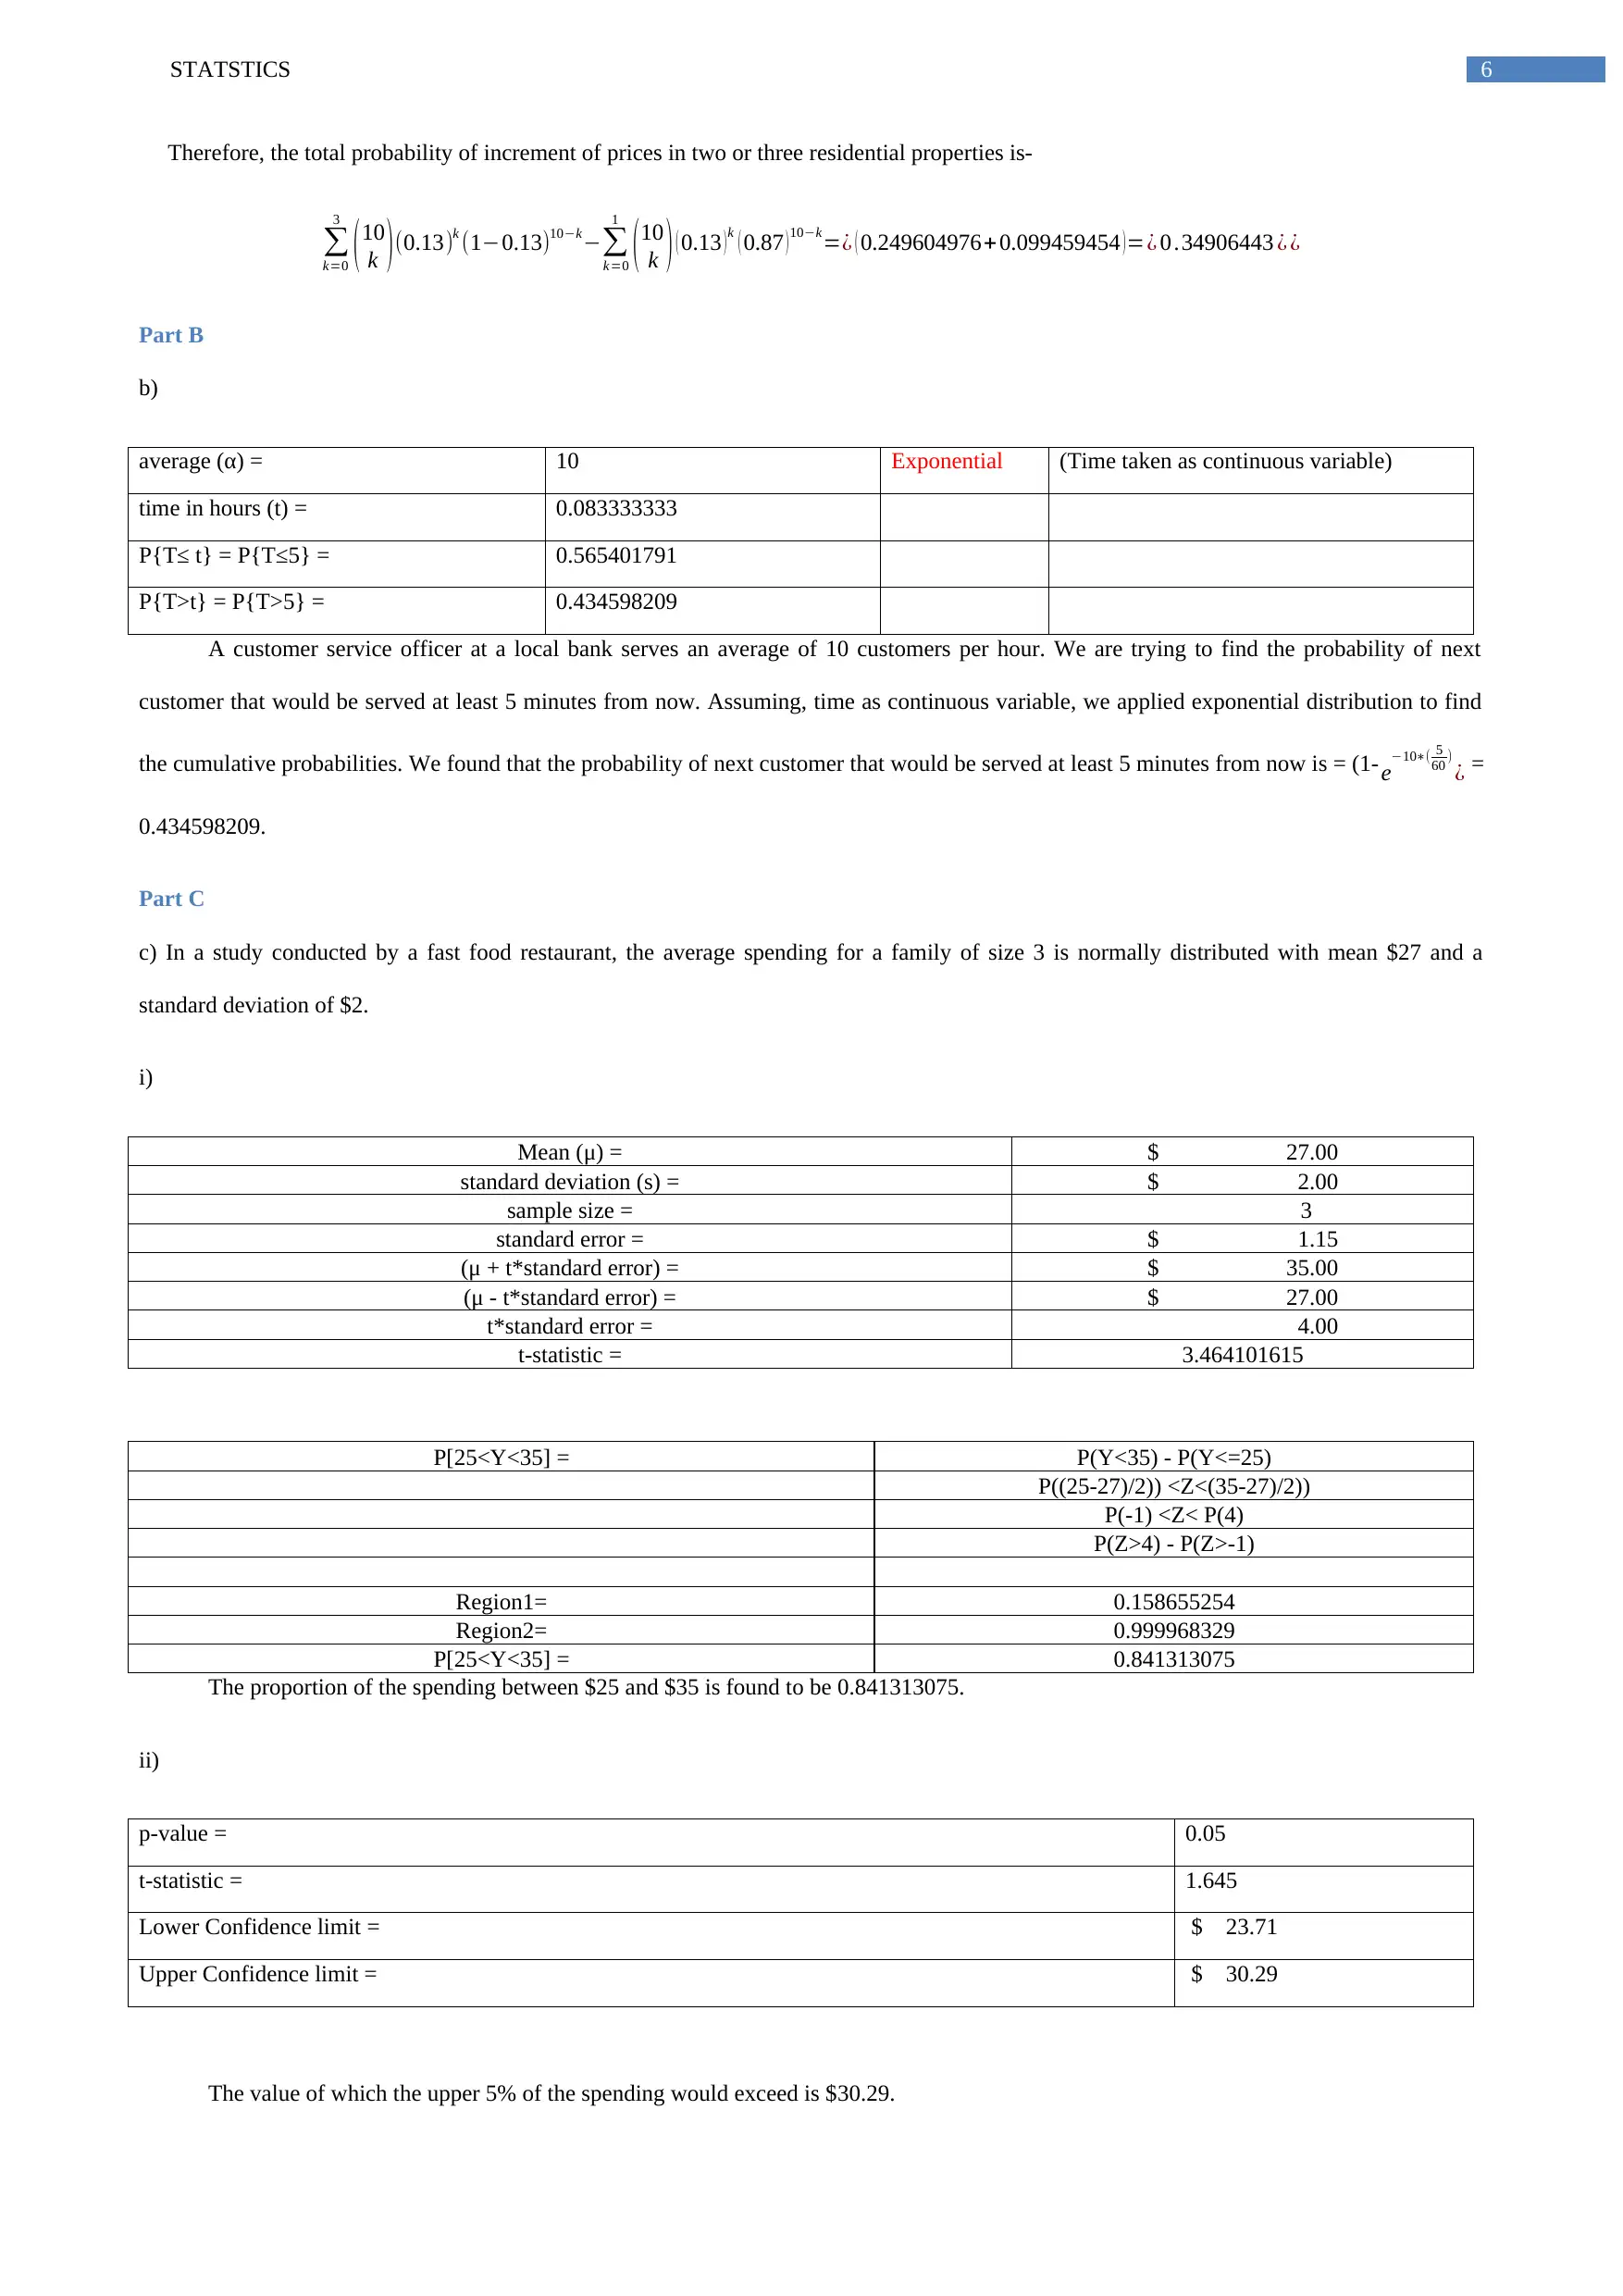
Question 4:
Part A
a)
Probability
Sample size (n) = 10
Success proportion (p0) = 0.13
size of residential property = 2 0.249604976
size of residential property = 3 0.099459454
Total probability = 0.34906443
According to the 2017 Real Estate Statistics, residential property in Melbourne has increased by 13%.
If, a sample of 10 properties is taken. Here, “k” follows binomial distribution. Then, the probability of increment of prices in exactly two
residential properties is-
∑
k=0
2
(10
k )(0.13)k (1−0.13)10−k−∑
k=0
1
(10
k )(0.13)k (0.87)10−k=¿ 0.249604976¿
The probability of increment of prices in exactly three residential properties is -
∑
k=0
3
(10
k )(0.13)k (1−0.13)10−k−∑
k=0
2
(10
k )(0.13)k (0.87)10−k=¿ 0.099459454 ¿
$300-$449 64357 57107 3749 3220 128433.00
$450-$599 60317 53545 3375 3112 120349.00
$600-$799 113616 101194 6224 5765 226799.00
$800-$999 146303 129290 8227 8289 292109.00
$1,000-$1,399 380790 331572 23386 24761 760509.00
$1,400-$1,799 400688 341557 27855 30434 800534.00
$1,800-$2,399 548587 464033 40573 42946 1096139.0
0
$2,400-$2,999 303184 256405 22677 23635 605901.00
$3,000-$3,999 261122 219568 21697 19333 521720.00
$4,000 and over 175821 146771 16659 11781 351032.00
Mortgage repayment not stated 140447 123880 8637 7405 280369.00
a) The probability that a randomly selected household live in separate house is =
The total number of householdsliving ∈separate house dwellings
The total number of households
2324546.00
5411761.00 =¿0.429536
b) In a total occupied private dwellings, the probability that a randomly selected households make a monthly mortgage repayment of $800-
$999 = Total number of householdsmaking a mortgage payment of $ 800−$ 999 occupying private dwelling
Total number of households occupying private dwellings
292109.00
5411761.00 =¿0.05398
c) The probability that a randomly selected households make a monthly mortgage repayment of $1,800-$2,399 or $2,400-$2,999 =
Total number of householdsmaking a mortgage repayment of $ 1,800−$ 2,399+ Total number of households making a mortgage repayment of $ 2,400−$ 2,9
Total number of households
0.314508
d) The probability that a randomly selected households make a monthly mortgage repayment of $300-$499 in a flat, unit or apartment
dwelling structure =
The number of households making a monthly mortgage repayment of $ 300−$ 449∈a flat ,unit∨apartment dwelling structure
Total number of households =
3220
5411761.00 =¿0.00060
Question 4:
Part A
a)
Probability
Sample size (n) = 10
Success proportion (p0) = 0.13
size of residential property = 2 0.249604976
size of residential property = 3 0.099459454
Total probability = 0.34906443
According to the 2017 Real Estate Statistics, residential property in Melbourne has increased by 13%.
If, a sample of 10 properties is taken. Here, “k” follows binomial distribution. Then, the probability of increment of prices in exactly two
residential properties is-
∑
k=0
2
(10
k )(0.13)k (1−0.13)10−k−∑
k=0
1
(10
k )(0.13)k (0.87)10−k=¿ 0.249604976¿
The probability of increment of prices in exactly three residential properties is -
∑
k=0
3
(10
k )(0.13)k (1−0.13)10−k−∑
k=0
2
(10
k )(0.13)k (0.87)10−k=¿ 0.099459454 ¿
⊘ This is a preview!⊘
Do you want full access?
Subscribe today to unlock all pages.
Trusted by 1+ million students worldwide
6STATSTICS
Therefore, the total probability of increment of prices in two or three residential properties is-
∑
k=0
3
(10
k )(0.13)k (1−0.13)10−k−∑
k=0
1
(10
k ) ( 0.13 )k ( 0.87 )10−k=¿ ( 0.249604976+0.099459454 )=¿ 0 .34906443 ¿ ¿
Part B
b)
average (α) = 10 Exponential (Time taken as continuous variable)
time in hours (t) = 0.083333333
P{T≤ t} = P{T≤5} = 0.565401791
P{T>t} = P{T>5} = 0.434598209
A customer service officer at a local bank serves an average of 10 customers per hour. We are trying to find the probability of next
customer that would be served at least 5 minutes from now. Assuming, time as continuous variable, we applied exponential distribution to find
the cumulative probabilities. We found that the probability of next customer that would be served at least 5 minutes from now is = (1-e−10∗( 5
60 )
¿ =
0.434598209.
Part C
c) In a study conducted by a fast food restaurant, the average spending for a family of size 3 is normally distributed with mean $27 and a
standard deviation of $2.
i)
Mean (μ) = $ 27.00
standard deviation (s) = $ 2.00
sample size = 3
standard error = $ 1.15
(μ + t*standard error) = $ 35.00
(μ - t*standard error) = $ 27.00
t*standard error = 4.00
t-statistic = 3.464101615
P[25<Y<35] = P(Y<35) - P(Y<=25)
P((25-27)/2)) <Z<(35-27)/2))
P(-1) <Z< P(4)
P(Z>4) - P(Z>-1)
Region1= 0.158655254
Region2= 0.999968329
P[25<Y<35] = 0.841313075
The proportion of the spending between $25 and $35 is found to be 0.841313075.
ii)
p-value = 0.05
t-statistic = 1.645
Lower Confidence limit = $ 23.71
Upper Confidence limit = $ 30.29
The value of which the upper 5% of the spending would exceed is $30.29.
Paraphrase This Document
Need a fresh take? Get an instant paraphrase of this document with our AI Paraphraser
7STATSTICS
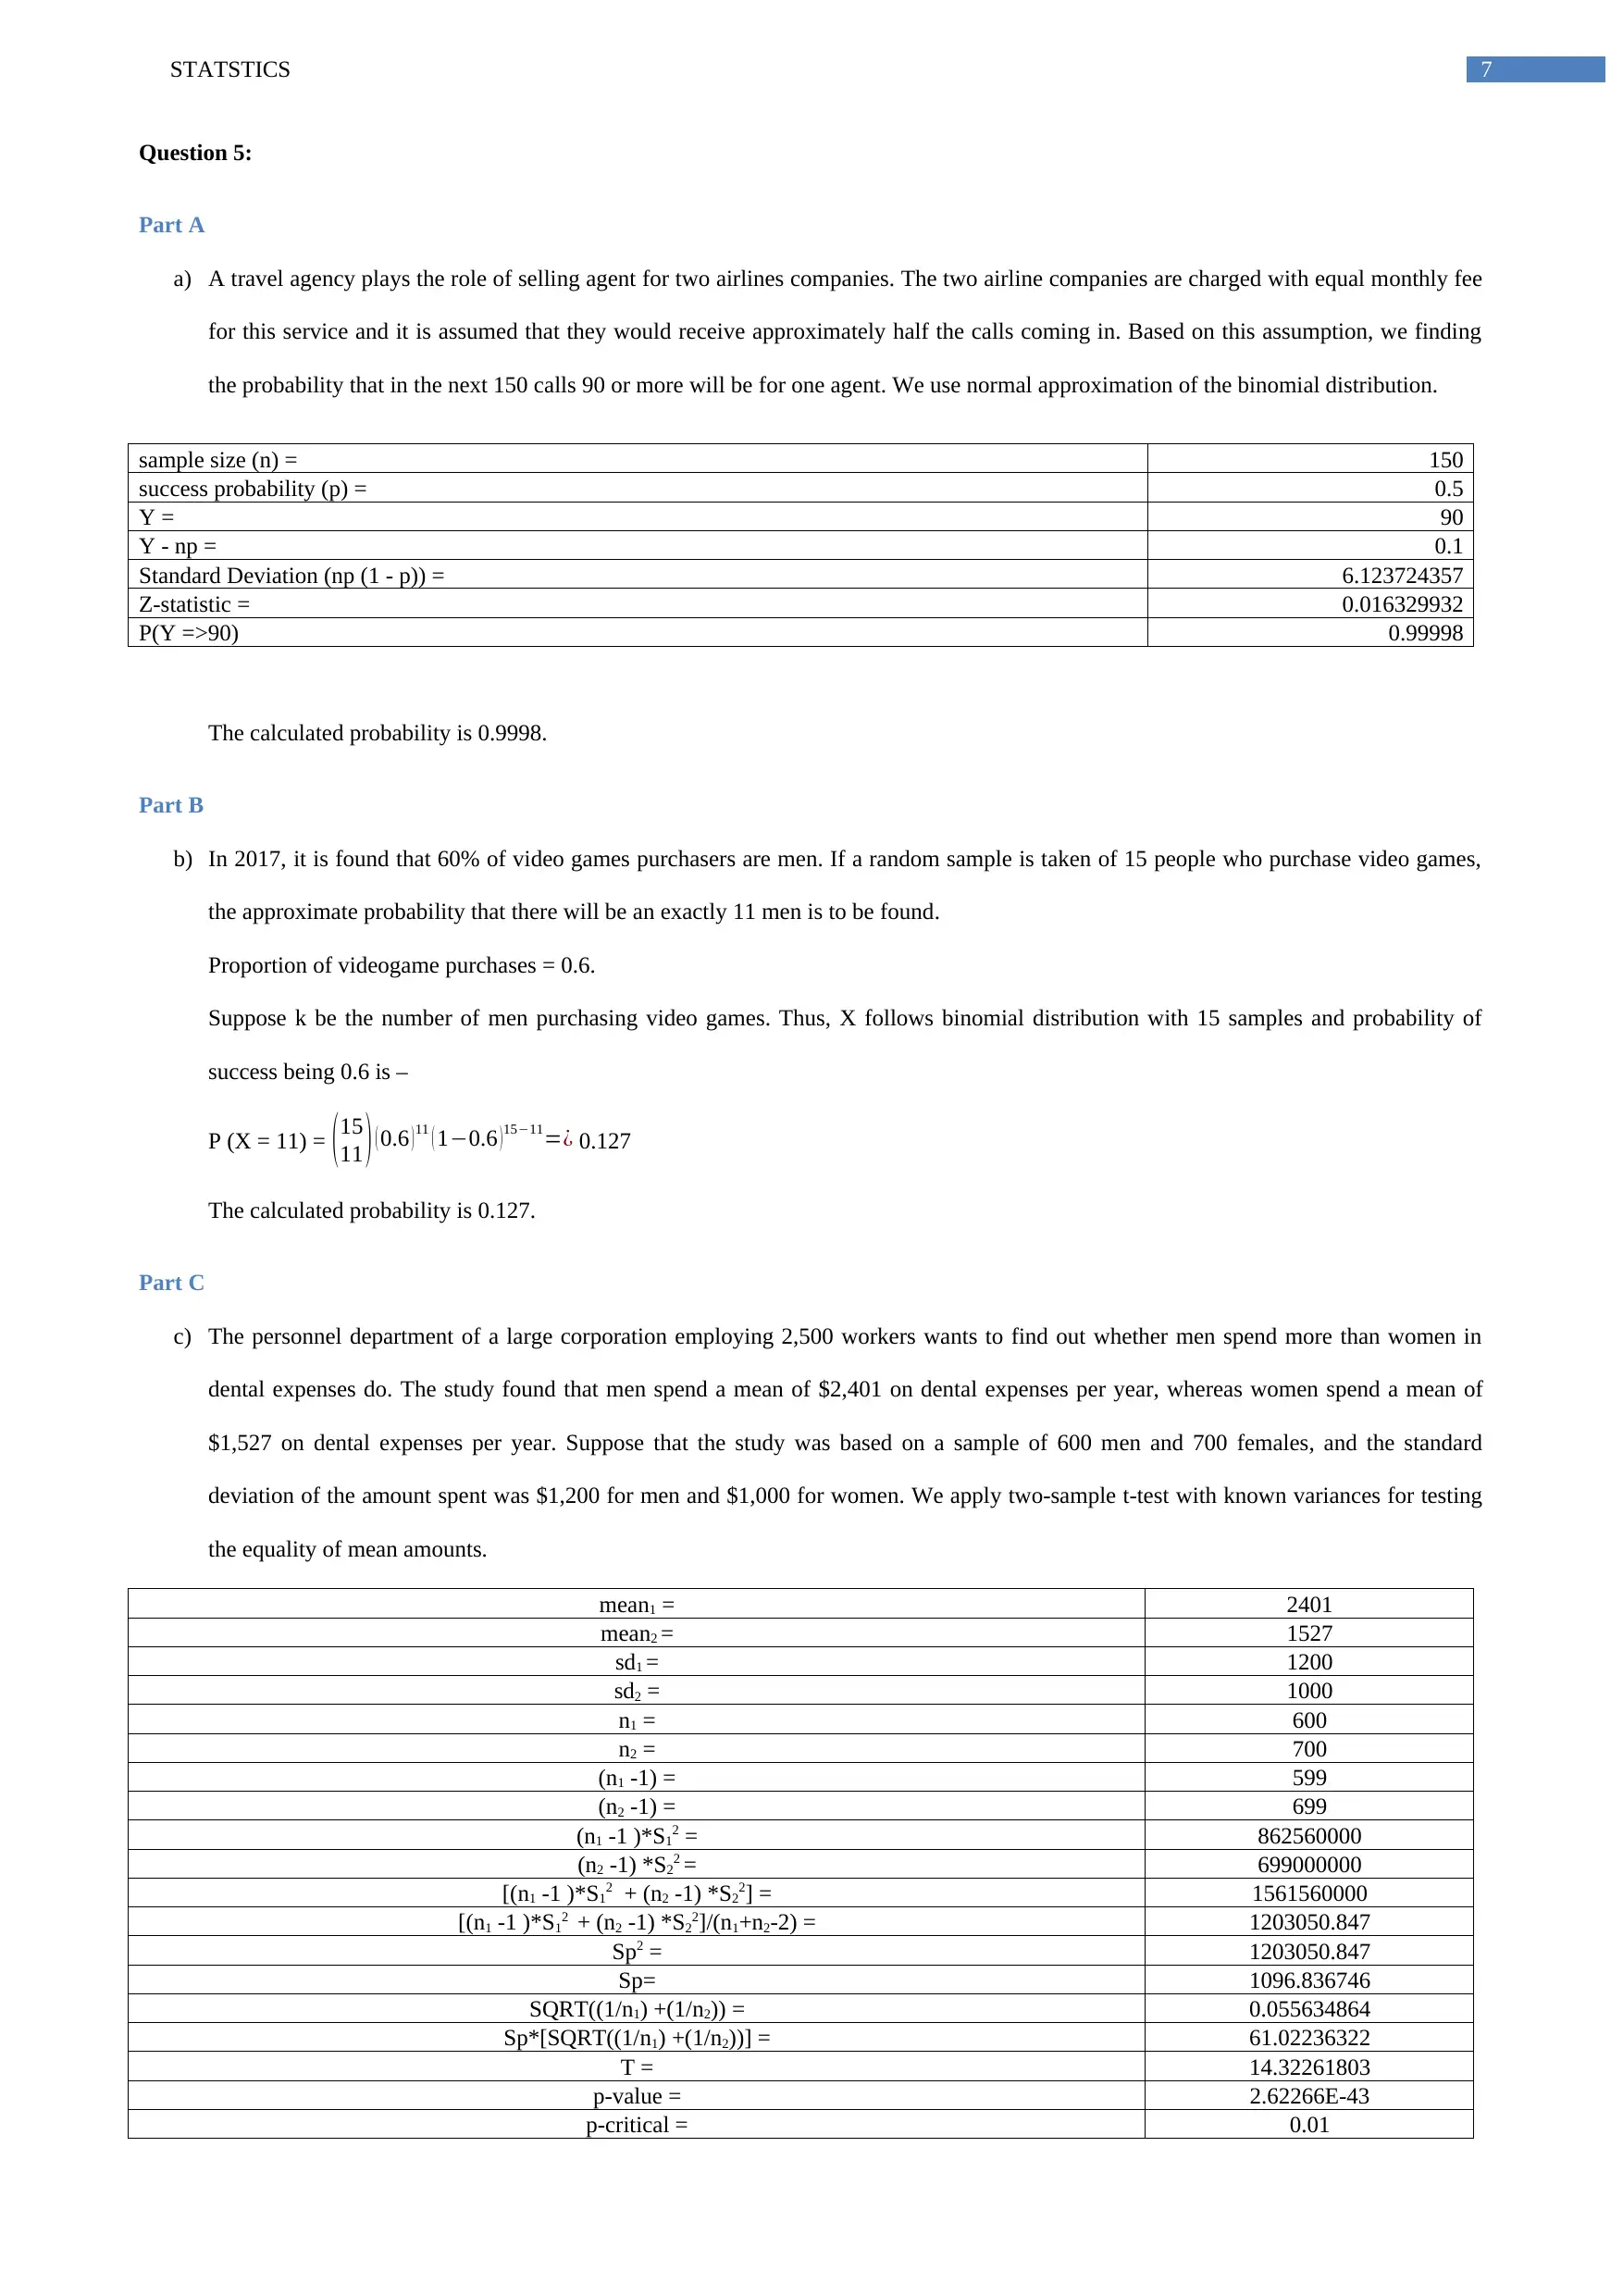
Question 5:
Part A
a) A travel agency plays the role of selling agent for two airlines companies. The two airline companies are charged with equal monthly fee
for this service and it is assumed that they would receive approximately half the calls coming in. Based on this assumption, we finding
the probability that in the next 150 calls 90 or more will be for one agent. We use normal approximation of the binomial distribution.
sample size (n) = 150
success probability (p) = 0.5
Y = 90
Y - np = 0.1
Standard Deviation (np (1 - p)) = 6.123724357
Z-statistic = 0.016329932
P(Y =>90) 0.99998
The calculated probability is 0.9998.
Part B
b) In 2017, it is found that 60% of video games purchasers are men. If a random sample is taken of 15 people who purchase video games,
the approximate probability that there will be an exactly 11 men is to be found.
Proportion of videogame purchases = 0.6.
Suppose k be the number of men purchasing video games. Thus, X follows binomial distribution with 15 samples and probability of
success being 0.6 is –
P (X = 11) = ( 15
11 ) ( 0.6 ) 11 ( 1−0.6 ) 15−11=¿ 0.127
The calculated probability is 0.127.
Part C
c) The personnel department of a large corporation employing 2,500 workers wants to find out whether men spend more than women in
dental expenses do. The study found that men spend a mean of $2,401 on dental expenses per year, whereas women spend a mean of
$1,527 on dental expenses per year. Suppose that the study was based on a sample of 600 men and 700 females, and the standard
deviation of the amount spent was $1,200 for men and $1,000 for women. We apply two-sample t-test with known variances for testing
the equality of mean amounts.
mean1 = 2401
mean2 = 1527
sd1 = 1200
sd2 = 1000
n1 = 600
n2 = 700
(n1 -1) = 599
(n2 -1) = 699
(n1 -1 )*S12 = 862560000
(n2 -1) *S22 = 699000000
[(n1 -1 )*S12 + (n2 -1) *S22] = 1561560000
[(n1 -1 )*S12 + (n2 -1) *S22]/(n1+n2-2) = 1203050.847
Sp2 = 1203050.847
Sp= 1096.836746
SQRT((1/n1) +(1/n2)) = 0.055634864
Sp*[SQRT((1/n1) +(1/n2))] = 61.02236322
T = 14.32261803
p-value = 2.62266E-43
p-critical = 0.01
8STATSTICS
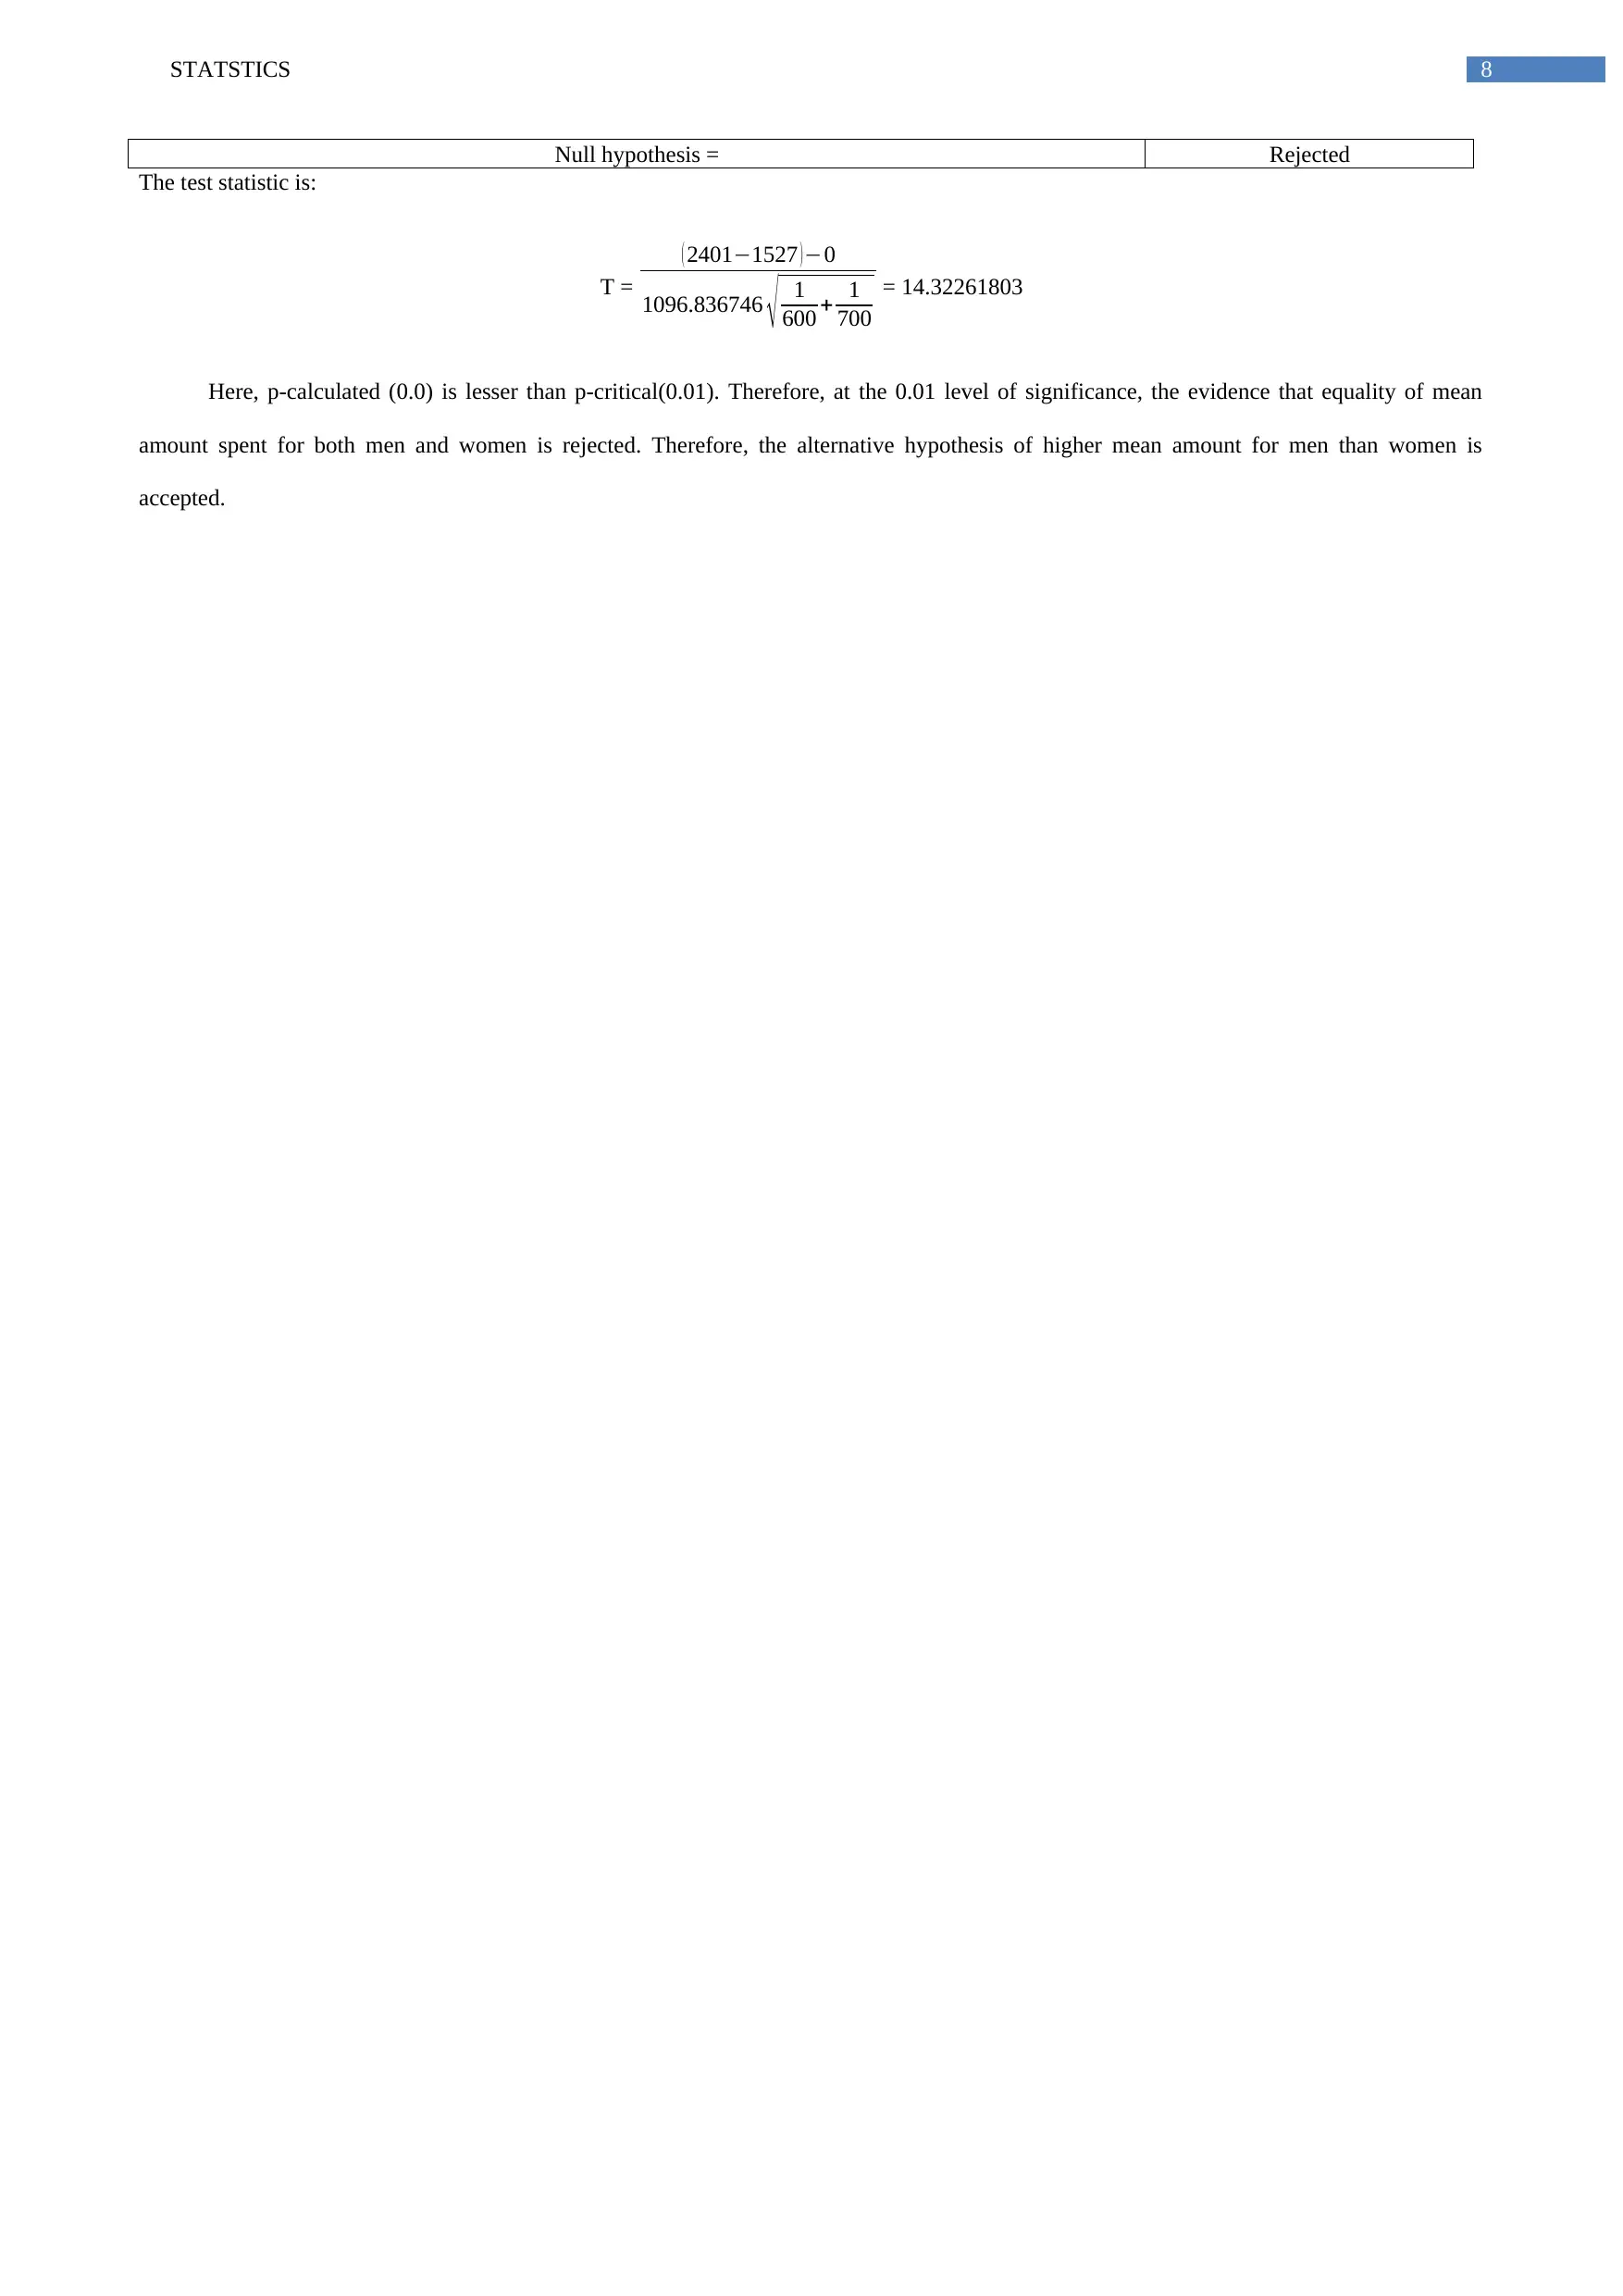
Null hypothesis = Rejected
The test statistic is:
T =
( 2401−1527 )−0
1096.836746 √ 1
600 + 1
700
= 14.32261803
Here, p-calculated (0.0) is lesser than p-critical(0.01). Therefore, at the 0.01 level of significance, the evidence that equality of mean
amount spent for both men and women is rejected. Therefore, the alternative hypothesis of higher mean amount for men than women is
accepted.
⊘ This is a preview!⊘
Do you want full access?
Subscribe today to unlock all pages.
Trusted by 1+ million students worldwide

9STATSTICS
1 out of 10
Related Documents


Your All-in-One AI-Powered Toolkit for Academic Success.
+13062052269
info@desklib.com
Available 24*7 on WhatsApp / Email
![[object Object]](/_next/static/media/star-bottom.7253800d.svg)
Unlock your academic potential
Copyright © 2020–2026 A2Z Services. All Rights Reserved. Developed and managed by ZUCOL.