Statistics for Business and Finance - Desklib
Analyse and interpret real-world demographic data using statistical methods and Excel. Submit a report in Word and an Excel document with calculations.
10 Pages1381 Words56 Views
Added on 2023-06-07
About This Document
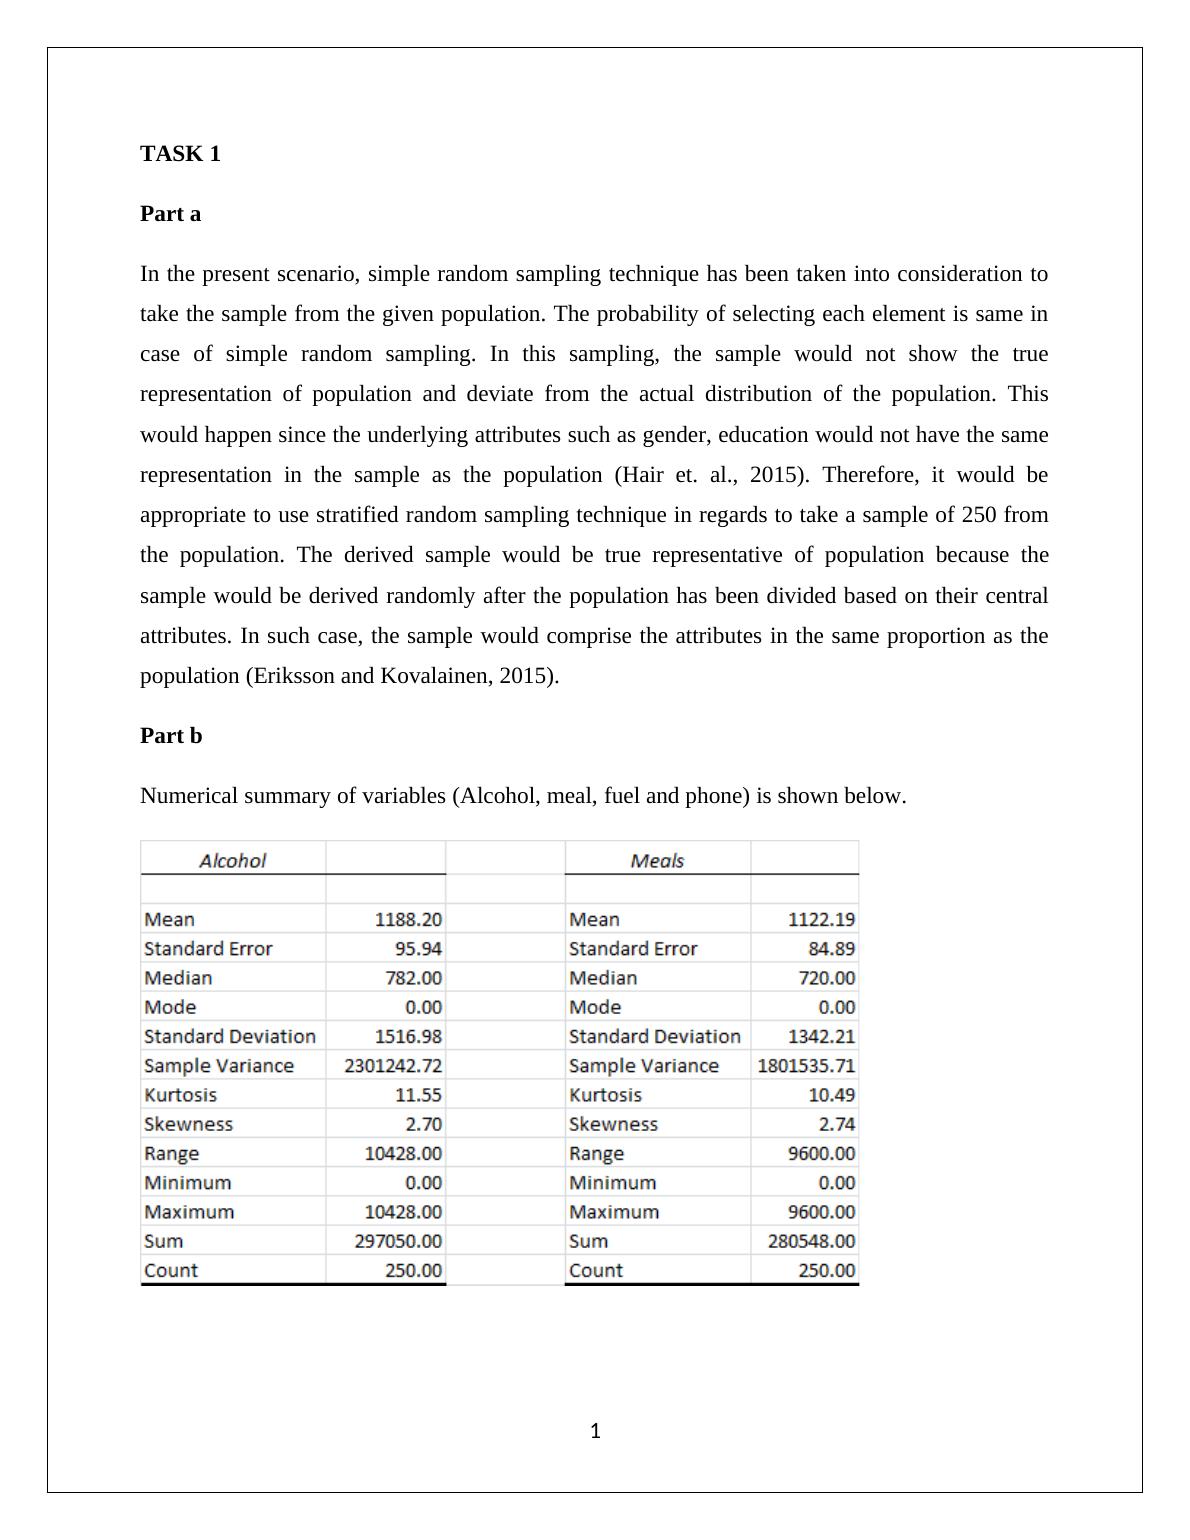
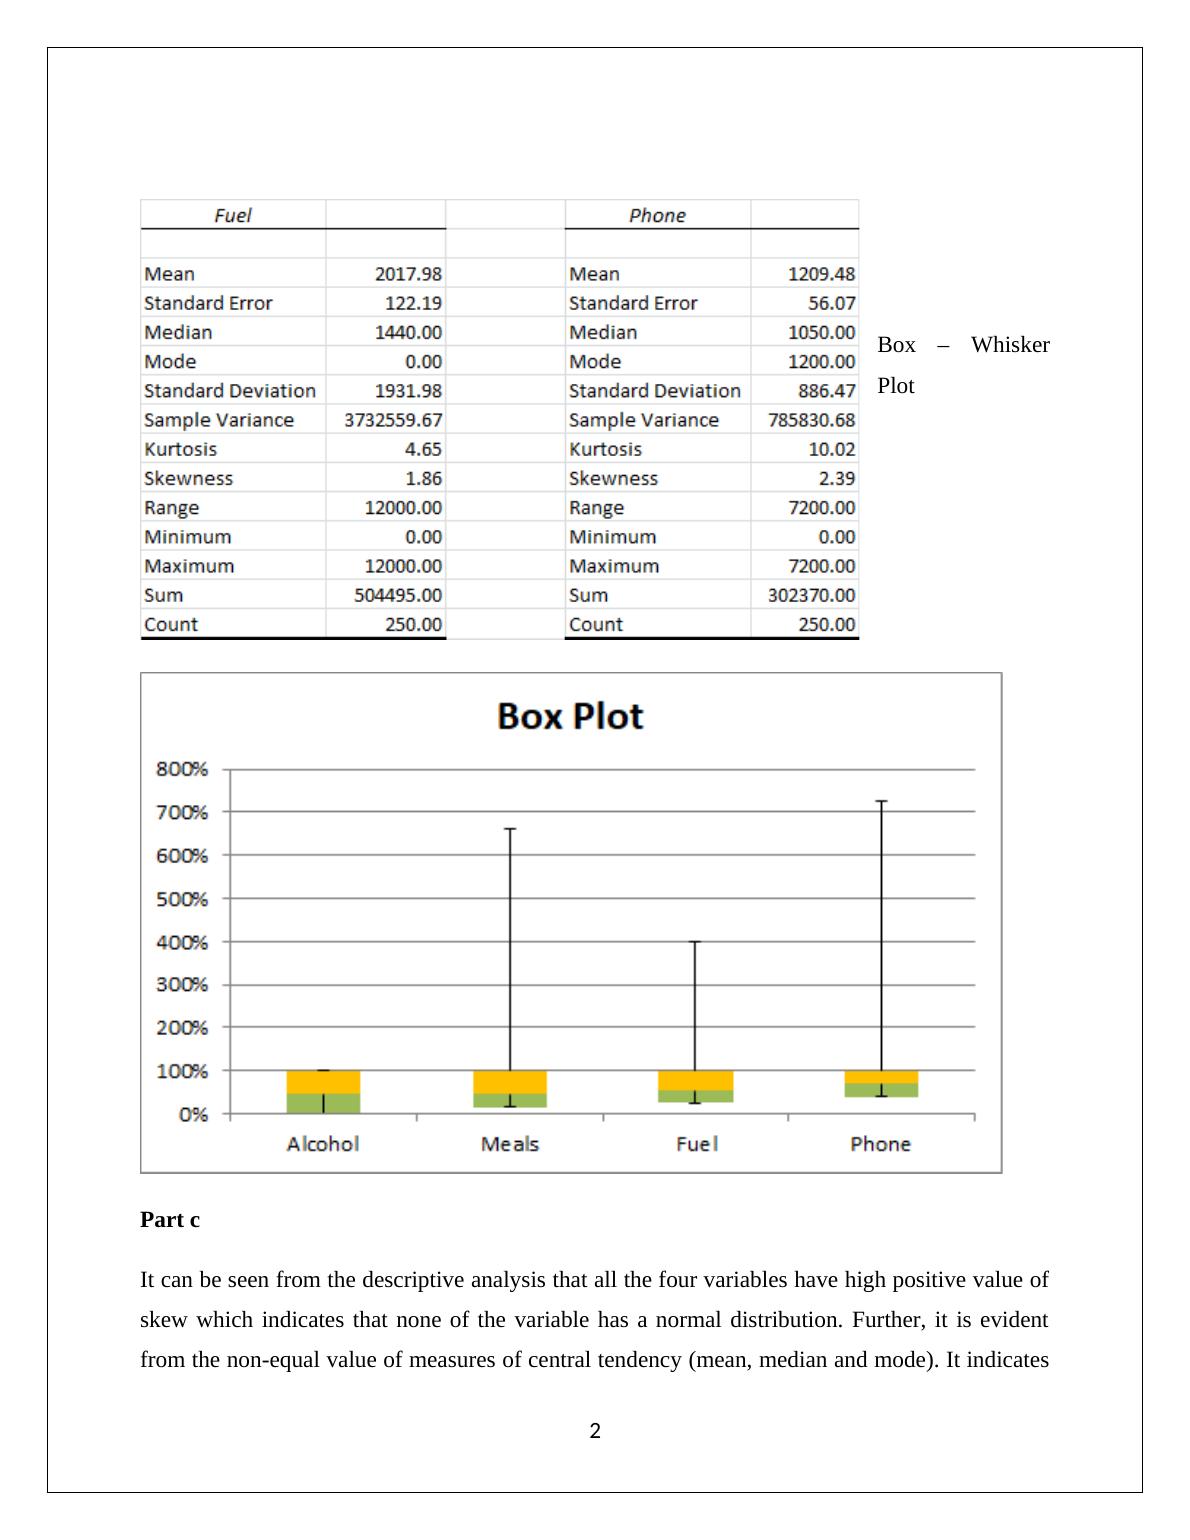
This document provides solutions to various tasks related to Statistics for Business and Finance. It includes topics such as sampling techniques, numerical summaries, frequency tables, probability distributions, correlation coefficients, contingency tables, and more. The document also includes references for further reading.
Statistics for Business and Finance - Desklib
Analyse and interpret real-world demographic data using statistical methods and Excel. Submit a report in Word and an Excel document with calculations.
Added on 2023-06-07
ShareRelated Documents
End of preview
Want to access all the pages? Upload your documents or become a member.
Statistics for Business and Finance: Analyzing Household Data
|10
|1280
|399
Analyzing Household Data for Statistics in Business and Finance
|12
|1615
|87
Household Analysis: Techniques, Findings, and Proportions
|6
|657
|323
Analyzing Household Data for Statistics in Business and Finance
|11
|1488
|471
Analyzing Household Data for Statistics in Business and Finance
|11
|1451
|171
Statistics for Business - Descriptive Statistics, Frequency Distribution, Probability Distribution, Contingency Table and Scatter Plot
|9
|1339
|404