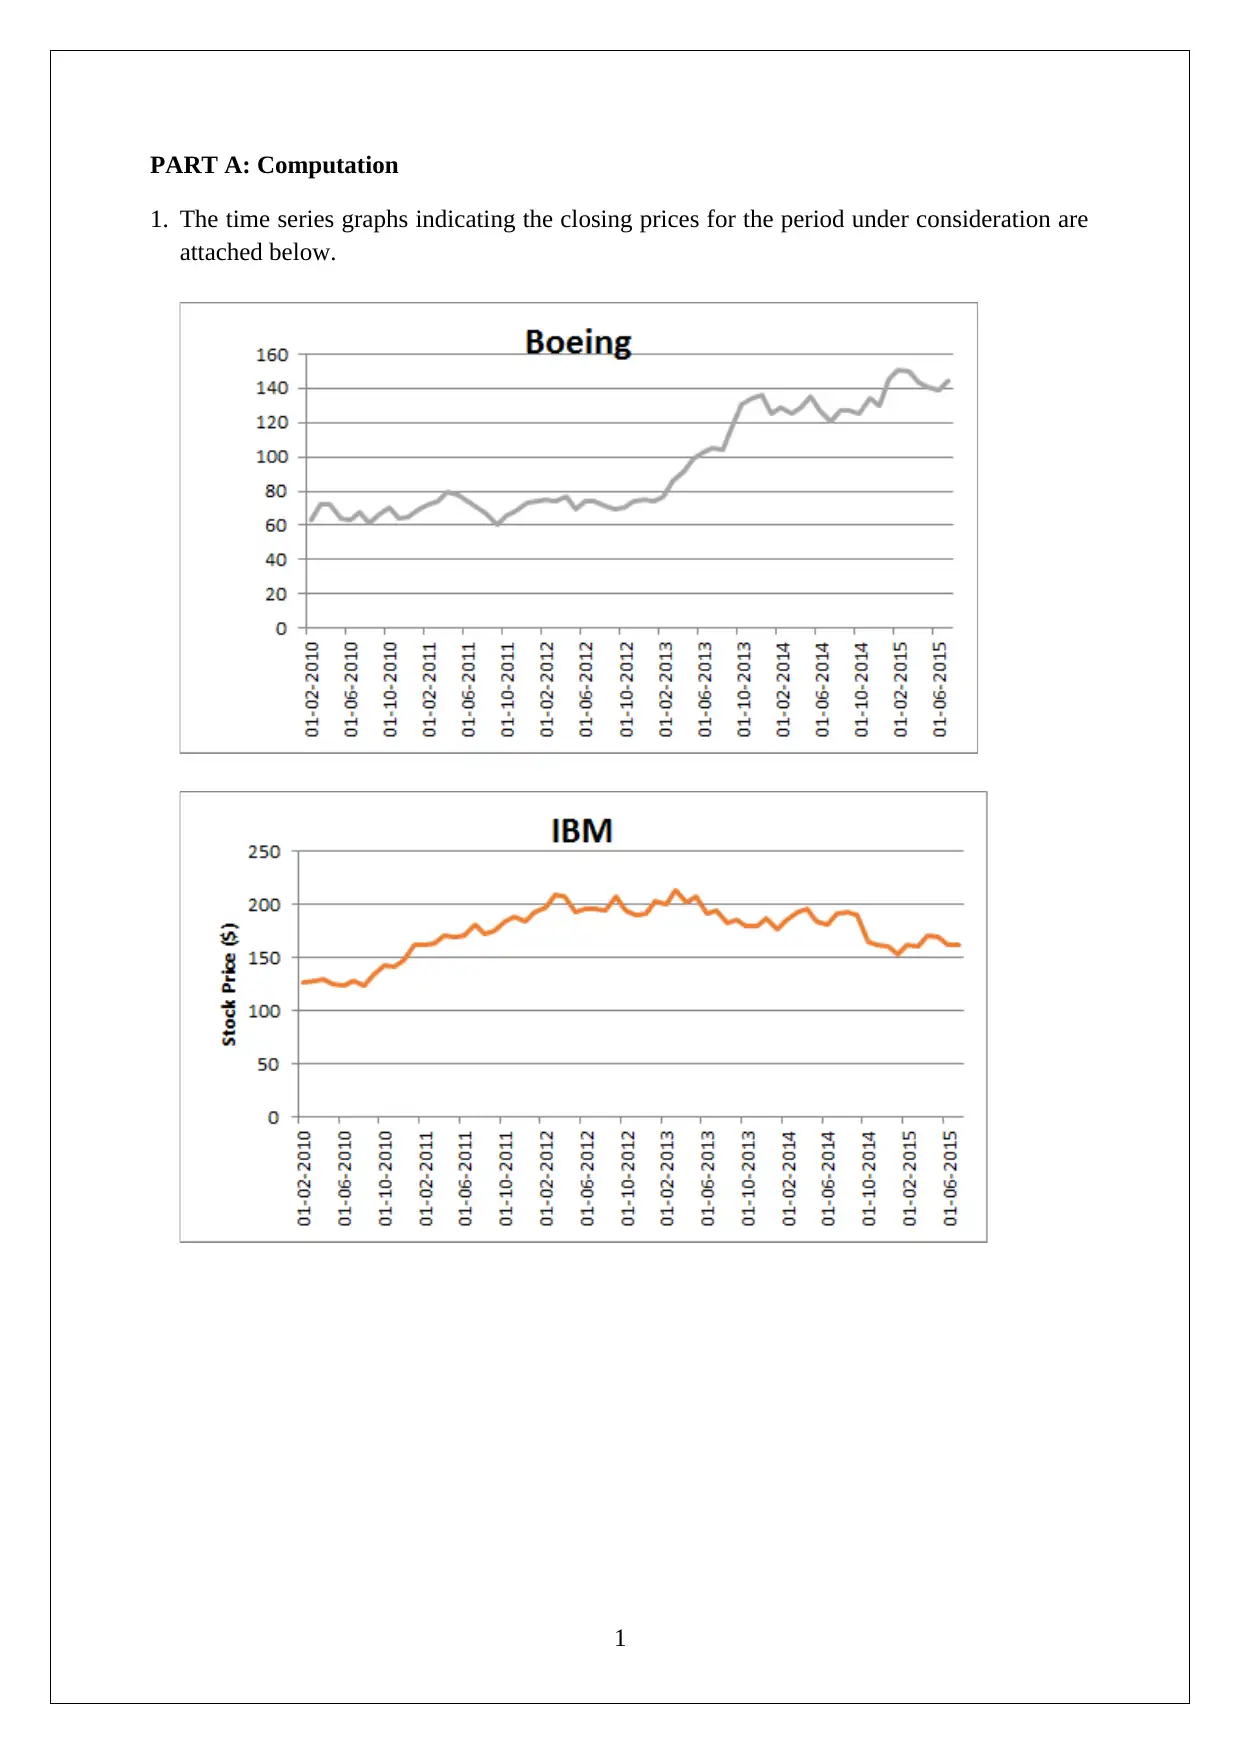
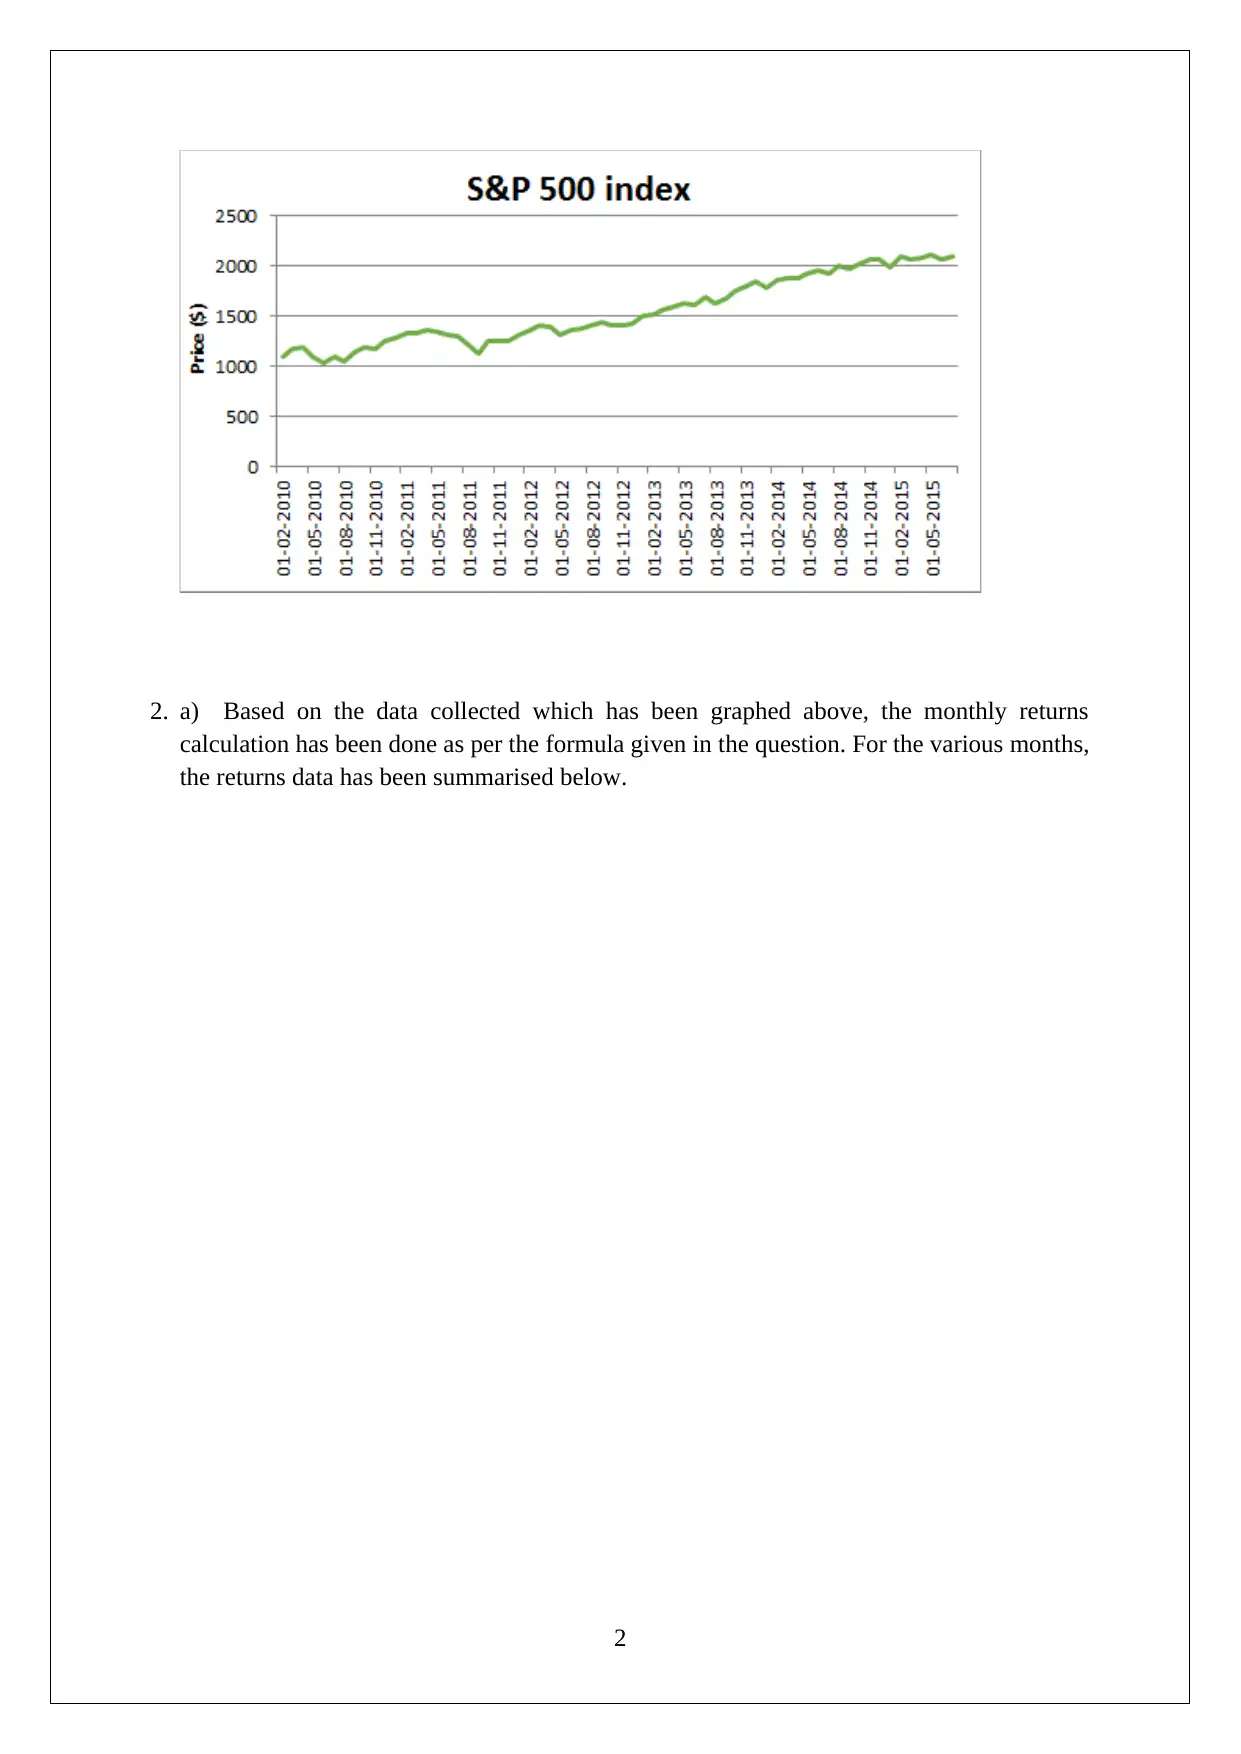
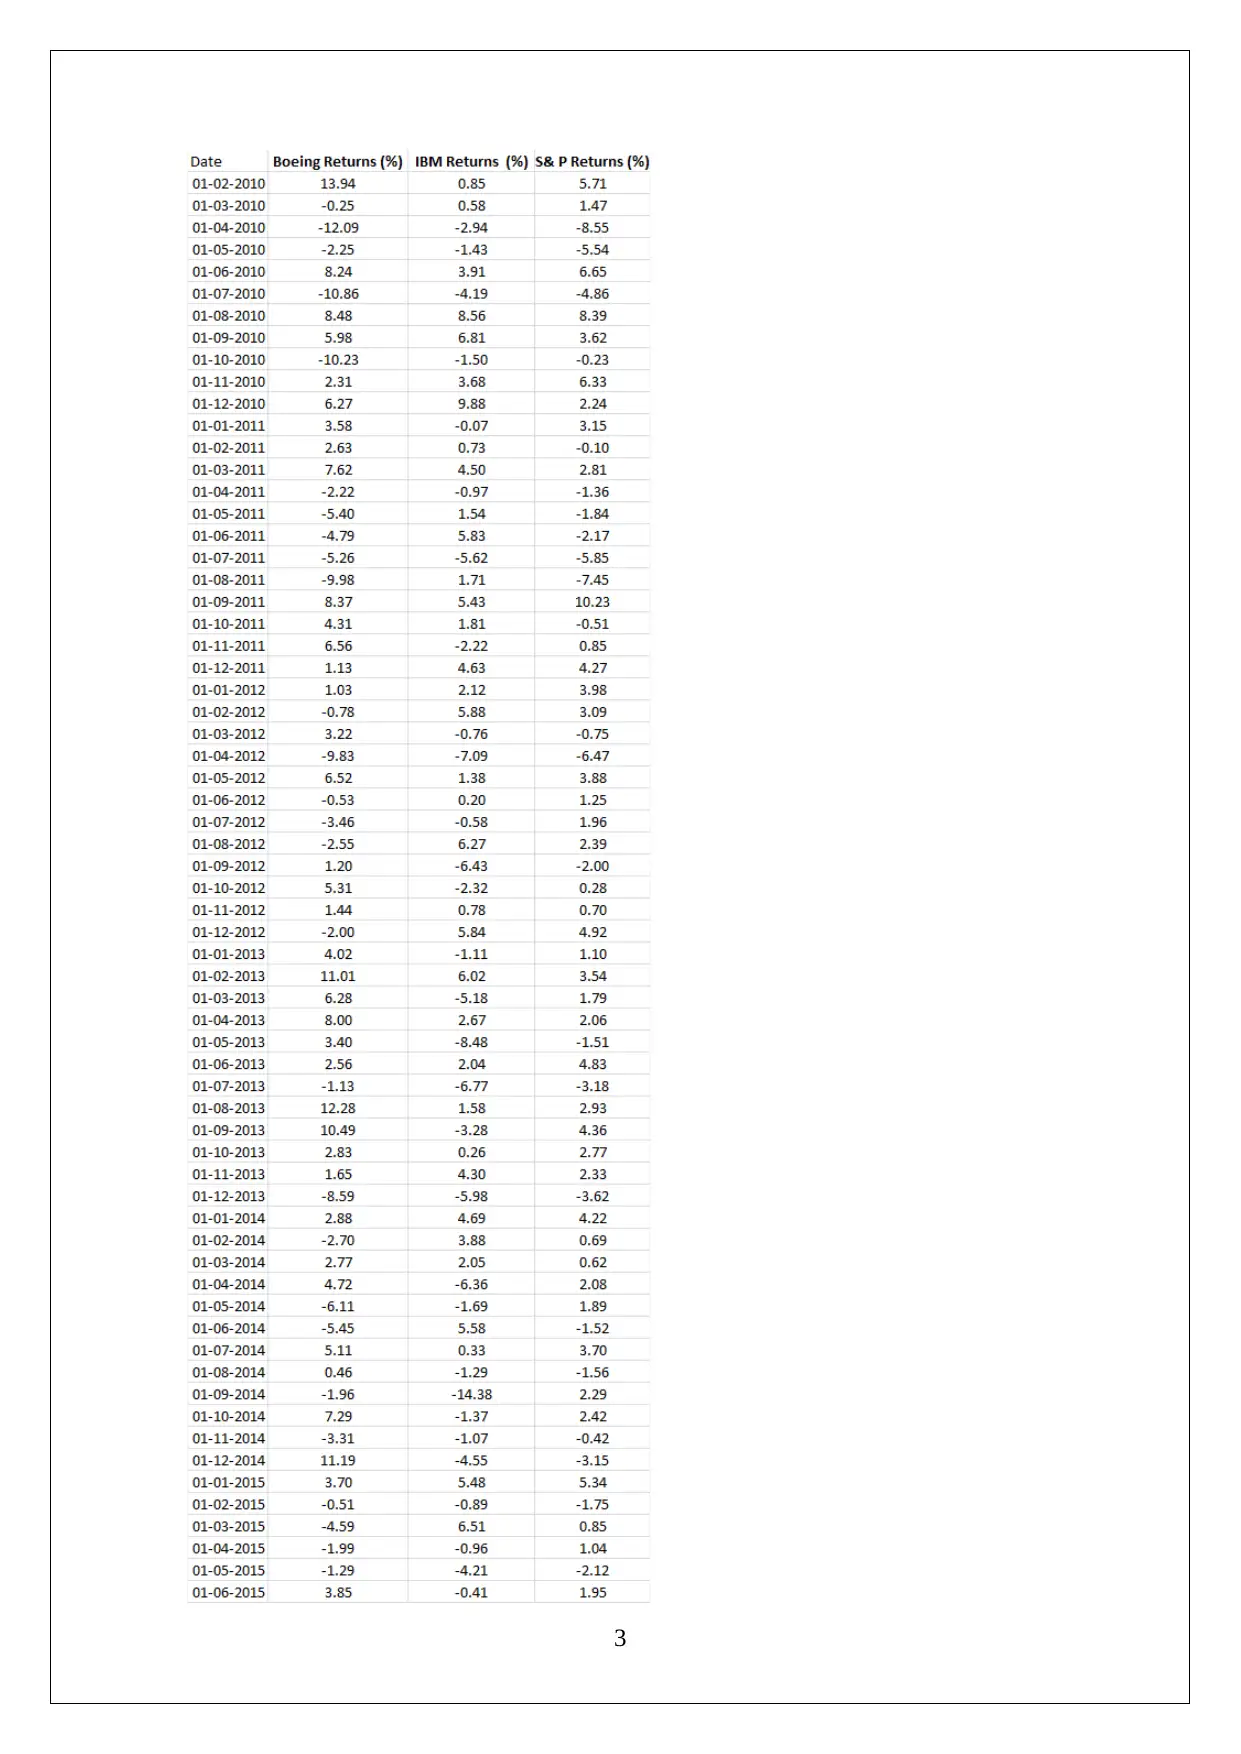
Finance and Statistics: Comparative Analysis of IBM and Boeing Stocks

Verified

Added on  2020/05/11

|13
|1706
|214
Homework Assignment
AI Summary
This homework assignment presents a comprehensive statistical analysis of IBM and Boeing stocks, encompassing various aspects of financial analysis. The student calculates monthly returns, performs hypothesis tests to assess the normality of return distributions, and compares the risks and returns of the two stocks using sample statistics. The assignment also includes the application of the CAPM model, calculation of the coefficient of determination, and construction of a 95% confidence interval for the beta of IBM stock. Furthermore, the student interprets stock price trends, evaluates the importance of normality testing, and provides insights into the relationship between IBM stock and the S&P 500 index. The analysis involves the use of T-tests, F-tests, and the interpretation of residual plots to validate the assumptions of the regression model. The conclusion highlights that while both stocks offer similar returns, IBM is the less risky option for investors.
Document Page
STATISTICS FOR BUSINESS & FINANCE
[Type the document subtitle]
STUDENT ID
[Pick the date]
tabler-icon-diamond-filled.svg

Paraphrase This Document

Need a fresh take? Get an instant paraphrase of this document with our AI Paraphraser
Document Page
PART A: Computation
1. The time series graphs indicating the closing prices for the period under consideration are
attached below.
1
Document Page
2. a) Based on the data collected which has been graphed above, the monthly returns
calculation has been done as per the formula given in the question. For the various months,
the returns data has been summarised below.
2
Document Page
3
tabler-icon-diamond-filled.svg

Paraphrase This Document

Need a fresh take? Get an instant paraphrase of this document with our AI Paraphraser
Document Page
2. b) Stock Monthly Returns (Sample Statistics)
2. c) Normal Distribution (Hypothesis test)
Ho: Based on the skew and kurtosis, the distribution concerned does not significantly deviate
from a normal distribution.
H1: Based on the skew and kurtosis, the distribution concerned does significantly deviate
from a normal distribution.
The hypothesis outlined above is to be put to test for the three distributions.
Calculation
The relevant statistic used for testing is JB statistic with the relevant formula given below.
Using the formula listed above and feeding the respective values drawn from the summary
statistics, the relevant computation is performed and results given below.
In case of the above distributions, the significant observation is that the concerned critical
value of JB statistic stands at 32.30 and hence the values computed for every distribution fail
to exceed the same. Thus, a Ho rejection cannot be enabled and hence acceptance of H1 is not
4
Document Page
permitted. Hence, with a probability of 0.95, it may be concluded that the concerned return
distributions obey a normal distribution approximately.
3. The relevant hypothesis to be tested is outlined as follows.
The appropriate statistic for testing the hypothesis ought to be T even though the observations
available are exceeding 30. This is because for the usage of z, a critical condition is that
population standard deviation must be known which is not fulfilled here.
Based on the relevant input information, the T statistic calculation is done below.
Considering the alternative hypothesis, it becomes evident that the rejection period would be
expected on the higher end while the test statistic value is located on the lower end. Hence,
the given computation would not result in potential rejection of H0. This clearly implies that
the claim regarding the Boeing stock in respect of atleast 3% monthly return lacks statistical
evidence and hence cannot be assumed to be true based on the available data.
4. The relevant hypothesis to be tested is outlined as follows.
The risk of the two stocks needs to be compared. This in effect implies that variance
comparison of two samples is to be performed. The test which facilitates the same is known
as F test and have been performed on the given data leading to the following output.
5
Document Page
In accordance with the approach involving p value, there needs to be comparison of the two
tail p value with significance level.
Two tail p value (0.034) < Significance Level (0.05)
The above observation implies that the statistical evidence leads to H0 rejection and
acceptance of H1. Hence, it may be highlighted to the investor that IBM and Boeing cannot
be assumed to have similar or comparable risks. Further, considering the absolute values,
IBM seems to be the less risky stock.
5. The relevant hypothesis to be tested is outlined as follows.
Considering the absence of data pertaining to population standard deviation, T test seems to
be most optimum choice for means comparison. However, for facilitating the same through
excel, one needs to choose between the suitable variance choices. For the given case, the
unequal variance would be selected as the hypothesis testing involving the variance clearly
highlights the difference between the two. The test output obtained from MS-Excel is as
shown below.
6
tabler-icon-diamond-filled.svg

Paraphrase This Document

Need a fresh take? Get an instant paraphrase of this document with our AI Paraphraser
Document Page
In accordance with the approach involving p value, there needs to be comparison of the two
tail p value with significance level.
Two tail p value (0.337)> Significance Level (0.05)
The above observation implies that the statistical evidence does not lead to H0 rejection and
acceptance of H1. Hence, it may be highlighted to the investor that IBM and Boeing can be
assumed to have similar or comparable returns.
6) The comparison of stock is facilitated by comparing the risk return features collectively
and not in isolation. For the given two stocks, using the sample information, attempt has been
made to comment on the population parameters associated with risk and return. The result of
this process highlights that difference of statistical importance is observed in terms of risk
only while the return is essentially the same. Thus, if returns are the same, then the stock with
lower risk would be a better choice for the investors. This choice is IBM for the investors as
it is less risky. The excess returns are attached below using the 10 year treasury rates.
7
Document Page
8
Document Page
7)a) CAPM Model
c) Coefficient of Determination = 0.2697
d) 95% confidence interval (IBM Beta) = (0.369, 0.891).
8) The requisite hypothesis to be tested is outlined below.
H0: βIBM =1
H1: βIBM ≠1
The confidence interval approach requires decision to be taken on the basis of the intersection
of the hypothesized value and the 95% confidence interval already determined. If intersection
does exist, then available evidence not enough for H0 rejection or else H0 would be rejected.
The pre-determined confidence level in the given case is (0.369, 0.891).Also, the
hypothesized value is 1 and there is no intersection which implies rejection of H0. Thus, it can
be concluded that IBM can be assumed as a neutral stock.
9) Normality of Residual Plots
9
tabler-icon-diamond-filled.svg

Paraphrase This Document

Need a fresh take? Get an instant paraphrase of this document with our AI Paraphraser
Document Page
.
10
Document Page
Part B: Interpretation
1) Boeing Stock – The stock during the initial period (i.e. February 2010 – February 2013) is
essentially trading within a narrow price band. However, a breakout is observed around
March 2013 which takes the stock to $ 140 by February 2014. Post this aggressive
uptrend, the stock has consolidated so as to prepare for the next upmove.
IBM Stock – The stock during the initial period (i.e. February 2010 – February 2012) saw
an uptrend with a capital appreciation in excess of 55%. Post this aggressive trend,
consolidation was observed in stock for almost a year after which the stock started
moving down and by the end of the period had exhausted almost all profits made earlier
during the period.
S&P 500 – For the initial year or so (till November 2011), sideways movement was
visible in the index. However, since then the index enjoyed a continuous upmove which
was observed till May 2015 as the 2000 level was also breached. Post this, the index
observed some consolidation.
2) b) Based on the sample descriptive statistics, the higher returns have been recorded for
Boeing. But, Boeing has delivered this at the cost of higher risk. This is apparent from the
higher standard deviation of returns observed for Boeing in comparison with IBM. Thus,
the stock with higher risk is Boeing.
c) The importance of normality testing can be learnt from the role that normality plays in
hypothesis testing. A number of tests that are applied have a tacit assumption regarding
the normality of the sample or the population. Hypothesis testing is significant for an
investor so that conclusions can be drawn from limited sample. Further, the accuracy of
this procedure is imperative so that investor can undertake prudent decisions.
5) The hypothesis testing based on sample data has been conducted for comparing the
underlying risk and return associated with the two stocks. This reflects that no significant
difference is observed for average returns but the risk associated has been found to be
significantly different. The numerical values in this context clearly reflect that the lower risk
is indicated by IBM. Hence, it would be the preferred stock as it delivers equal returns in
comparison to Boeing but at lower risk.
11
Document Page
7) b) The slope coefficient or beta for the stock is 0.63. The first observation is regarding the
nature of stock which would be termed as defensive. Therefore, the respective movement
expected in the IBM stock would be lesser in comparison with the broader market or S&P
500 index. A increase in the S&P 500 index by 1% should produce a corresponding increase
in IBM stock to the rune of 0.63%.
c) The coefficient of determination indicates that beta does not ably capture the overall risk
associated with the IBM stock. This is established from the fact that the market index is
successful in explaining only 27% of the IBM stock movement. To explain the remaining,
63%, it seems pivotal that more variables would need to be inserted based on the empirical
evidence and literature review in this regards.
d) The confidence interval identified implies that there is a 95% chance for the beta of the
IBM stock to assume a value lying in the interval (0.369, 0.891).
9) For the regression model, the residual plot against X (independent variable) has been
plotted. It is apparent that the various entries in this plot are randomly distributed with no
particular pattern in terms of variance that may be observed. The absence of any pattern
confirms the compliance of the normality of error term assumption.
.
12
chevron_up_icon
1 out of 13
circle_padding
hide_on_mobile
zoom_out_icon
[object Object]