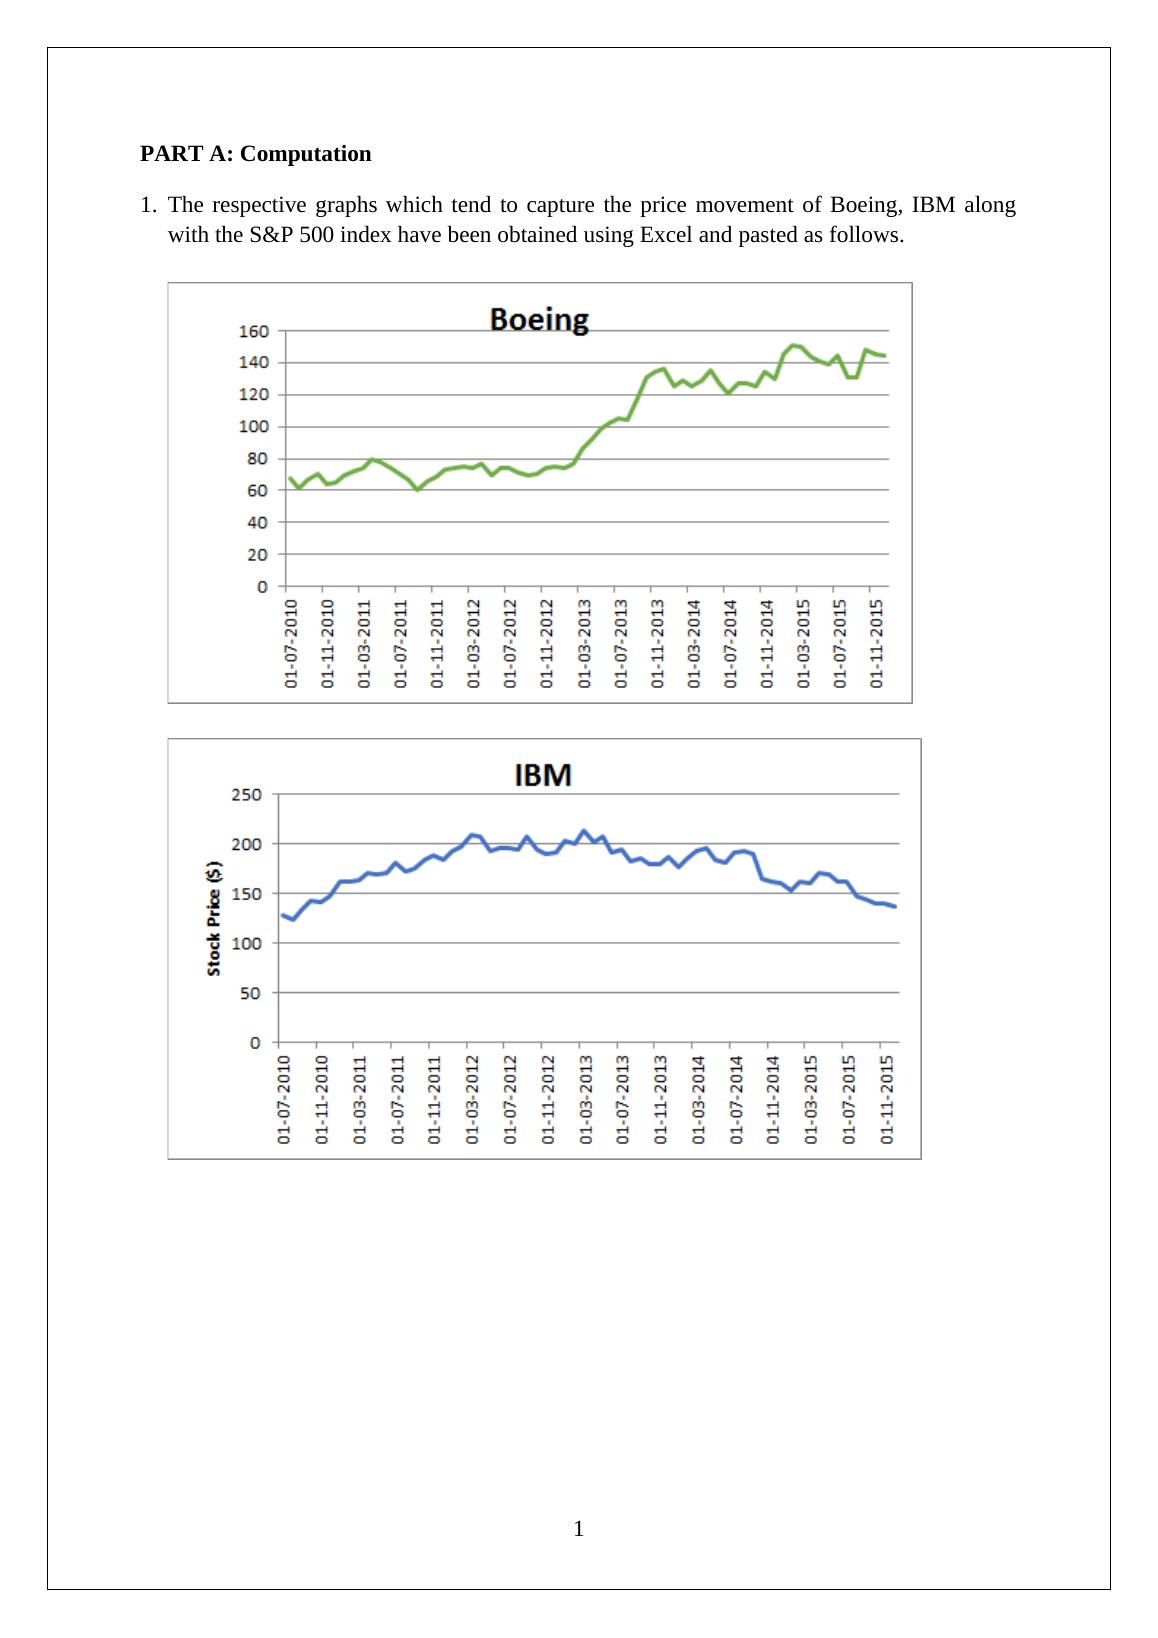
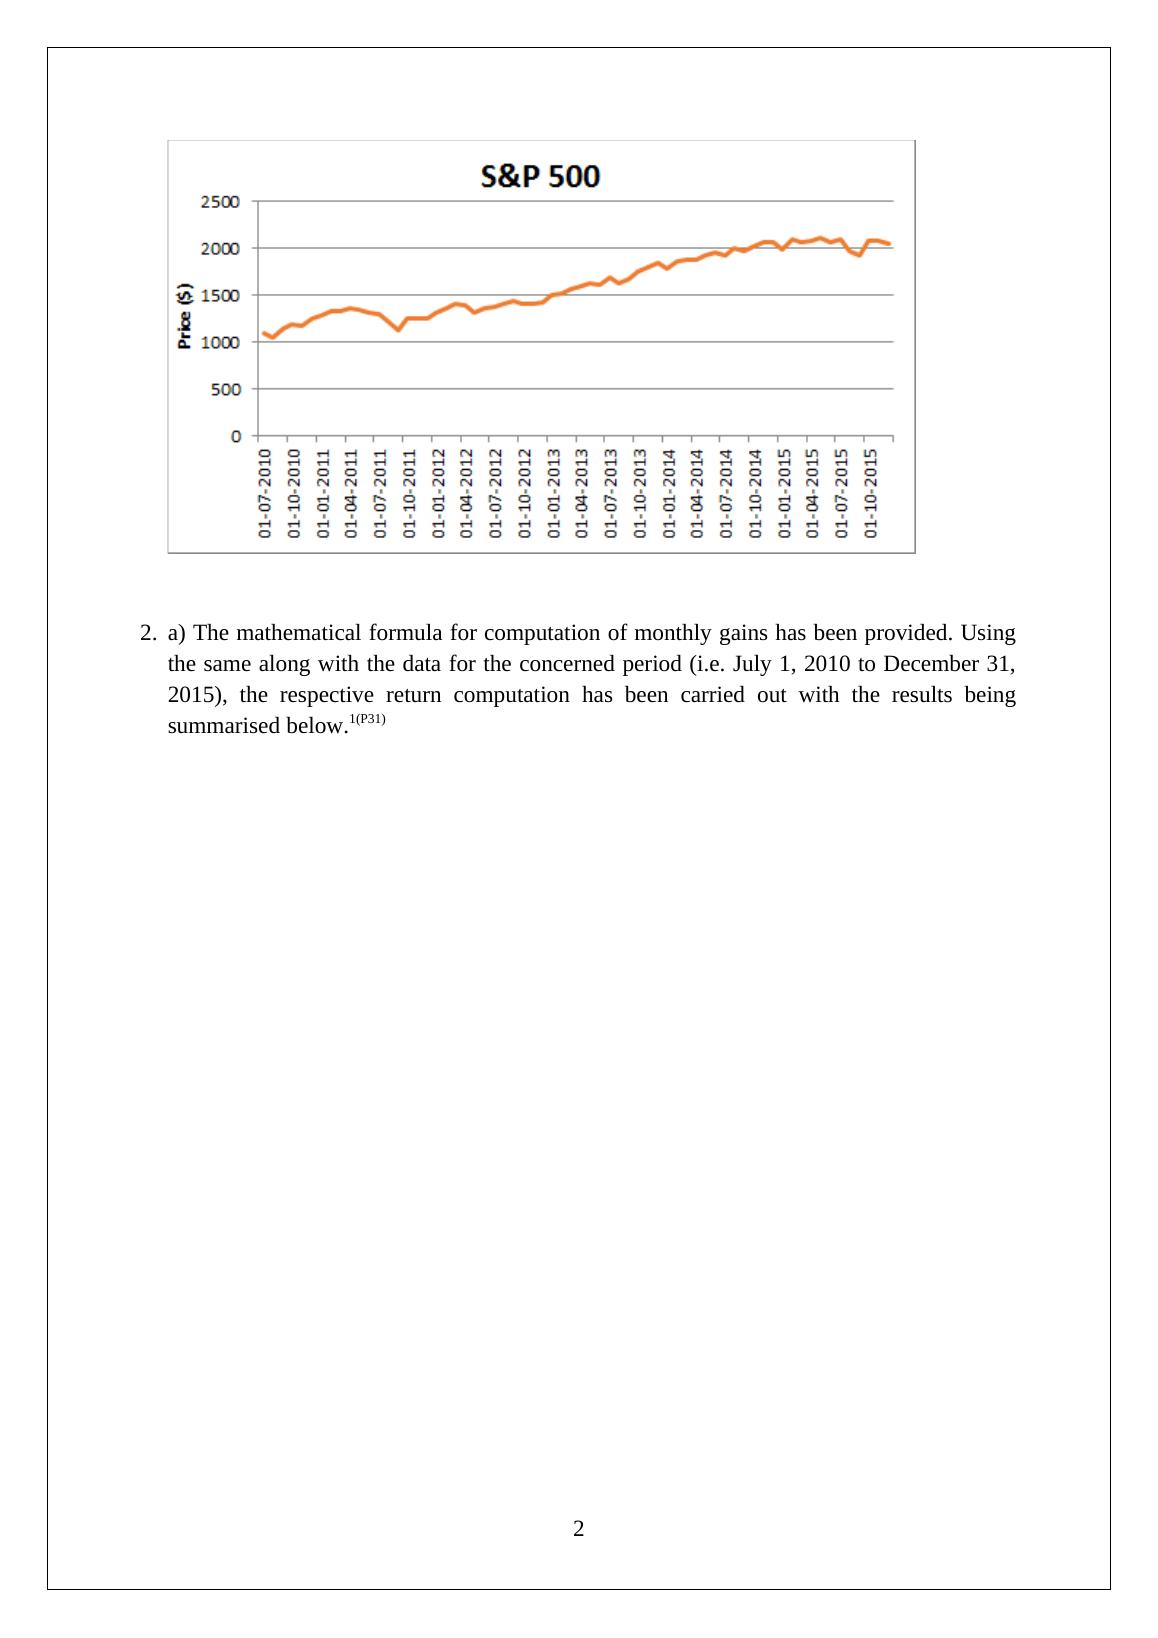
Statistics for Business & Financial Economics
14 Pages1904 Words30 Views
Added on 2020-03-28
Statistics for Business & Financial Economics
Added on 2020-03-28
ShareRelated Documents
End of preview
Want to access all the pages? Upload your documents or become a member.
Statistics for business and finance : assignment
|12
|1433
|146
Statistics for Business and Finance PDF
|13
|1681
|62
Study on Statistics for Business & Finance
|13
|1441
|182
Statistics for Business & Finance
|12
|1694
|33
BUS5SBF - Statistics for Business and Finance, Assignment
|13
|1717
|33
Statistics for Business and Finance - Hypothesis Testing, CAPM Model and Regression Analysis
|10
|1170
|212