Correlation Analysis of Food Preferences in STAT 1202
VerifiedAdded on 2023/01/18
|4
|666
|80
Homework Assignment
AI Summary
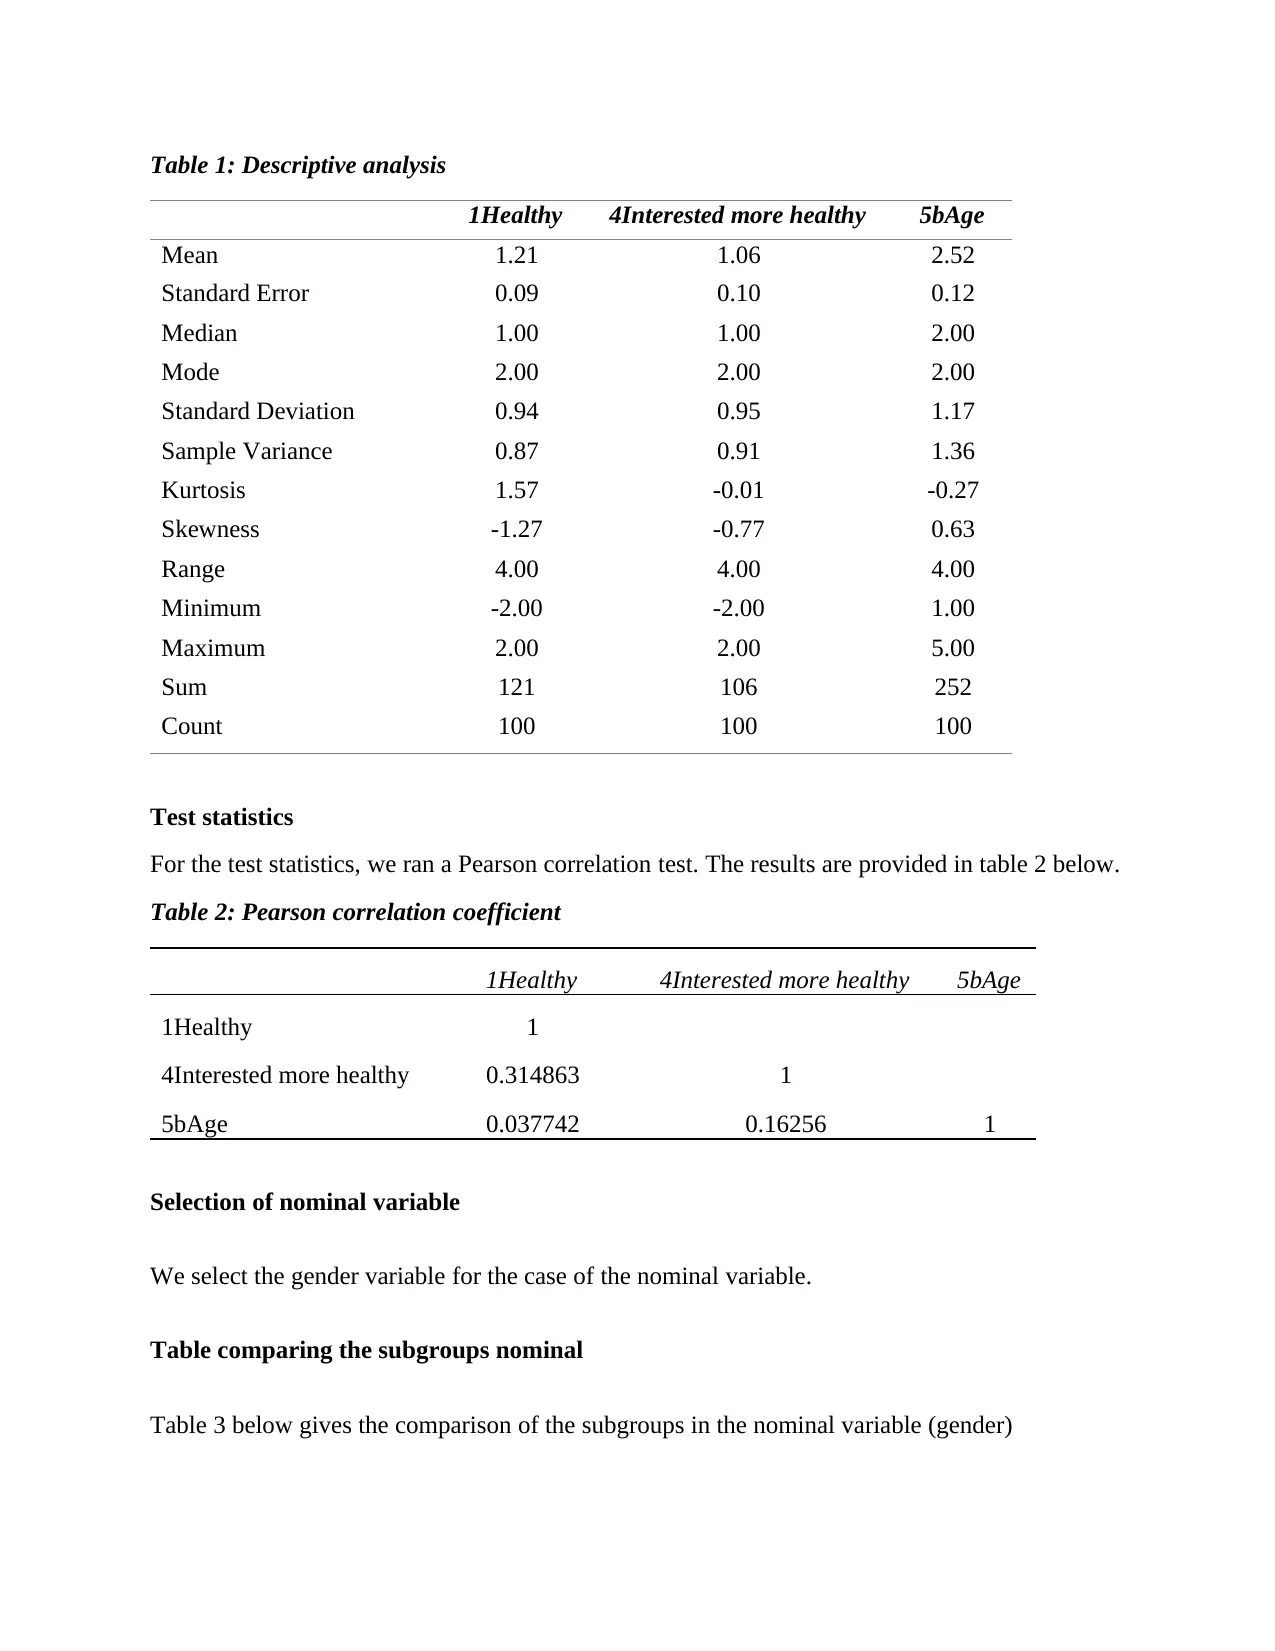
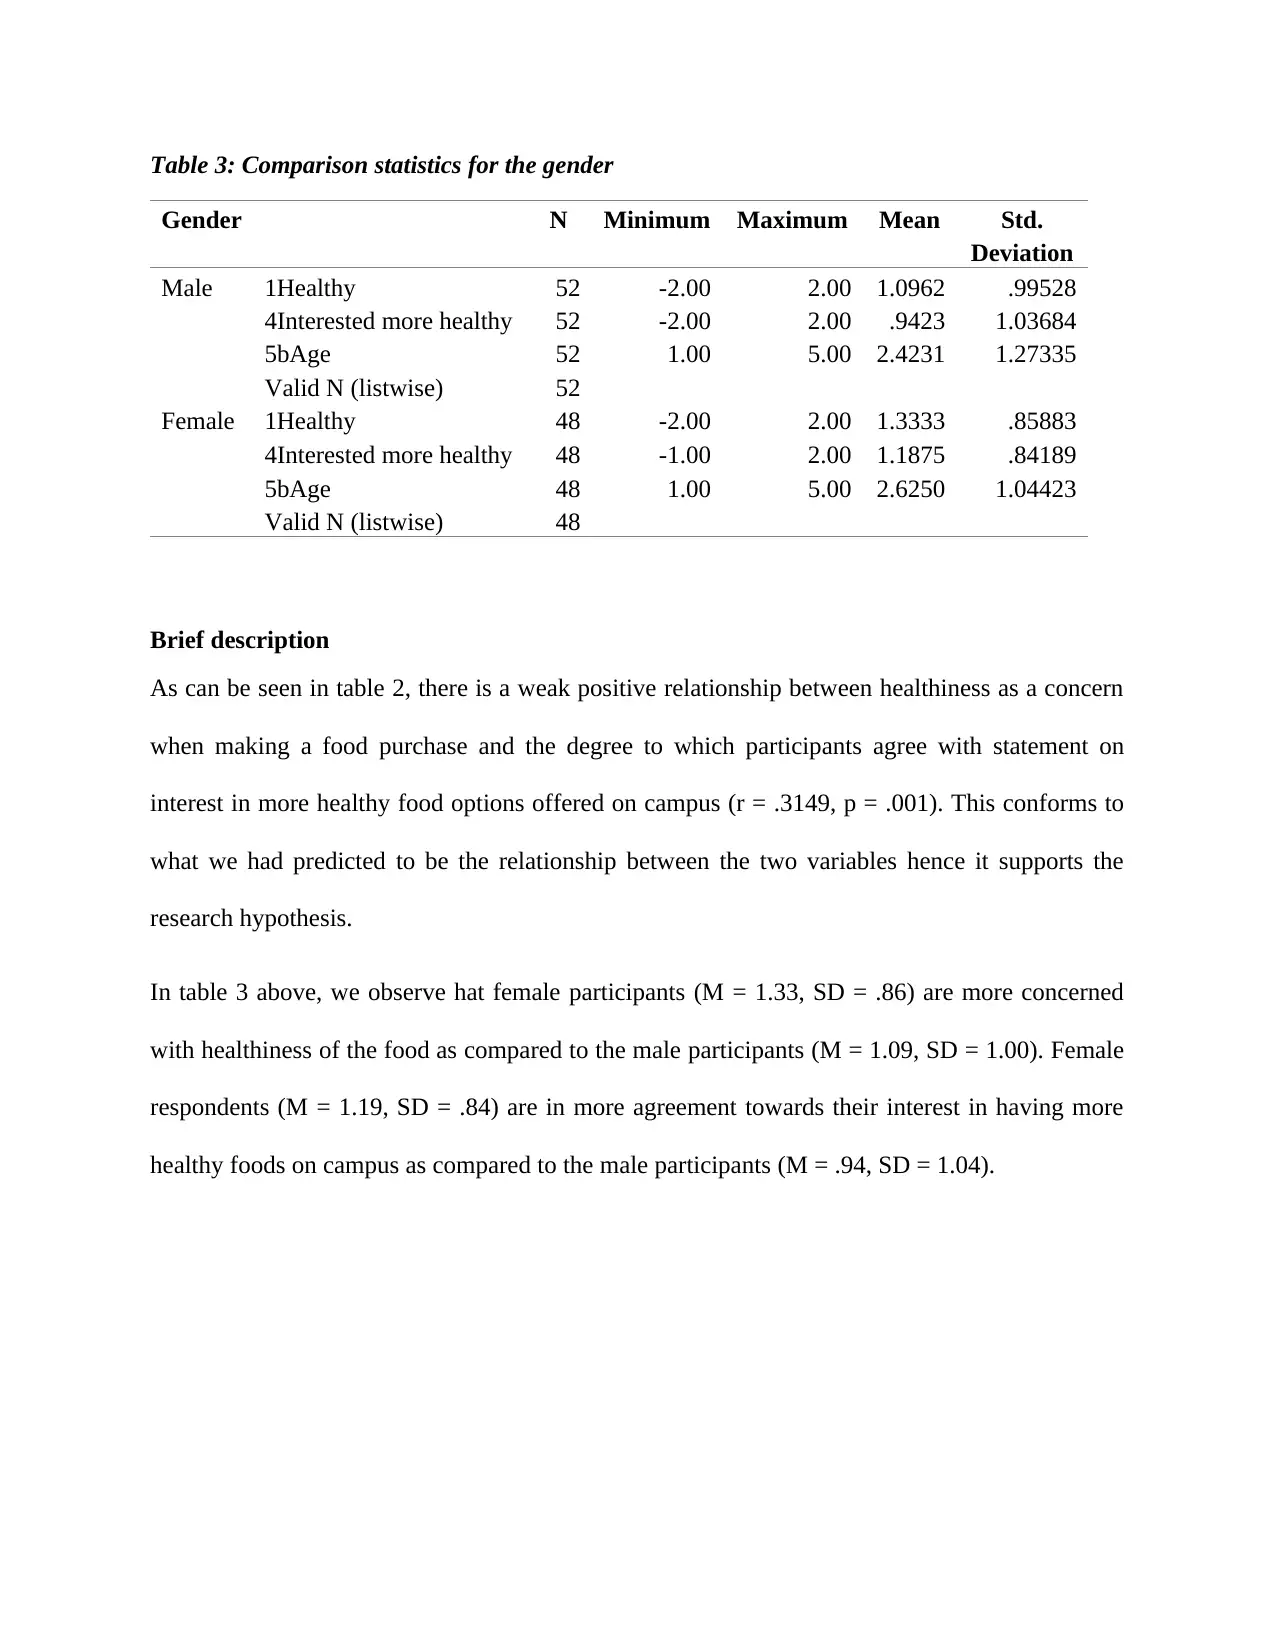
This document presents a solution to a statistics assignment focused on correlation analysis. The assignment investigates the relationship between healthiness as a concern when making food purchases and the level of interest in more healthy food options offered on campus. The analysis begins with formulating a research hypothesis, followed by the calculation of descriptive statistics (mean, median, mode, skewness) for the variables: healthiness, interest in healthy food, and age. A Pearson correlation test is conducted to determine the strength and direction of the relationship between healthiness and interest in healthy food options, revealing a weak positive correlation. Additionally, the solution includes a comparison of subgroups based on gender, highlighting differences in healthiness concerns and interest in healthy foods between male and female participants. The findings support the research hypothesis, indicating a positive association between the variables. The analysis is supported by tables presenting descriptive statistics and correlation coefficients.
1 out of 4
Your All-in-One AI-Powered Toolkit for Academic Success.
+13062052269
info@desklib.com
Available 24*7 on WhatsApp / Email
![[object Object]](/_next/static/media/star-bottom.7253800d.svg)
Copyright © 2020–2026 A2Z Services. All Rights Reserved. Developed and managed by ZUCOL.