ECON 940 - Statistics for Decision Making: Customer Segment Analysis
VerifiedAdded on 2023/06/10
|27
|5381
|291
Report
AI Summary
This report presents a customer segment analysis of luxury car brands (BMW, Mercedes, and Lexus) using statistical methods to aid the Automobile Association in refining business strategies. The analysis uses factors such as age, annual income, and education to profile customers and determine their car preferences. Descriptive and inferential statistics were employed, revealing significant differences in car preference related to age, income, and education levels. The findings indicate that older, higher-income, and more educated individuals tend to prefer Mercedes over BMW. Additionally, the odds of owning a Mercedes increase with age compared to owning a Lexus or BMW. Hypothesis testing using ANOVA confirmed statistically significant differences among car owner groups based on age, income, and education.
Running head: STATISTICS FOR DECISION MAKING
Statistics for Decision Making
Name of Student
Name of University
Author Note
Statistics for Decision Making
Name of Student
Name of University
Author Note
Paraphrase This Document
Need a fresh take? Get an instant paraphrase of this document with our AI Paraphraser
2STATISTICS FOR DECISION MAKING
Executive Summary
Demand for a particular good may depend on a number of factors. Statistical analysis aids to
study the available purchase data and customer attributes to identify market segments to better
the marketing strategy so that the profits, sales, production and promotion can be customized to
attain target outcomes. This paper discusses results of a customer segment analysis of the luxury
cars BMW, Mercedes and Lexus on behalf of the Automobile Association to aid businesses in
their business plans. Factors such as age, annual income and education were taken to be factors
of interest in the profiling of customers. Descriptive and inferential statistics were used for the
purposes. It was seen that customers had significant differences in terms of car preference with
respect to age, income and education. Older people, people with higher income and with higher
education were seen to prefer Mercedes more than BMW. Furthermore it was seen that as age
increased the odds of the customer to own a Mercedes was greater than the odds of owning a
Lexus or BMW.
3STATISTICS FOR DECISION MAKING
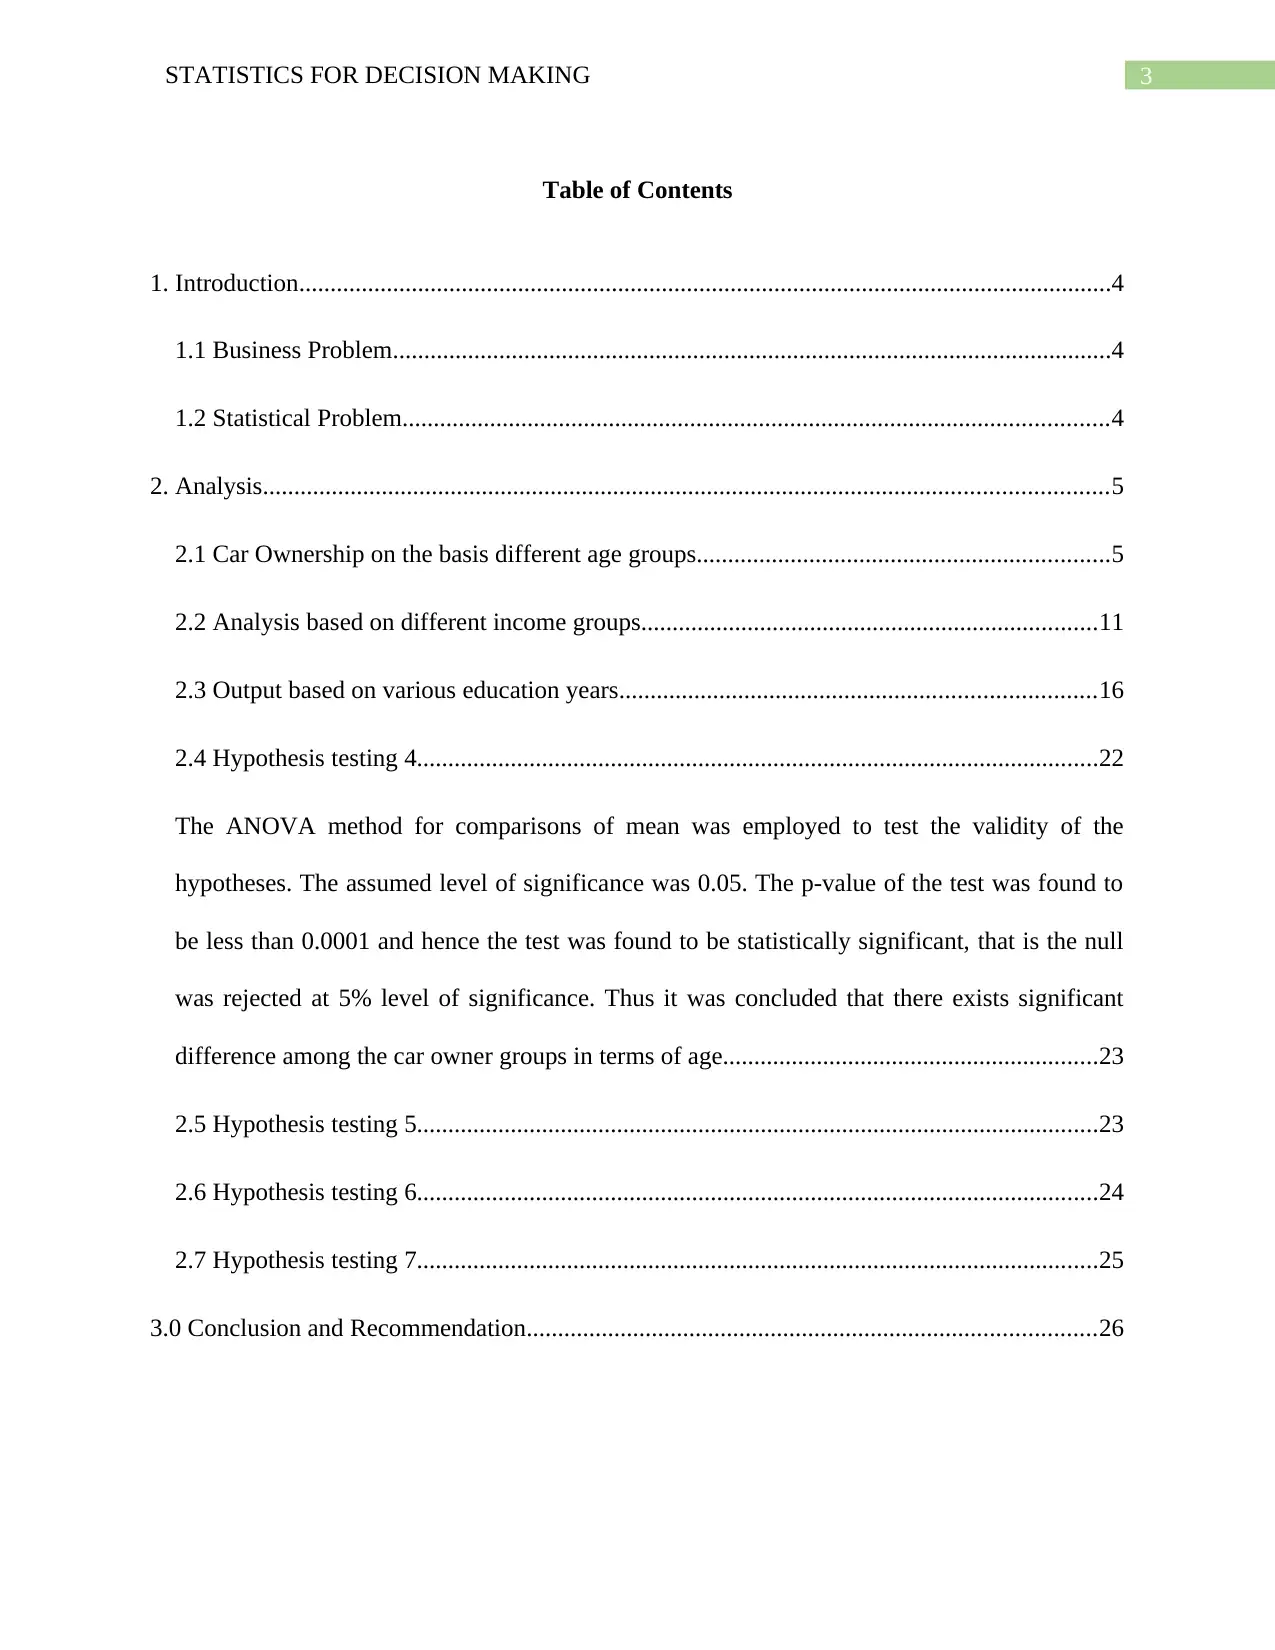
Table of Contents
1. Introduction..................................................................................................................................4
1.1 Business Problem...................................................................................................................4
1.2 Statistical Problem.................................................................................................................4
2. Analysis.......................................................................................................................................5
2.1 Car Ownership on the basis different age groups..................................................................5
2.2 Analysis based on different income groups.........................................................................11
2.3 Output based on various education years............................................................................16
2.4 Hypothesis testing 4.............................................................................................................22
The ANOVA method for comparisons of mean was employed to test the validity of the
hypotheses. The assumed level of significance was 0.05. The p-value of the test was found to
be less than 0.0001 and hence the test was found to be statistically significant, that is the null
was rejected at 5% level of significance. Thus it was concluded that there exists significant
difference among the car owner groups in terms of age............................................................23
2.5 Hypothesis testing 5.............................................................................................................23
2.6 Hypothesis testing 6.............................................................................................................24
2.7 Hypothesis testing 7.............................................................................................................25
3.0 Conclusion and Recommendation...........................................................................................26
⊘ This is a preview!⊘
Do you want full access?
Subscribe today to unlock all pages.
Trusted by 1+ million students worldwide
4STATISTICS FOR DECISION MAKING
1. Introduction
1.1 Business Problem
This paper is a report on an analysis of the sales of the three car types, namely, BMW,
Lexus and Mercedes. It seeks to identify and segment households into preference or customer
groups for the cars. The analysis was done with respect to the different ages, incomes and
educational qualification of the members of the household. The demand for the cars among the
households are analyzed in terms of these variables. Therefore the aim of this paper is to resolve
what traits to look at in terms of age of the members, economic condition and educational
qualification in a household or a customer to discern their chances of buying either BMW, Lexus
or Mercedes. The problem is thus of market segmentation for the cars. The profiles of customers
who may prefer a BMW or Lexus or Mercedes is required to be defined to help the Automobile
Association and hence the automobile businesses to narrow down business strategies.
1.2 Statistical Problem
The problem here can be approach using a data driven statistical approach, more
specifically using inferential techniques of statistics involving testing of hypothesis. The
techniques of linear models and binary regression also is found to be relevant to the statistical
problem in ways described hence. Data from 420 households including age of members, annual
income and number of years of education as well as the model of car owned were used. The data
is first summarized and explored using descriptive statistical methods. To study the variables
representing the attributes of customers on the basis of which car model preference profiles are
defined, probability distributions of age, income and number of years of education are studied for
each specific car model type owned. The location, spread and shape of these distributions were
then looked at to identify the differences and similarities. The objective behind this is to be able
Paraphrase This Document
Need a fresh take? Get an instant paraphrase of this document with our AI Paraphraser
5STATISTICS FOR DECISION MAKING
to discern whether buyers of a specific car type differ by income, age or educational qualification
or not. Following this, techniques of hypothesis testing are carried out to determine whether the
car buyer groups have statistically significant differences among each other on the basis of age,
income and education or not. Another research question addressed is whether there exists a bias
among older people to prefer Mercedes over BMW or Lexus or not.
2. Analysis
2.1 Car Ownership on the basis different age groups
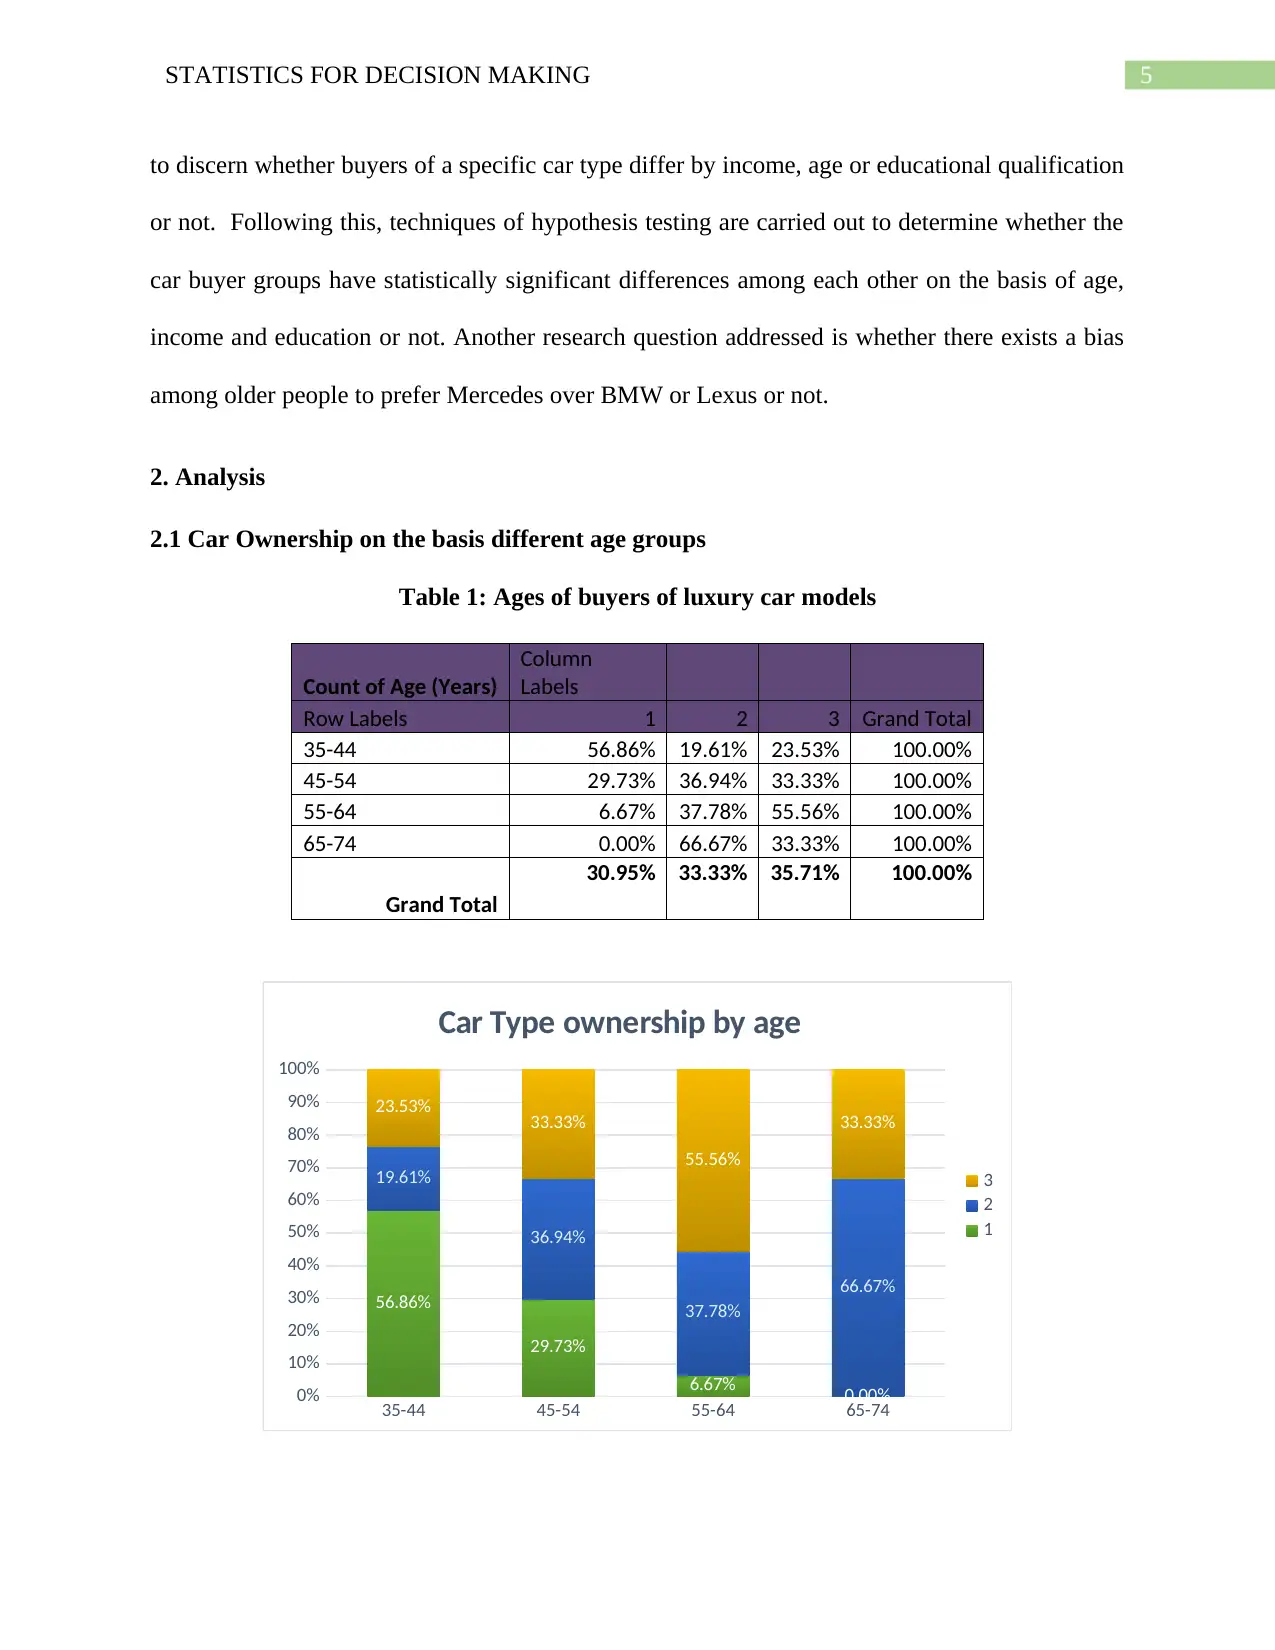
Table 1: Ages of buyers of luxury car models
Count of Age (Years)
Column
Labels
Row Labels 1 2 3 Grand Total
35-44 56.86% 19.61% 23.53% 100.00%
45-54 29.73% 36.94% 33.33% 100.00%
55-64 6.67% 37.78% 55.56% 100.00%
65-74 0.00% 66.67% 33.33% 100.00%
Grand Total
30.95% 33.33% 35.71% 100.00%
35-44 45-54 55-64 65-74
0%
10%
20%
30%
40%
50%
60%
70%
80%
90%
100%
56.86%
29.73%
6.67% 0.00%
19.61%
36.94%
37.78%
66.67%
23.53% 33.33%
55.56%
33.33%
Car Type ownership by age
3
2
1
to discern whether buyers of a specific car type differ by income, age or educational qualification
or not. Following this, techniques of hypothesis testing are carried out to determine whether the
car buyer groups have statistically significant differences among each other on the basis of age,
income and education or not. Another research question addressed is whether there exists a bias
among older people to prefer Mercedes over BMW or Lexus or not.
2. Analysis
2.1 Car Ownership on the basis different age groups
Table 1: Ages of buyers of luxury car models
Count of Age (Years)
Column
Labels
Row Labels 1 2 3 Grand Total
35-44 56.86% 19.61% 23.53% 100.00%
45-54 29.73% 36.94% 33.33% 100.00%
55-64 6.67% 37.78% 55.56% 100.00%
65-74 0.00% 66.67% 33.33% 100.00%
Grand Total
30.95% 33.33% 35.71% 100.00%
35-44 45-54 55-64 65-74
0%
10%
20%
30%
40%
50%
60%
70%
80%
90%
100%
56.86%
29.73%
6.67% 0.00%
19.61%
36.94%
37.78%
66.67%
23.53% 33.33%
55.56%
33.33%
Car Type ownership by age
3
2
1
6STATISTICS FOR DECISION MAKING
Figure 1: Ages of buyers of different luxury cars
The ages divided into four age groups, ranging from 35 as minimum age to 70 as
maximum age are considered with each group interval having length of 10 years each. 56.83% of
the owners in age group 33 to 44 years were found to be BMW owners. 29.73% of the owners in
the age group 45 to 54 years were found to be BMW owners, 6.67% were in the age group 55 to
64 years were found to have BMW and no BMW owners were found to be in the age group
above 65 years. 19.61 % of the owners in the age group 35 to 44 years, 36.94 % in the age group
45 to 54 years, 37.78% in the age group 55 to 64 years and 66.67% in the age group above 65
years were found to own Lexus model cars. 23.53% of owners aged between 35 to 44 years
owned Mercedes, 33.33% aged between 45 to 54 years were found to own Mercedes and 55.56%
were in age group 55 to 64 years. 33.33% of owner in age group above 65 years owned
Mercedes. Therefore owners in age group 65 to 74 primarily owned Lexus followed by
Mercedes. Those in age group 55 to 64 years mostly owned Mercedes followed by Lexus. The
owners aged 35 to 44 years owned mostly BMW followed by Mercedes and then Lexus.
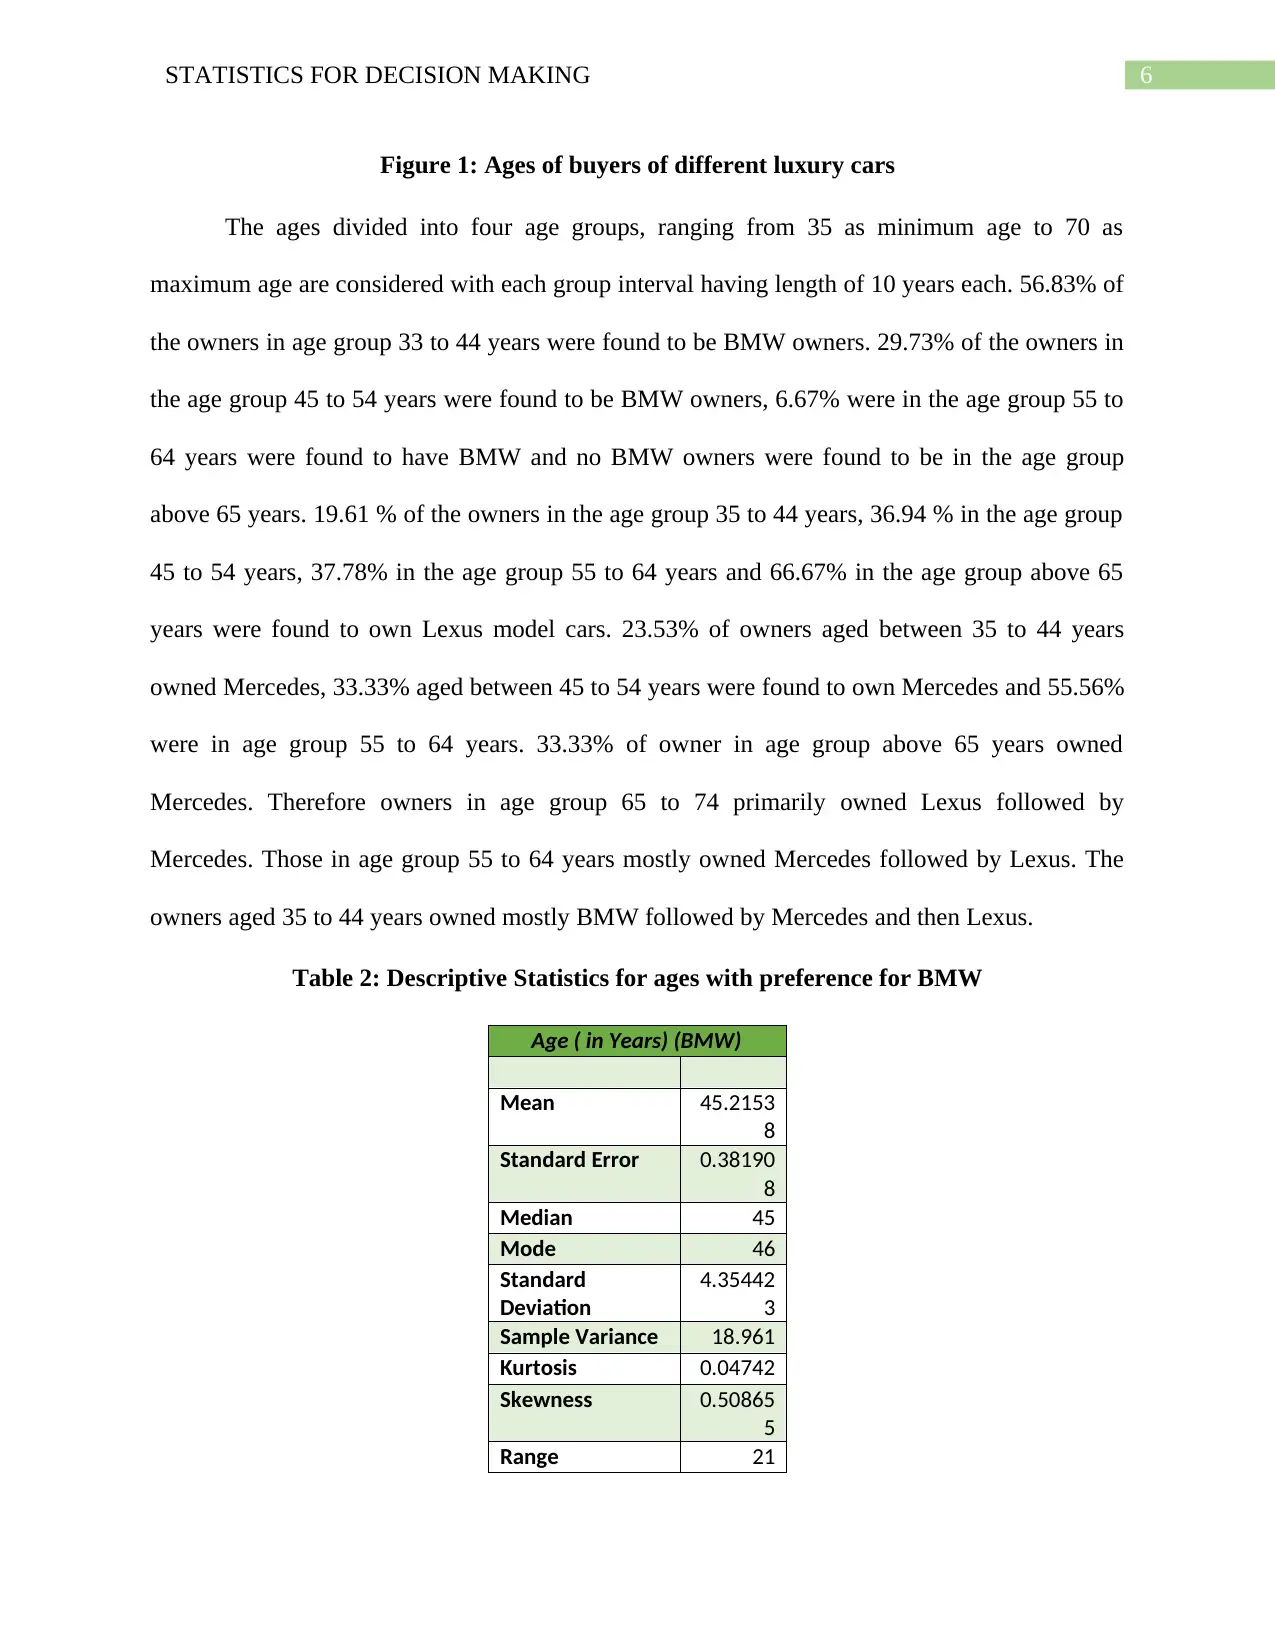
Table 2: Descriptive Statistics for ages with preference for BMW
Age ( in Years) (BMW)
Mean 45.2153
8
Standard Error 0.38190
8
Median 45
Mode 46
Standard
Deviation
4.35442
3
Sample Variance 18.961
Kurtosis 0.04742
Skewness 0.50865
5
Range 21
Figure 1: Ages of buyers of different luxury cars
The ages divided into four age groups, ranging from 35 as minimum age to 70 as
maximum age are considered with each group interval having length of 10 years each. 56.83% of
the owners in age group 33 to 44 years were found to be BMW owners. 29.73% of the owners in
the age group 45 to 54 years were found to be BMW owners, 6.67% were in the age group 55 to
64 years were found to have BMW and no BMW owners were found to be in the age group
above 65 years. 19.61 % of the owners in the age group 35 to 44 years, 36.94 % in the age group
45 to 54 years, 37.78% in the age group 55 to 64 years and 66.67% in the age group above 65
years were found to own Lexus model cars. 23.53% of owners aged between 35 to 44 years
owned Mercedes, 33.33% aged between 45 to 54 years were found to own Mercedes and 55.56%
were in age group 55 to 64 years. 33.33% of owner in age group above 65 years owned
Mercedes. Therefore owners in age group 65 to 74 primarily owned Lexus followed by
Mercedes. Those in age group 55 to 64 years mostly owned Mercedes followed by Lexus. The
owners aged 35 to 44 years owned mostly BMW followed by Mercedes and then Lexus.
Table 2: Descriptive Statistics for ages with preference for BMW
Age ( in Years) (BMW)
Mean 45.2153
8
Standard Error 0.38190
8
Median 45
Mode 46
Standard
Deviation
4.35442
3
Sample Variance 18.961
Kurtosis 0.04742
Skewness 0.50865
5
Range 21
⊘ This is a preview!⊘
Do you want full access?
Subscribe today to unlock all pages.
Trusted by 1+ million students worldwide
7STATISTICS FOR DECISION MAKING
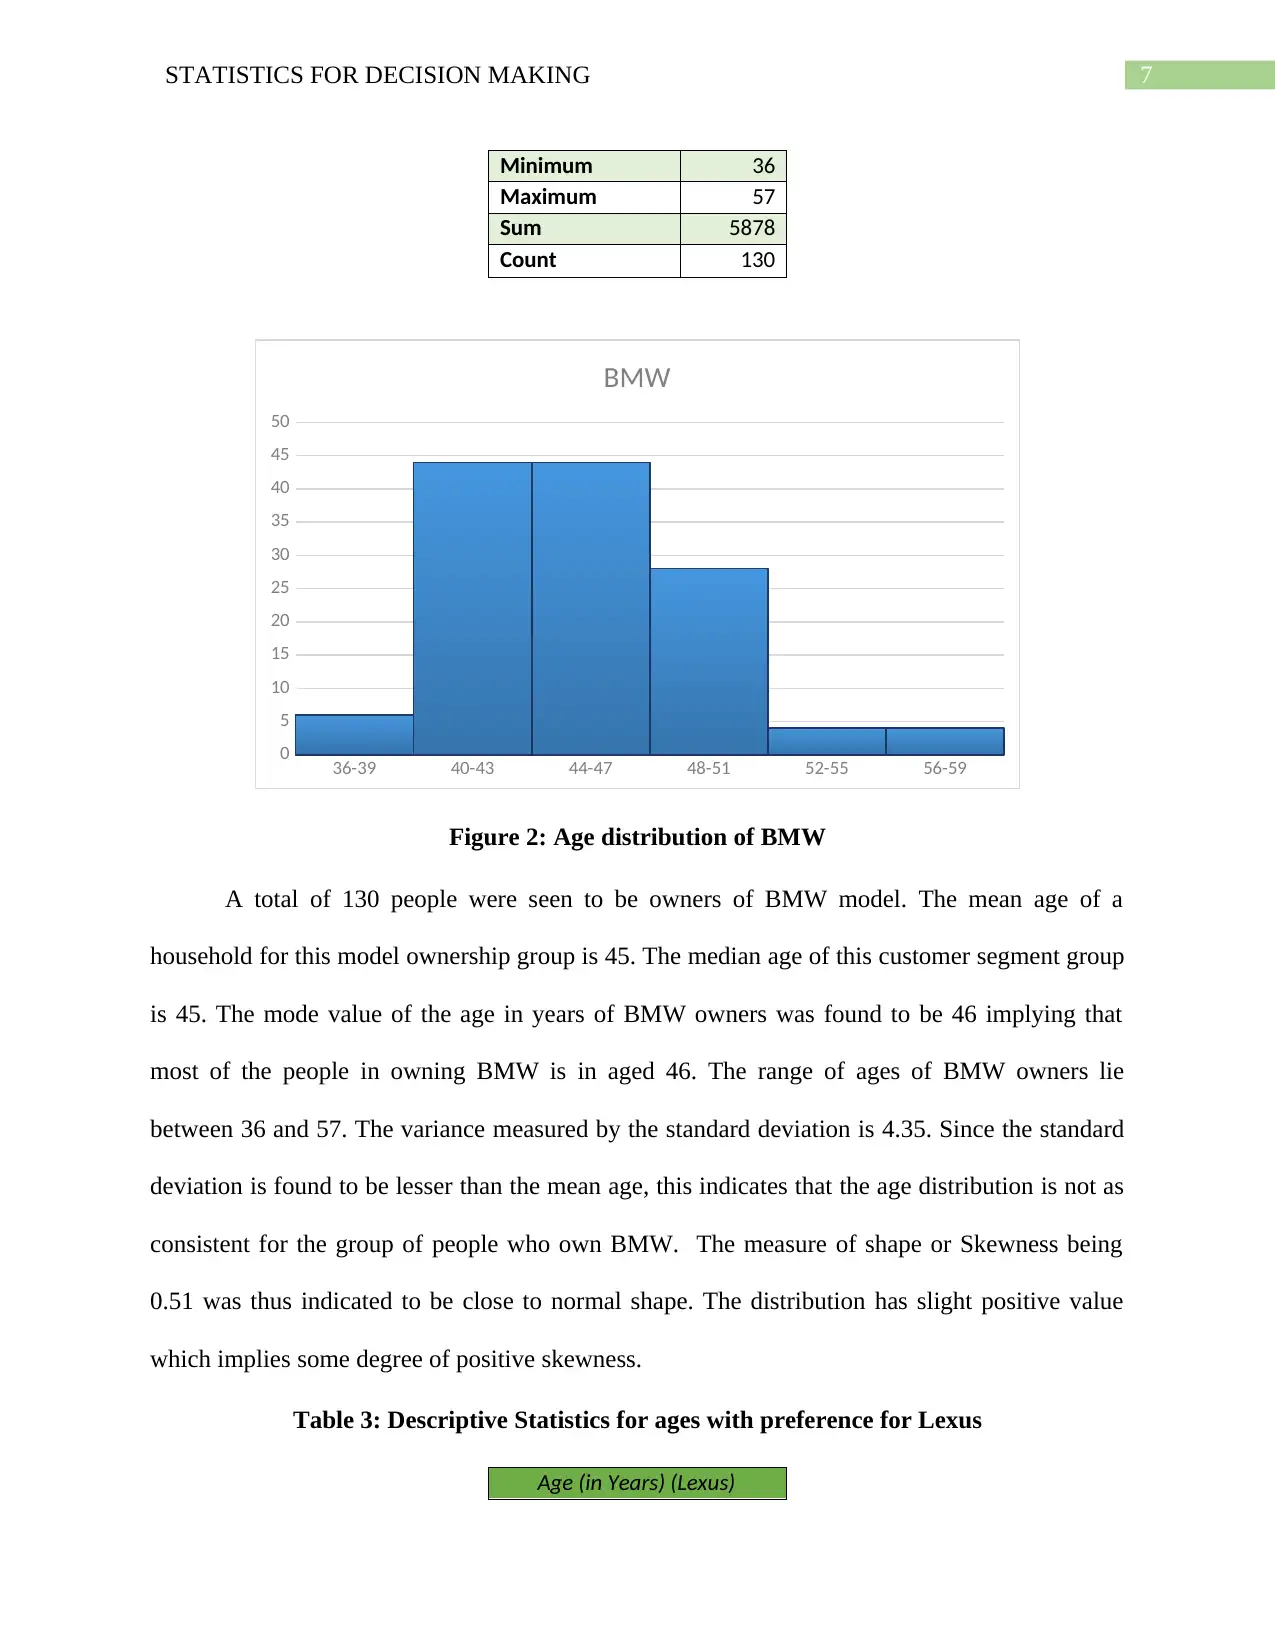
Minimum 36
Maximum 57
Sum 5878
Count 130
36-39 40-43 44-47 48-51 52-55 56-59
0
5
10
15
20
25
30
35
40
45
50
BMW
Figure 2: Age distribution of BMW
A total of 130 people were seen to be owners of BMW model. The mean age of a
household for this model ownership group is 45. The median age of this customer segment group
is 45. The mode value of the age in years of BMW owners was found to be 46 implying that
most of the people in owning BMW is in aged 46. The range of ages of BMW owners lie
between 36 and 57. The variance measured by the standard deviation is 4.35. Since the standard
deviation is found to be lesser than the mean age, this indicates that the age distribution is not as
consistent for the group of people who own BMW. The measure of shape or Skewness being
0.51 was thus indicated to be close to normal shape. The distribution has slight positive value
which implies some degree of positive skewness.
Table 3: Descriptive Statistics for ages with preference for Lexus
Age (in Years) (Lexus)
Paraphrase This Document
Need a fresh take? Get an instant paraphrase of this document with our AI Paraphraser
8STATISTICS FOR DECISION MAKING
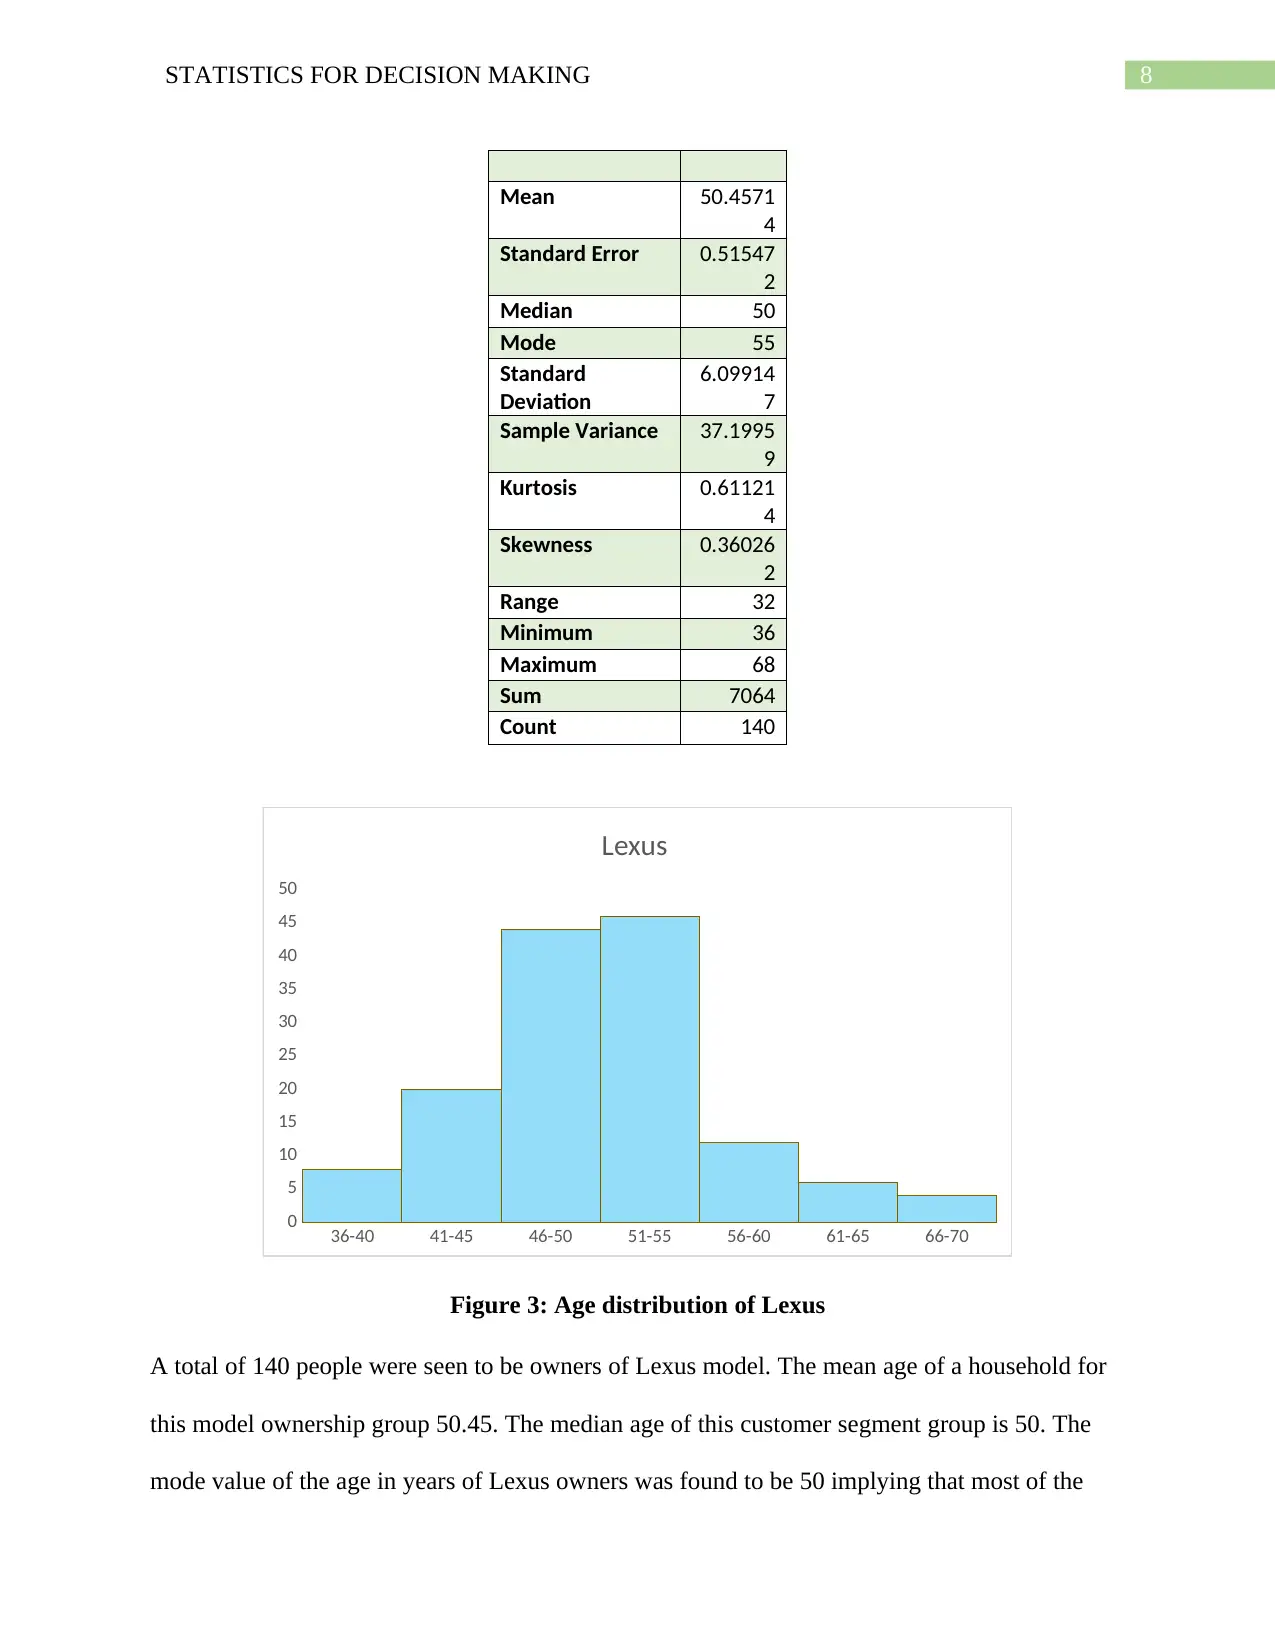
Mean 50.4571
4
Standard Error 0.51547
2
Median 50
Mode 55
Standard
Deviation
6.09914
7
Sample Variance 37.1995
9
Kurtosis 0.61121
4
Skewness 0.36026
2
Range 32
Minimum 36
Maximum 68
Sum 7064
Count 140
36-40 41-45 46-50 51-55 56-60 61-65 66-70
0
5
10
15
20
25
30
35
40
45
50
Lexus
Figure 3: Age distribution of Lexus
A total of 140 people were seen to be owners of Lexus model. The mean age of a household for
this model ownership group 50.45. The median age of this customer segment group is 50. The
mode value of the age in years of Lexus owners was found to be 50 implying that most of the
9STATISTICS FOR DECISION MAKING
people in owning Lexus is in aged 50. The range of ages of Lexus owners lie between 36 and 68.
The variance measured by the standard deviation is 6.099. Since the standard deviation is found
to be lesser than the mean age, this indicates that the age distribution is not as volatile for the
group of people who own Lexus. The measure of shape or Skewness being 0.360. The
distribution has slight positive value which implies some degree of positive skewness.
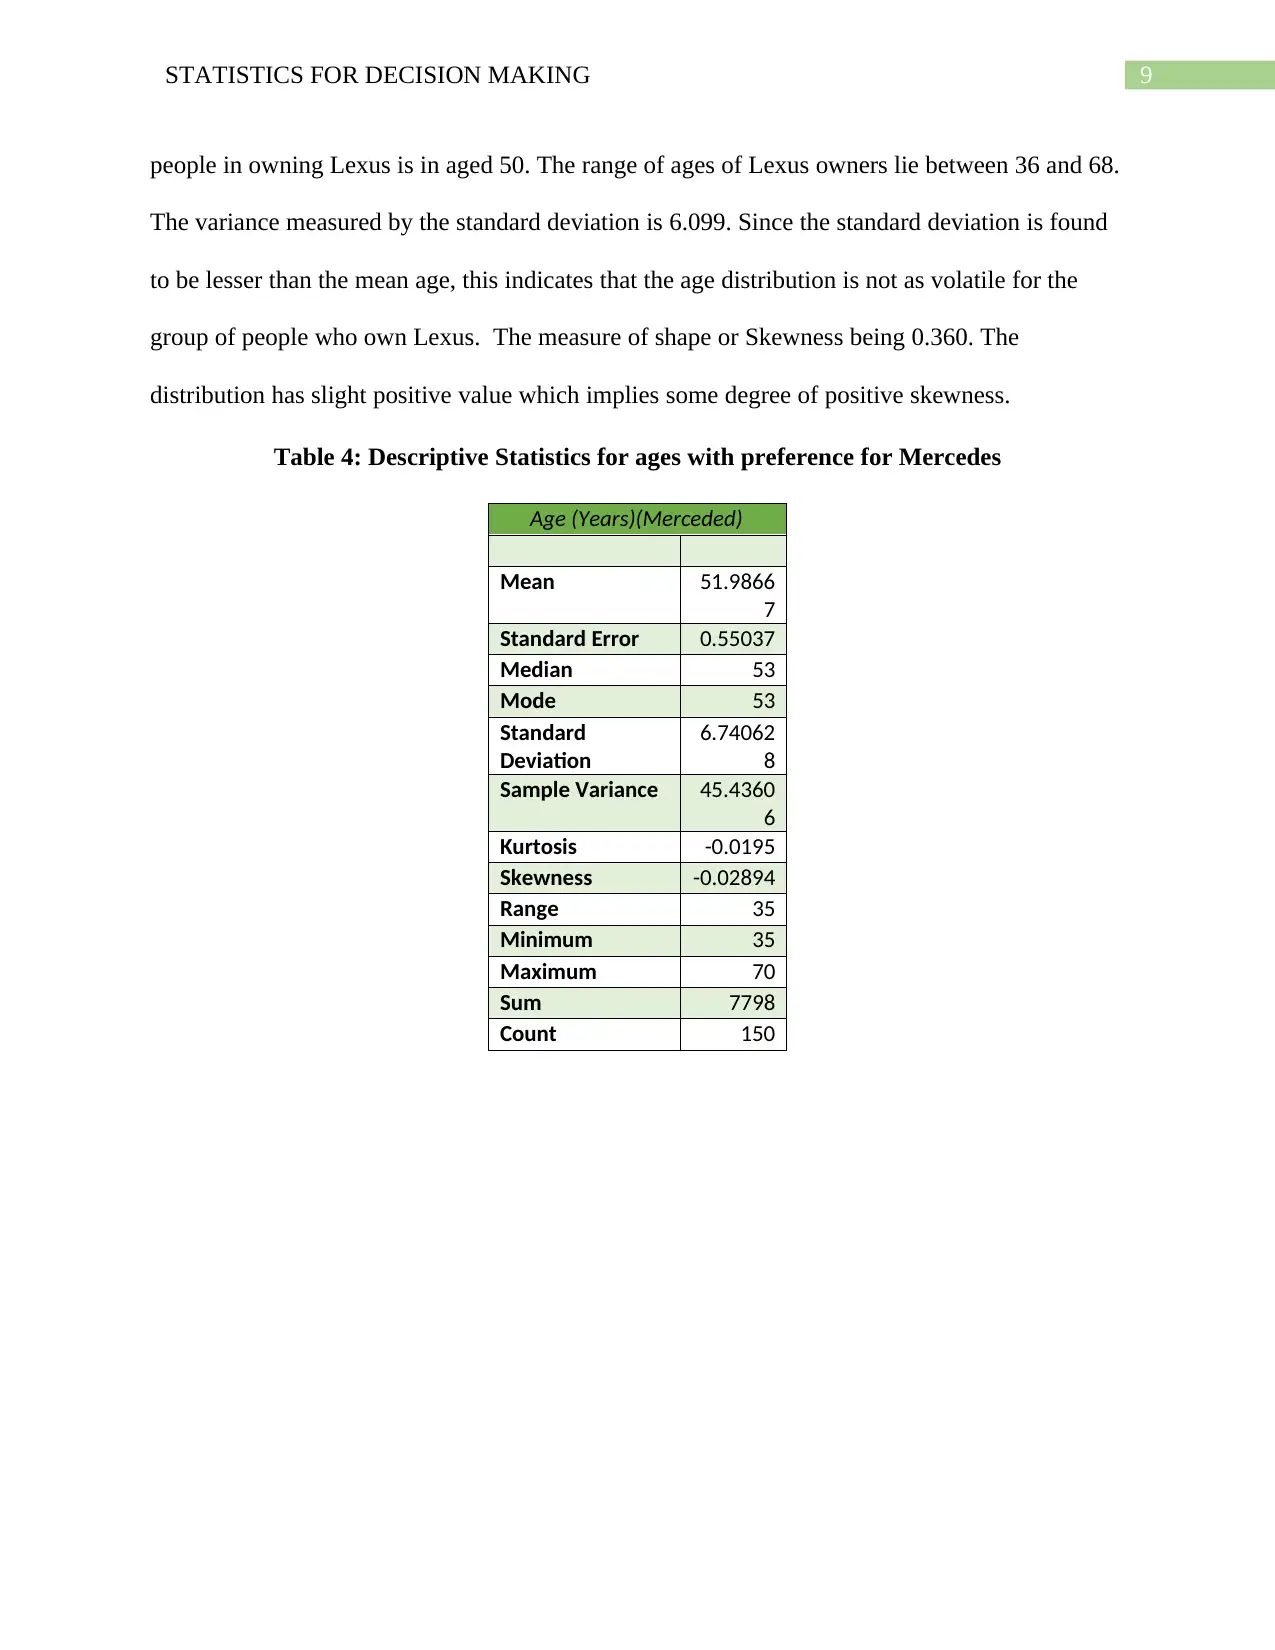
Table 4: Descriptive Statistics for ages with preference for Mercedes
Age (Years)(Merceded)
Mean 51.9866
7
Standard Error 0.55037
Median 53
Mode 53
Standard
Deviation
6.74062
8
Sample Variance 45.4360
6
Kurtosis -0.0195
Skewness -0.02894
Range 35
Minimum 35
Maximum 70
Sum 7798
Count 150
people in owning Lexus is in aged 50. The range of ages of Lexus owners lie between 36 and 68.
The variance measured by the standard deviation is 6.099. Since the standard deviation is found
to be lesser than the mean age, this indicates that the age distribution is not as volatile for the
group of people who own Lexus. The measure of shape or Skewness being 0.360. The
distribution has slight positive value which implies some degree of positive skewness.
Table 4: Descriptive Statistics for ages with preference for Mercedes
Age (Years)(Merceded)
Mean 51.9866
7
Standard Error 0.55037
Median 53
Mode 53
Standard
Deviation
6.74062
8
Sample Variance 45.4360
6
Kurtosis -0.0195
Skewness -0.02894
Range 35
Minimum 35
Maximum 70
Sum 7798
Count 150
⊘ This is a preview!⊘
Do you want full access?
Subscribe today to unlock all pages.
Trusted by 1+ million students worldwide
10STATISTICS FOR DECISION MAKING
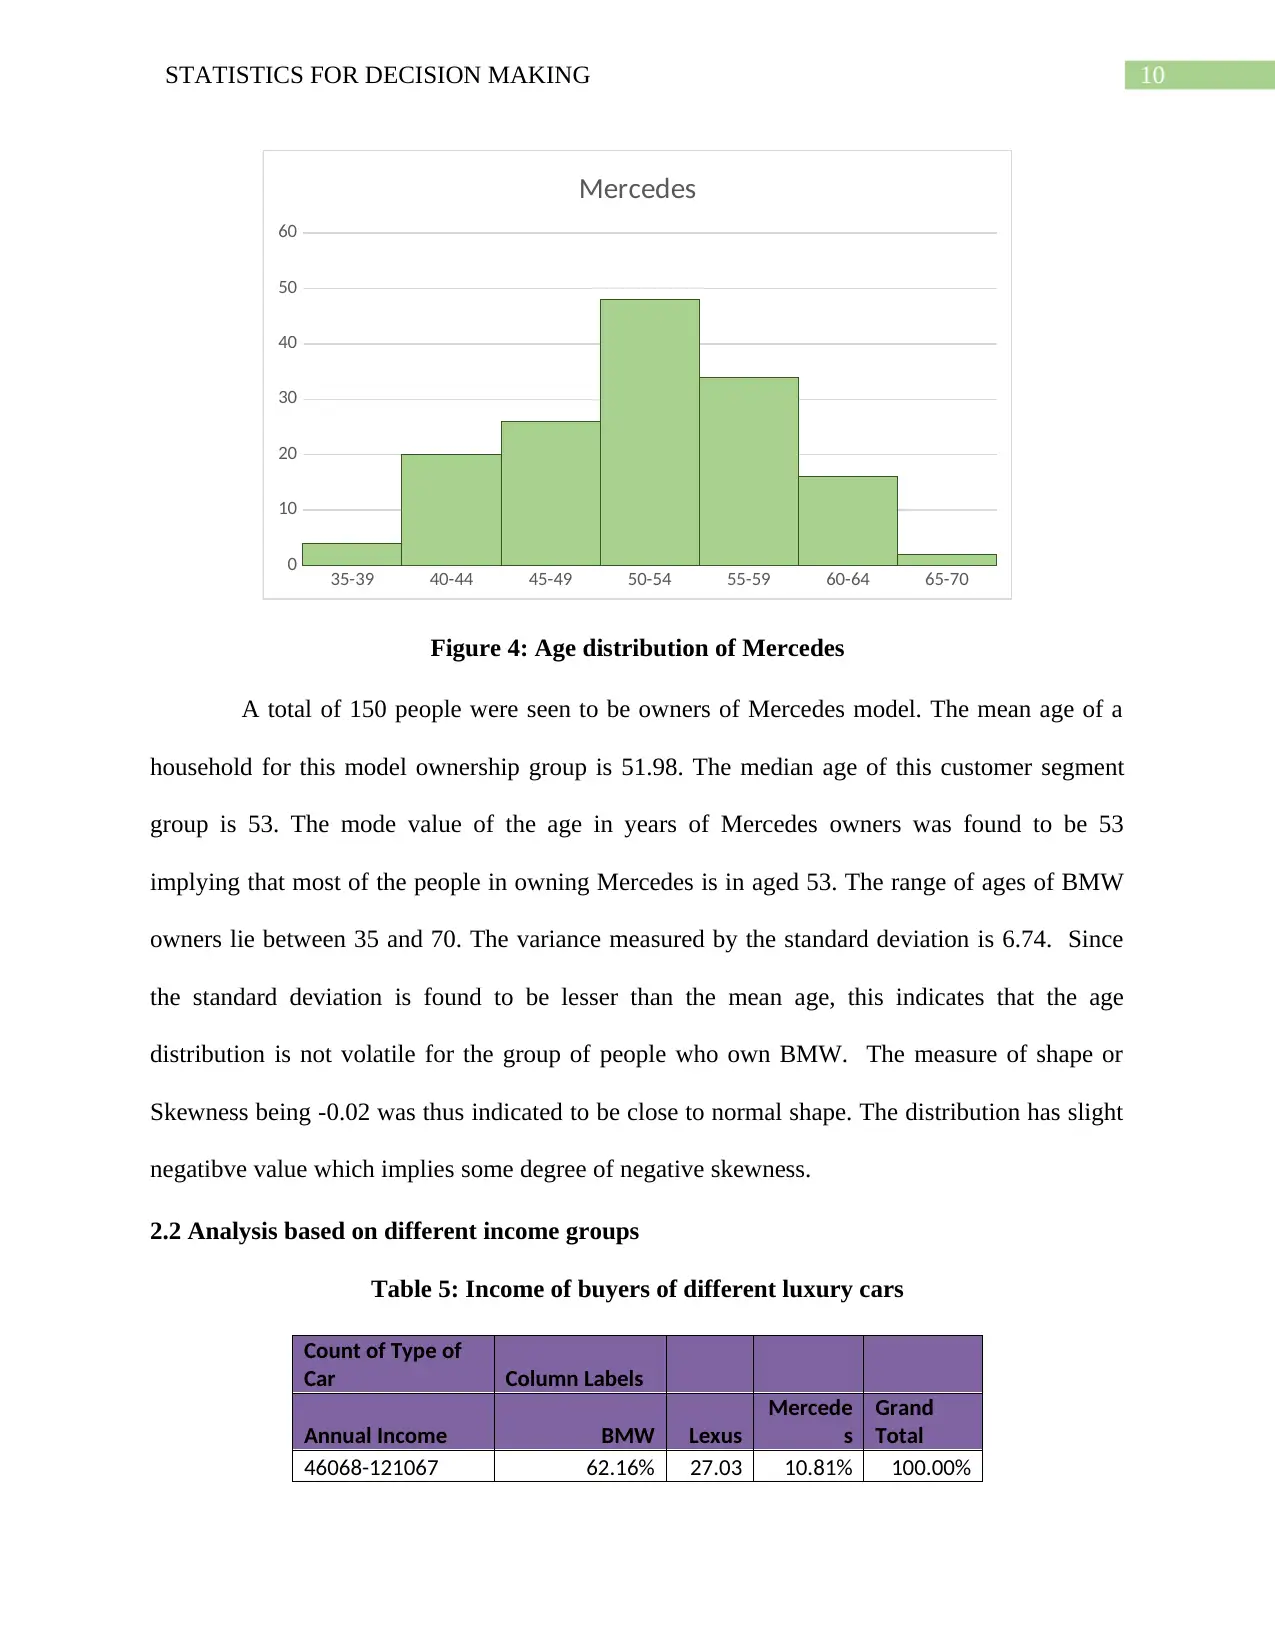
35-39 40-44 45-49 50-54 55-59 60-64 65-70
0
10
20
30
40
50
60
Mercedes
Figure 4: Age distribution of Mercedes
A total of 150 people were seen to be owners of Mercedes model. The mean age of a
household for this model ownership group is 51.98. The median age of this customer segment
group is 53. The mode value of the age in years of Mercedes owners was found to be 53
implying that most of the people in owning Mercedes is in aged 53. The range of ages of BMW
owners lie between 35 and 70. The variance measured by the standard deviation is 6.74. Since
the standard deviation is found to be lesser than the mean age, this indicates that the age
distribution is not volatile for the group of people who own BMW. The measure of shape or
Skewness being -0.02 was thus indicated to be close to normal shape. The distribution has slight
negatibve value which implies some degree of negative skewness.
2.2 Analysis based on different income groups
Table 5: Income of buyers of different luxury cars
Count of Type of
Car Column Labels
Annual Income BMW Lexus
Mercede
s
Grand
Total
46068-121067 62.16% 27.03 10.81% 100.00%
Paraphrase This Document
Need a fresh take? Get an instant paraphrase of this document with our AI Paraphraser
11STATISTICS FOR DECISION MAKING
%
121068-196067 28.78%
39.57
% 31.65% 100.00%
196068-271067 6.45%
16.13
% 77.42% 100.00%
271068-346067 0.00% 0.00% 100.00% 100.00%
Grand Total 30.95%
33.33
% 35.71% 100.00%
46068-121067 121068-196067 196068-271067 271068-346067
0%
10%
20%
30%
40%
50%
60%
70%
80%
90%
100%
62.16%
28.78%
6.45% 0.00%
27.03%
39.57%
16.13%
0.00%
10.81%
31.65%
77.42%
100.00%
Income and Car Type
3
2
1
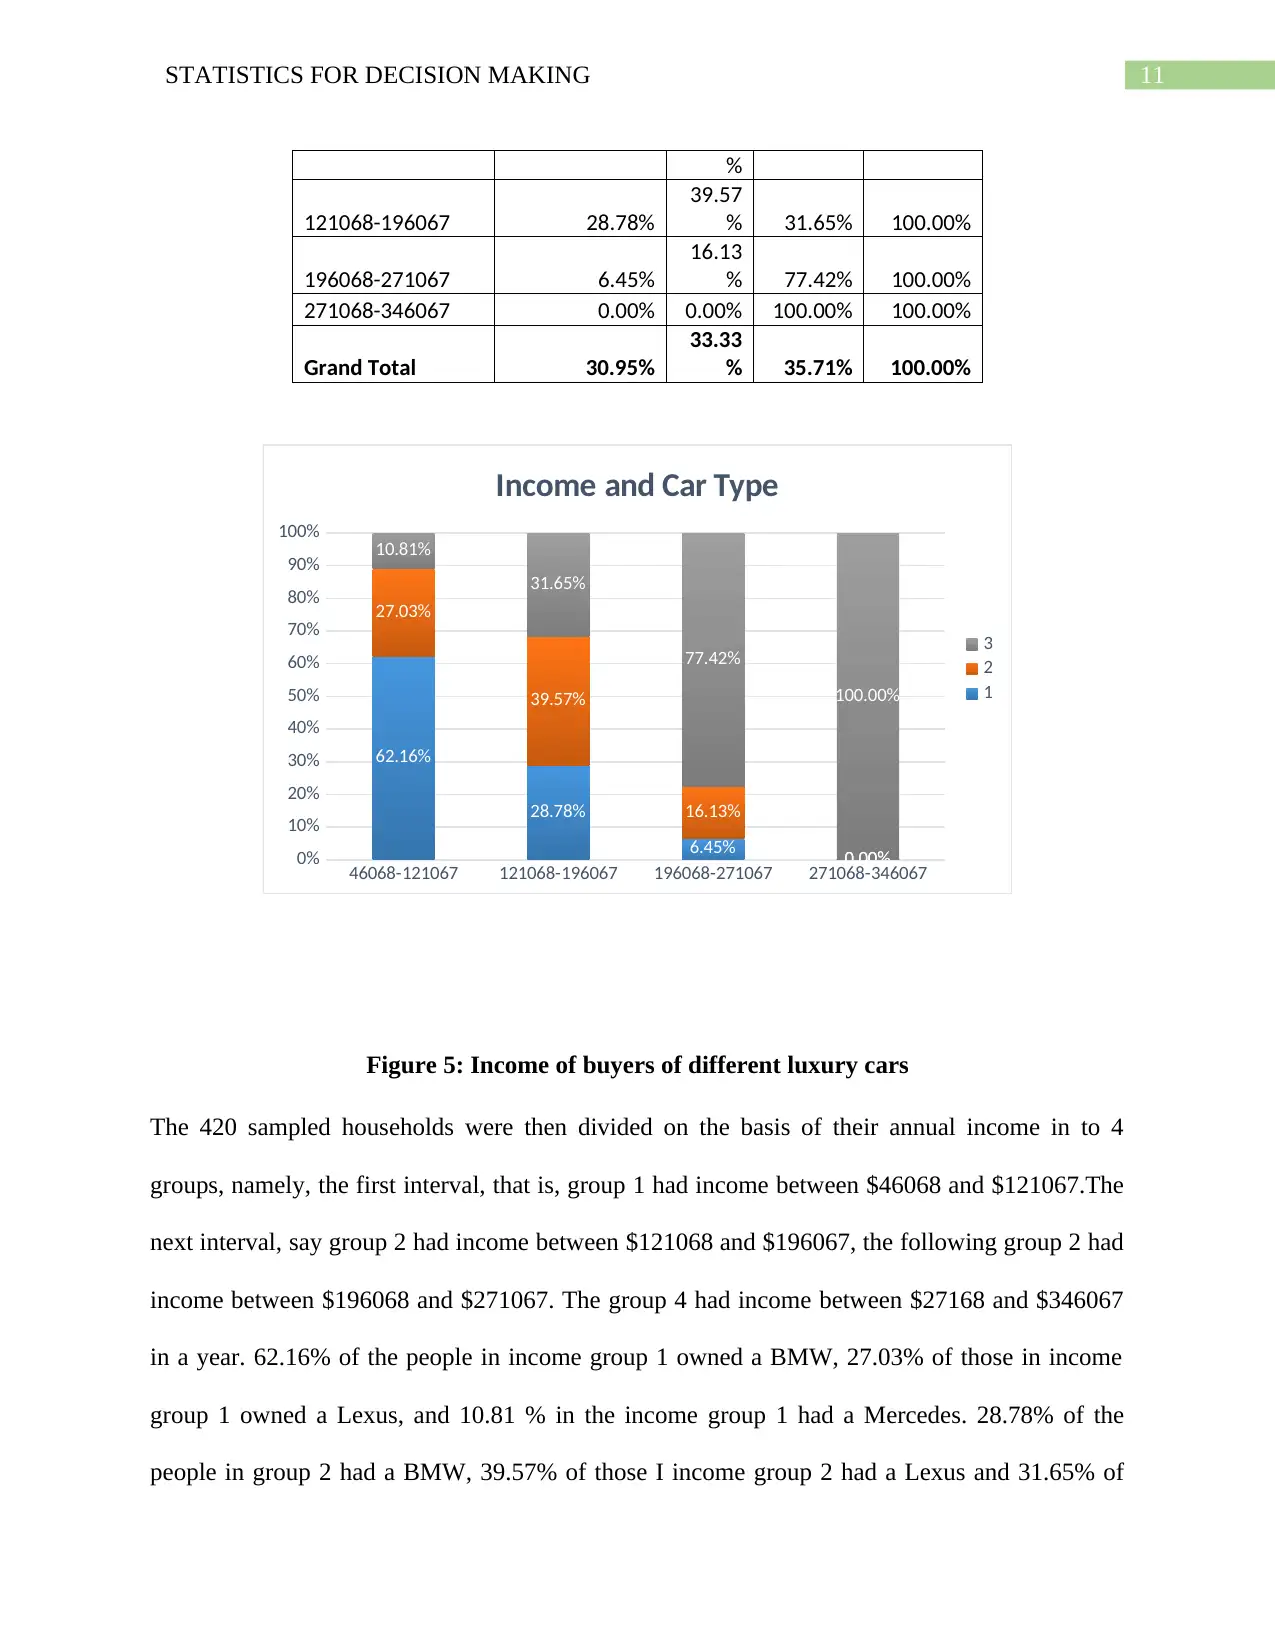
Figure 5: Income of buyers of different luxury cars
The 420 sampled households were then divided on the basis of their annual income in to 4
groups, namely, the first interval, that is, group 1 had income between $46068 and $121067.The
next interval, say group 2 had income between $121068 and $196067, the following group 2 had
income between $196068 and $271067. The group 4 had income between $27168 and $346067
in a year. 62.16% of the people in income group 1 owned a BMW, 27.03% of those in income
group 1 owned a Lexus, and 10.81 % in the income group 1 had a Mercedes. 28.78% of the
people in group 2 had a BMW, 39.57% of those I income group 2 had a Lexus and 31.65% of
%
121068-196067 28.78%
39.57
% 31.65% 100.00%
196068-271067 6.45%
16.13
% 77.42% 100.00%
271068-346067 0.00% 0.00% 100.00% 100.00%
Grand Total 30.95%
33.33
% 35.71% 100.00%
46068-121067 121068-196067 196068-271067 271068-346067
0%
10%
20%
30%
40%
50%
60%
70%
80%
90%
100%
62.16%
28.78%
6.45% 0.00%
27.03%
39.57%
16.13%
0.00%
10.81%
31.65%
77.42%
100.00%
Income and Car Type
3
2
1
Figure 5: Income of buyers of different luxury cars
The 420 sampled households were then divided on the basis of their annual income in to 4
groups, namely, the first interval, that is, group 1 had income between $46068 and $121067.The
next interval, say group 2 had income between $121068 and $196067, the following group 2 had
income between $196068 and $271067. The group 4 had income between $27168 and $346067
in a year. 62.16% of the people in income group 1 owned a BMW, 27.03% of those in income
group 1 owned a Lexus, and 10.81 % in the income group 1 had a Mercedes. 28.78% of the
people in group 2 had a BMW, 39.57% of those I income group 2 had a Lexus and 31.65% of
12STATISTICS FOR DECISION MAKING
those in group 2 had a Mercedes. 6.45% of the people in group 3 had a BMW whereas 16.13%
owned a Lexus and 77.42% had a Mercedes. 0% of the people in income group 4 had any BMW
or Lexus. It was seen that all 100% of the people with income between $271068 and
$346067owned a Mercedes. Therefor it is seen that higher income groups are most likely to own
a Mercedes whereas BMW is more common among the relatively lower income groups.
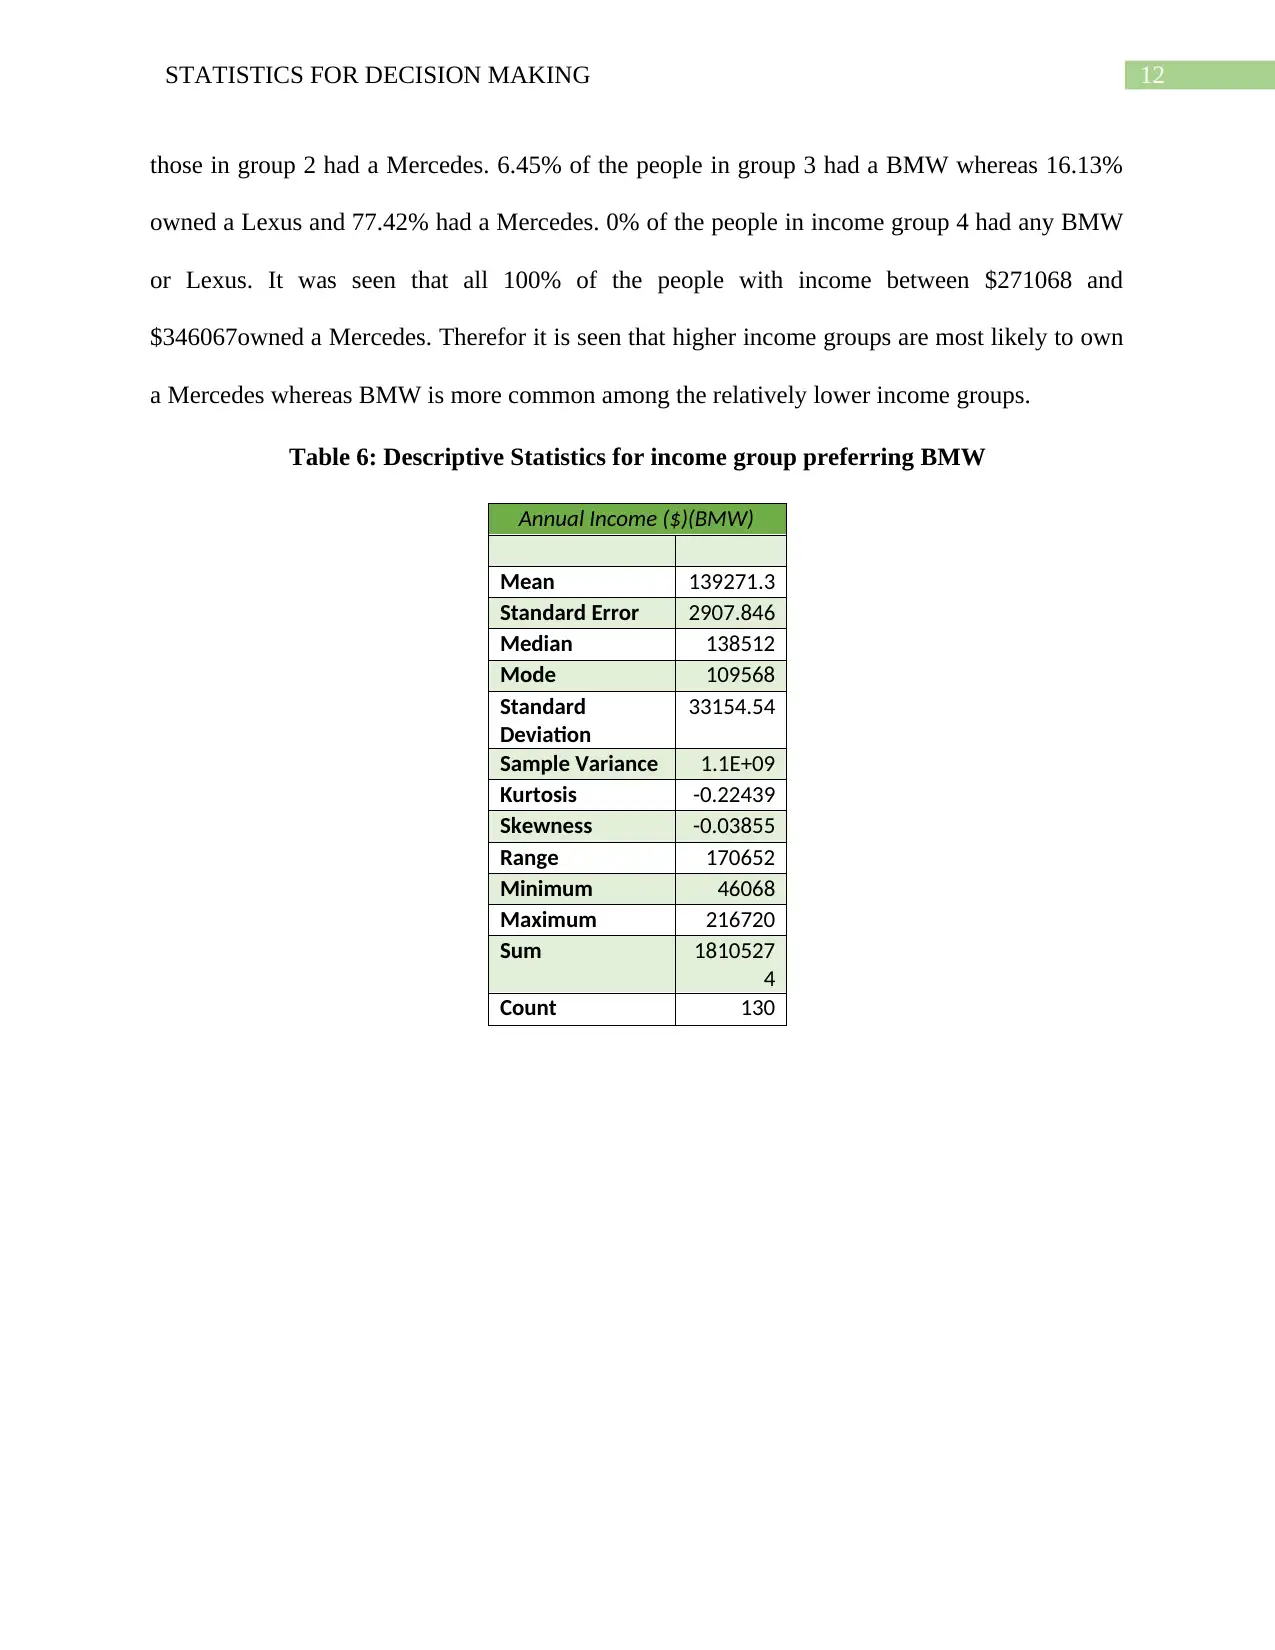
Table 6: Descriptive Statistics for income group preferring BMW
Annual Income ($)(BMW)
Mean 139271.3
Standard Error 2907.846
Median 138512
Mode 109568
Standard
Deviation
33154.54
Sample Variance 1.1E+09
Kurtosis -0.22439
Skewness -0.03855
Range 170652
Minimum 46068
Maximum 216720
Sum 1810527
4
Count 130
those in group 2 had a Mercedes. 6.45% of the people in group 3 had a BMW whereas 16.13%
owned a Lexus and 77.42% had a Mercedes. 0% of the people in income group 4 had any BMW
or Lexus. It was seen that all 100% of the people with income between $271068 and
$346067owned a Mercedes. Therefor it is seen that higher income groups are most likely to own
a Mercedes whereas BMW is more common among the relatively lower income groups.
Table 6: Descriptive Statistics for income group preferring BMW
Annual Income ($)(BMW)
Mean 139271.3
Standard Error 2907.846
Median 138512
Mode 109568
Standard
Deviation
33154.54
Sample Variance 1.1E+09
Kurtosis -0.22439
Skewness -0.03855
Range 170652
Minimum 46068
Maximum 216720
Sum 1810527
4
Count 130
⊘ This is a preview!⊘
Do you want full access?
Subscribe today to unlock all pages.
Trusted by 1+ million students worldwide
1 out of 27
Related Documents


Your All-in-One AI-Powered Toolkit for Academic Success.
+13062052269
info@desklib.com
Available 24*7 on WhatsApp / Email
![[object Object]](/_next/static/media/star-bottom.7253800d.svg)
Unlock your academic potential
Copyright © 2020–2026 A2Z Services. All Rights Reserved. Developed and managed by ZUCOL.