ESE633 Statistics in Education Level Assignment 2022
Added on 2022-10-13
11 Pages2969 Words22 Views
ASSIGNMENT
MAY 2017 SEMESTER
SUBJECT CODE : ESE633
SUBJECT TITLE : STATISTICS IN EDUCATION
LEVEL : MASTER
STUDENT’S NAME :
MATRIC NO. :
PROGRAMME :
ACADEMIC
FACILITATOR
:
LEARNING CENTRE :
MAY 2017 SEMESTER
SUBJECT CODE : ESE633
SUBJECT TITLE : STATISTICS IN EDUCATION
LEVEL : MASTER
STUDENT’S NAME :
MATRIC NO. :
PROGRAMME :
ACADEMIC
FACILITATOR
:
LEARNING CENTRE :

ASSIGNMENT (60%)
INSTRUCTION: Answer ALL questions.
Question 1 [6 marks]
State THREE hypotheses using Emotional Intelligence as the dependent variable for the
following:
i) Comparison according to Gender (Male & Female)
Answer
Null hypothesis (H0): There is no significant difference in the emotional
intelligence between the male and female participants.
Alternative hypothesis (HA): There is significant difference in the emotional
intelligence between the male and female participants.
ii) Comparison according to Socioeconomic Status (High, Middle & Low)
Answer
Null hypothesis (H0): The emotional intelligence is the same across the three
socioeconomic status.
Alternative hypothesis (HA): At least one of the socioeconomic status has
different emotional intelligence.
iii) Comparison according to Types of school (Rural & Urban)
Answer
Null hypothesis (H0): There is no significant difference in the emotional
intelligence between the participants in the rural schools and those in the
urban schools.
Alternative hypothesis (HA): There is significant difference in the emotional
intelligence between the participants in the rural schools and those in the
urban schools.
Question 2 [3 marks]
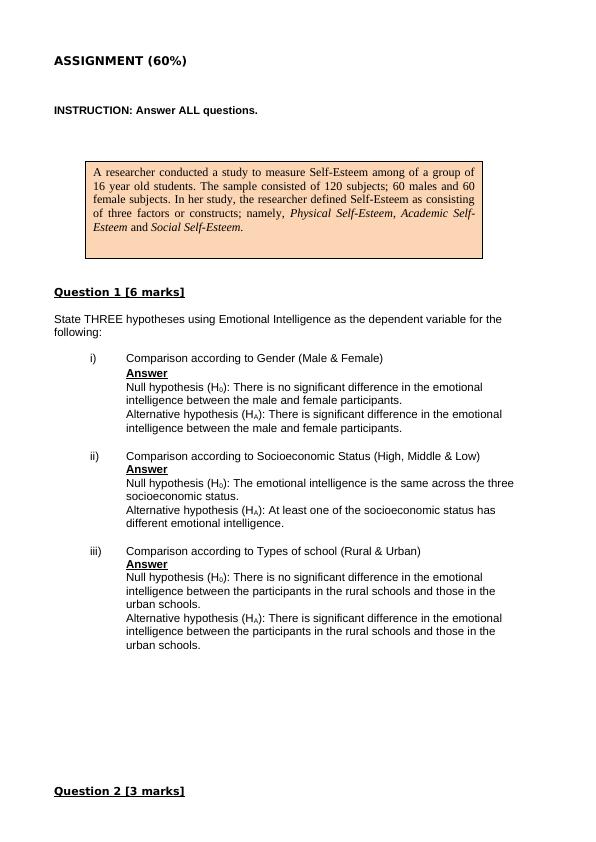
A researcher conducted a study to measure Self-Esteem among of a group of
16 year old students. The sample consisted of 120 subjects; 60 males and 60
female subjects. In her study, the researcher defined Self-Esteem as consisting
of three factors or constructs; namely, Physical Self-Esteem, Academic Self-
Esteem and Social Self-Esteem.
INSTRUCTION: Answer ALL questions.
Question 1 [6 marks]
State THREE hypotheses using Emotional Intelligence as the dependent variable for the
following:
i) Comparison according to Gender (Male & Female)
Answer
Null hypothesis (H0): There is no significant difference in the emotional
intelligence between the male and female participants.
Alternative hypothesis (HA): There is significant difference in the emotional
intelligence between the male and female participants.
ii) Comparison according to Socioeconomic Status (High, Middle & Low)
Answer
Null hypothesis (H0): The emotional intelligence is the same across the three
socioeconomic status.
Alternative hypothesis (HA): At least one of the socioeconomic status has
different emotional intelligence.
iii) Comparison according to Types of school (Rural & Urban)
Answer
Null hypothesis (H0): There is no significant difference in the emotional
intelligence between the participants in the rural schools and those in the
urban schools.
Alternative hypothesis (HA): There is significant difference in the emotional
intelligence between the participants in the rural schools and those in the
urban schools.
Question 2 [3 marks]
A researcher conducted a study to measure Self-Esteem among of a group of
16 year old students. The sample consisted of 120 subjects; 60 males and 60
female subjects. In her study, the researcher defined Self-Esteem as consisting
of three factors or constructs; namely, Physical Self-Esteem, Academic Self-
Esteem and Social Self-Esteem.
State the appropriate statistical tests to test the three hypotheses listed in Question 2. Give
reasons.
Answer
i) Comparison according to Gender (Male & Female)
The appropriate statistical test is the independent samples t-test. This is
because there are two unrelated/independent factors (male and female) and t-
test is appropriate in testing difference in mean for two unrelated/independent
groups.
ii) Comparison according to Socioeconomic Status (High, Middle & Low)
The appropriate statistical test is the one-way analysis of variance (ANOVA)
This is because there are three unrelated/independent factors (High, Middle &
Low) and ANOVA is appropriate in testing difference in mean for more than
two unrelated/independent groups (Wilkinson, 2009).
iii) Comparison according to Types of school (Rural & Urban)
The appropriate statistical test is the independent samples t-test. This is
because there are two unrelated/independent factors (Rural & Urban) and t-
test is appropriate in testing difference in mean for two unrelated/independent
groups.
Question 3 [5 marks]
State the assumptions required for the statistical test(s) used in Question 3.
Answer
The assumptions required for the above test(s) are as follows;
Normality of the dependent variable; the dependent variable (emotional intelligence)
should follow a normal distribution.
The dependent variable (emotional intelligence) should be continuous. That is, the
variable should either be interval or ratio scale
The observations need to be independent of each other
The error term should be homogenous (equality of variances)
Question 4 [3 marks]
Explain what is meant by the ‘normality assumption’?
Answer
Normality assumption refers to an arrangement where a set of data is believed to cluster
mostly in the middle of a certain range while the rest of the data values taper off in a
symmetrical way in either the two extreme sides but uniformly (Lumley, et al., 2012). The
normality attribute can be visualized using a histogram where the distribution should look
like a shape of a bell in order to for the data set to be said that it follows a normal distribution
(Zimmerman, 2018).
Question 5: [4 marks]
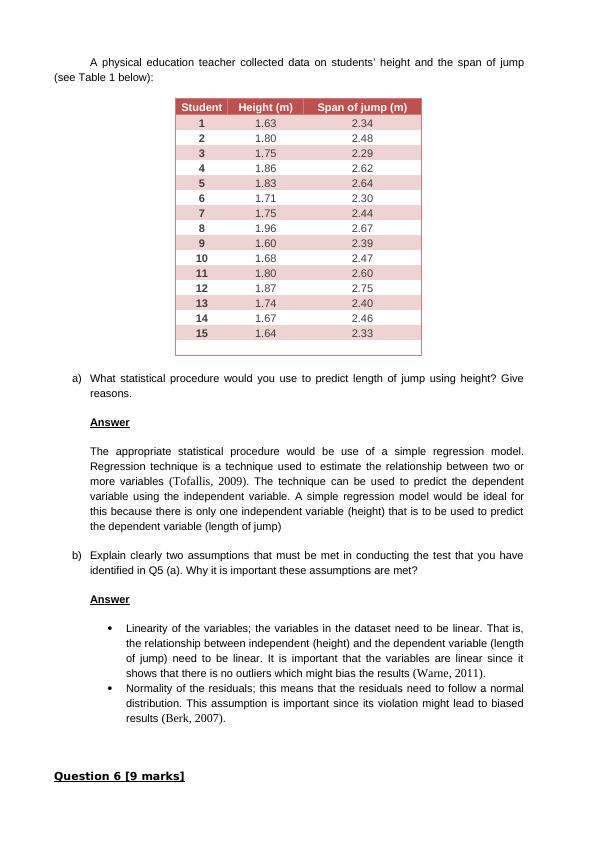
A physical education teacher collected data on students’ height and the span of jump
(see Table 1 below):
Student Height (m) Span of jump (m)
1 1.63 2.34
2 1.80 2.48
3 1.75 2.29
4 1.86 2.62
5 1.83 2.64
6 1.71 2.30
7 1.75 2.44
8 1.96 2.67
9 1.60 2.39
10 1.68 2.47
11 1.80 2.60
12 1.87 2.75
13 1.74 2.40
14 1.67 2.46
15 1.64 2.33
a) What statistical procedure would you use to predict length of jump using height? Give
reasons.
Answer
The appropriate statistical procedure would be use of a simple regression model.
Regression technique is a technique used to estimate the relationship between two or
more variables (Tofallis, 2009). The technique can be used to predict the dependent
variable using the independent variable. A simple regression model would be ideal for
this because there is only one independent variable (height) that is to be used to predict
the dependent variable (length of jump)
b) Explain clearly two assumptions that must be met in conducting the test that you have
identified in Q5 (a). Why it is important these assumptions are met?
Answer
Linearity of the variables; the variables in the dataset need to be linear. That is,
the relationship between independent (height) and the dependent variable (length
of jump) need to be linear. It is important that the variables are linear since it
shows that there is no outliers which might bias the results (Warne, 2011).
Normality of the residuals; this means that the residuals need to follow a normal
distribution. This assumption is important since its violation might lead to biased
results (Berk, 2007).
Question 6 [9 marks]
End of preview
Want to access all the pages? Upload your documents or become a member.
Related Documents
Report on Research Psychologylg...
|5
|855
|252
SPSS output on T-test for mean heights and interpretation.lg...
|2
|359
|72
Does average self-reported weekly income differ between male and female full-time workers in Sydney?lg...
|8
|2283
|98
Population mean or mean score of schoollg...
|7
|983
|42
Does average self-reported weekly income differ between male and female full-time workers in Sydney?lg...
|13
|2582
|174
Statistics Exercise 16 and 17lg...
|5
|1756
|134