Holmes Institute HI6007 Statistics Assignment - Group Analysis

Verified

Added on  2023/06/03

|9
|598
|256
Homework Assignment
AI Summary
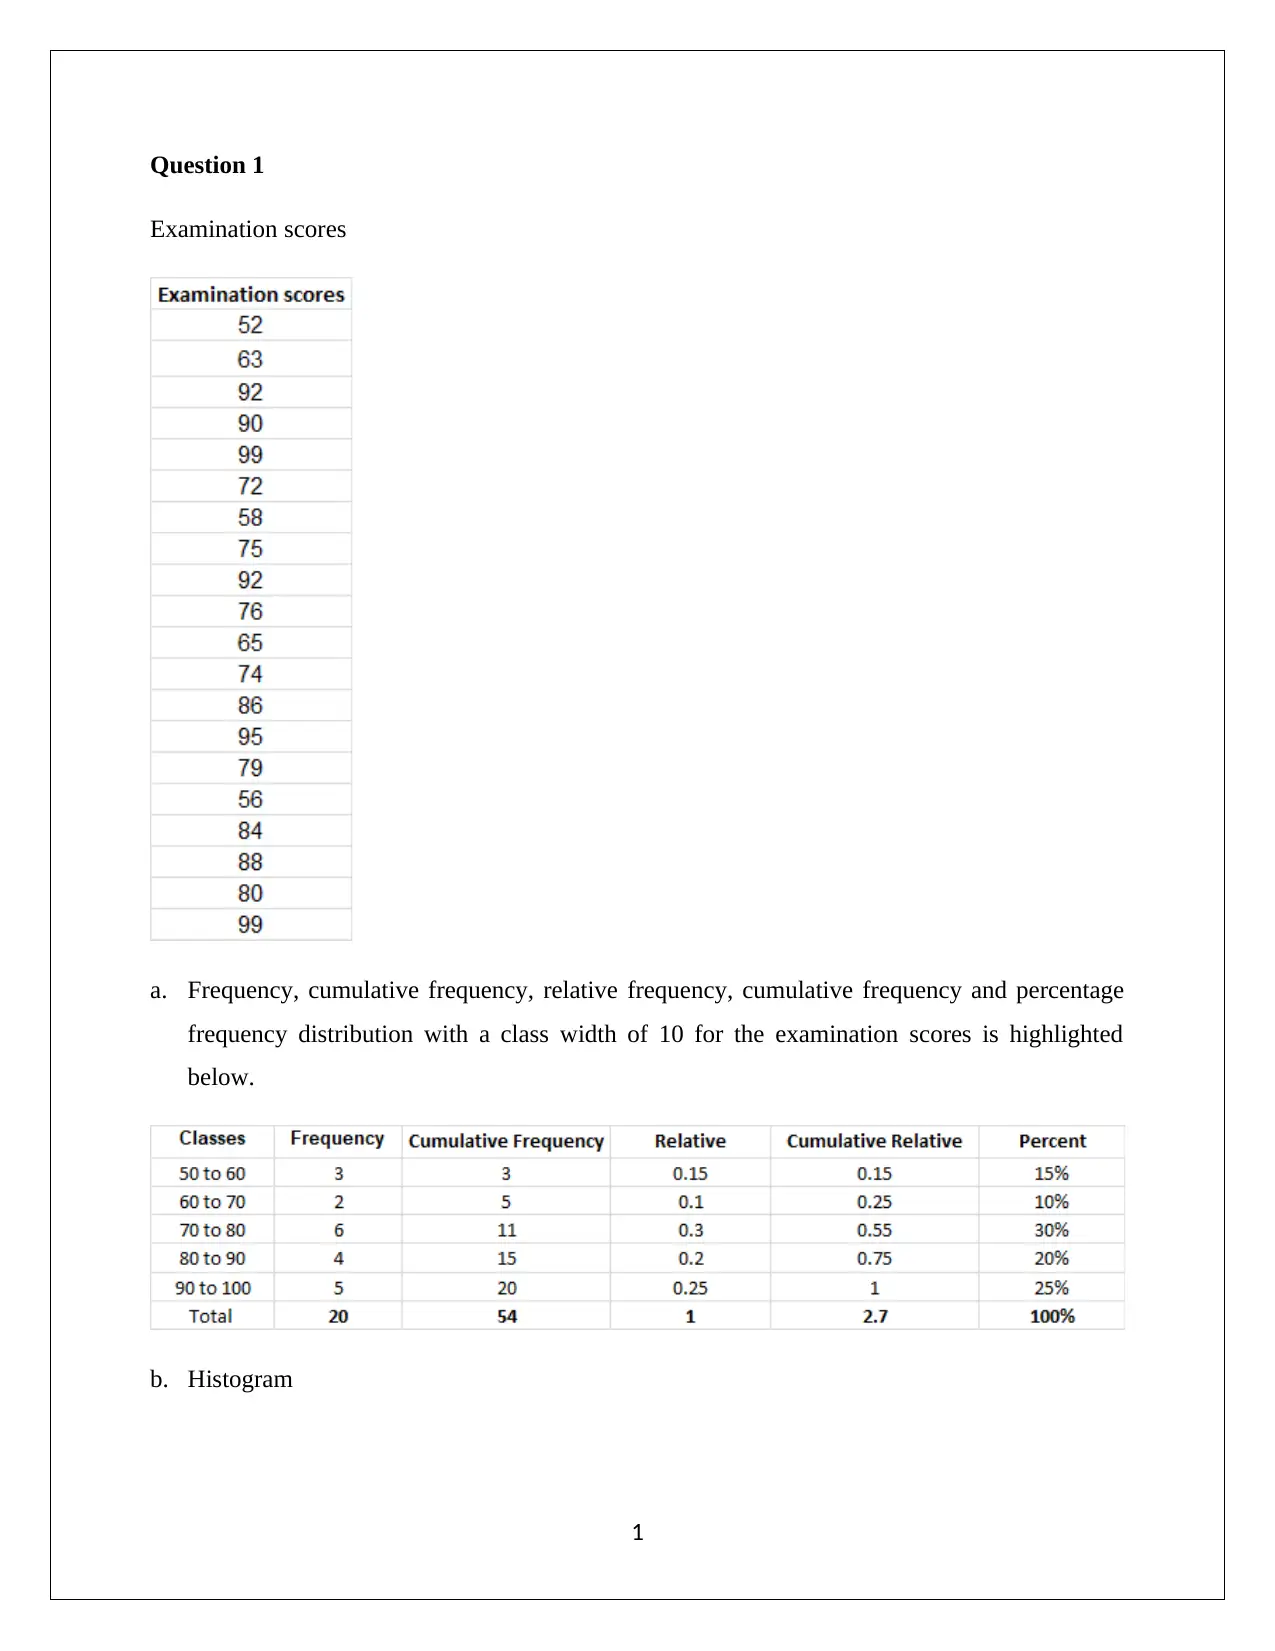
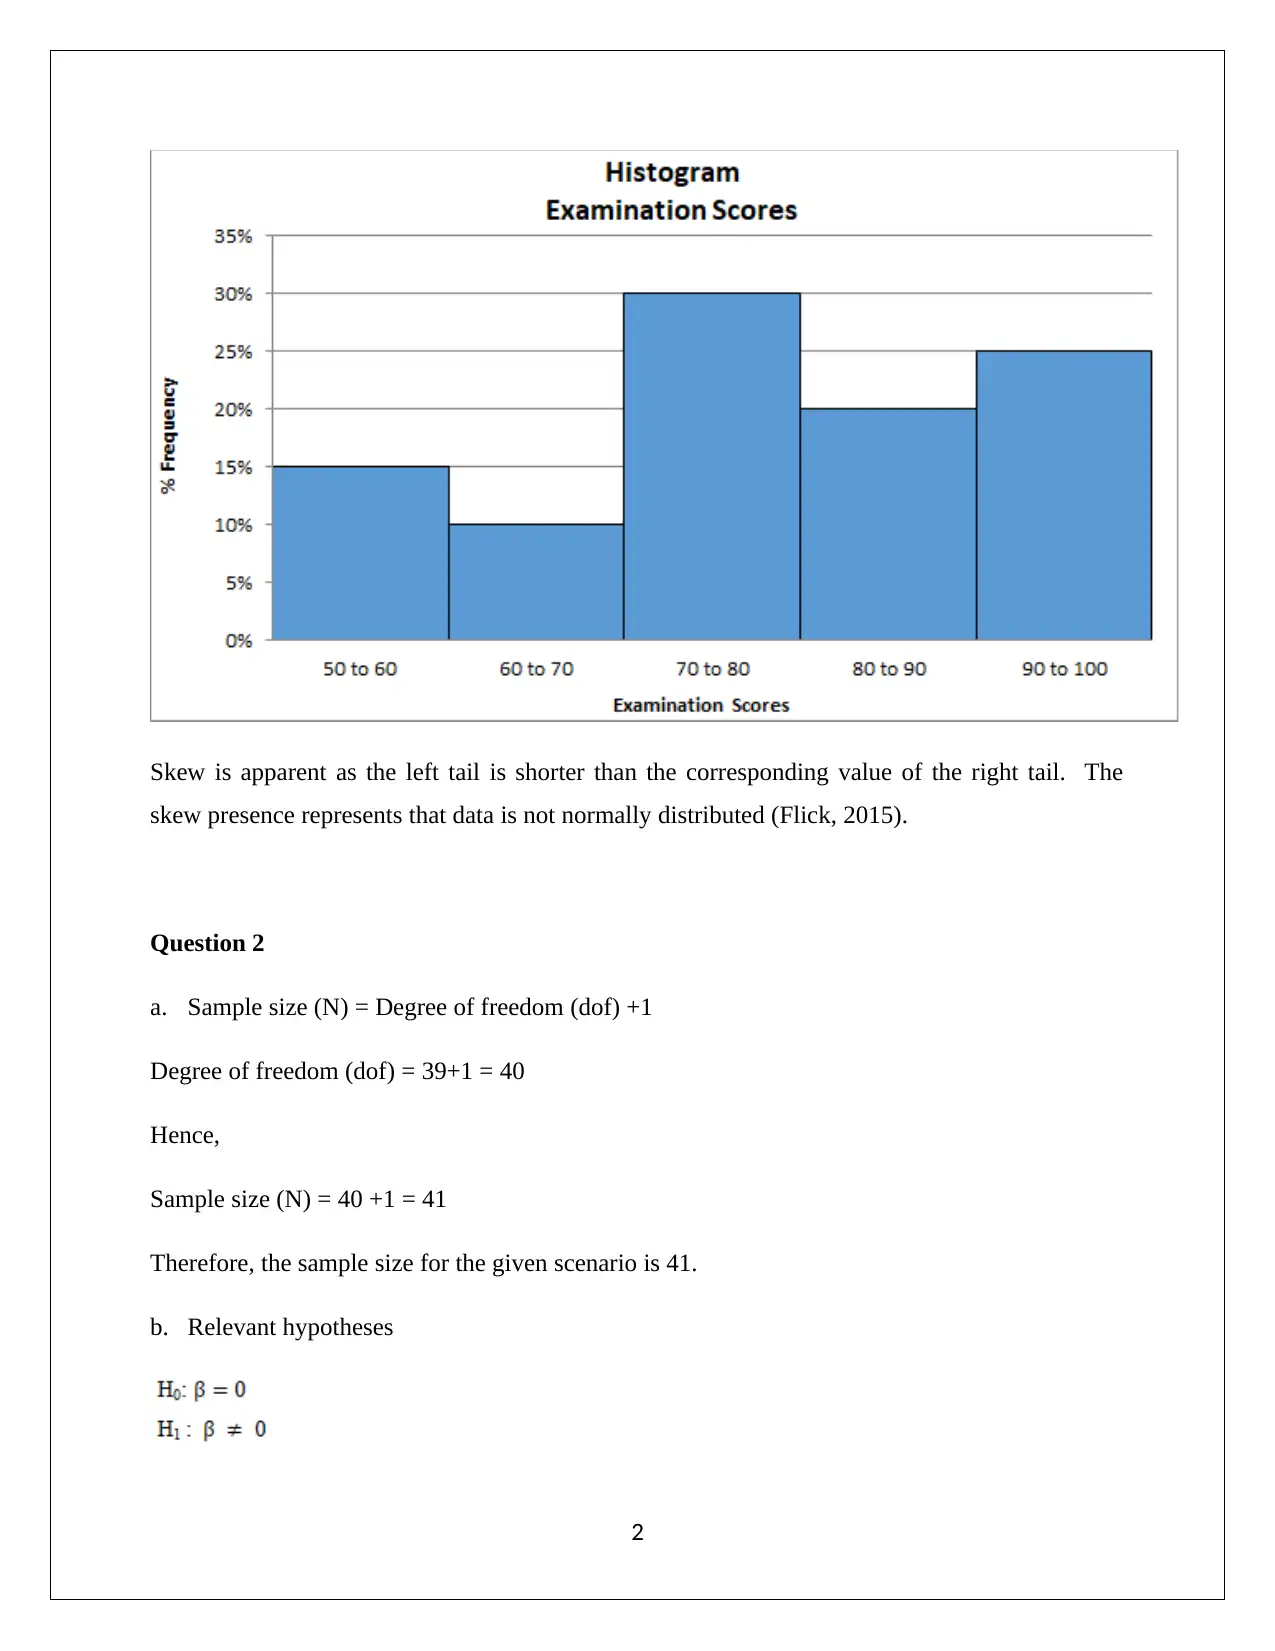
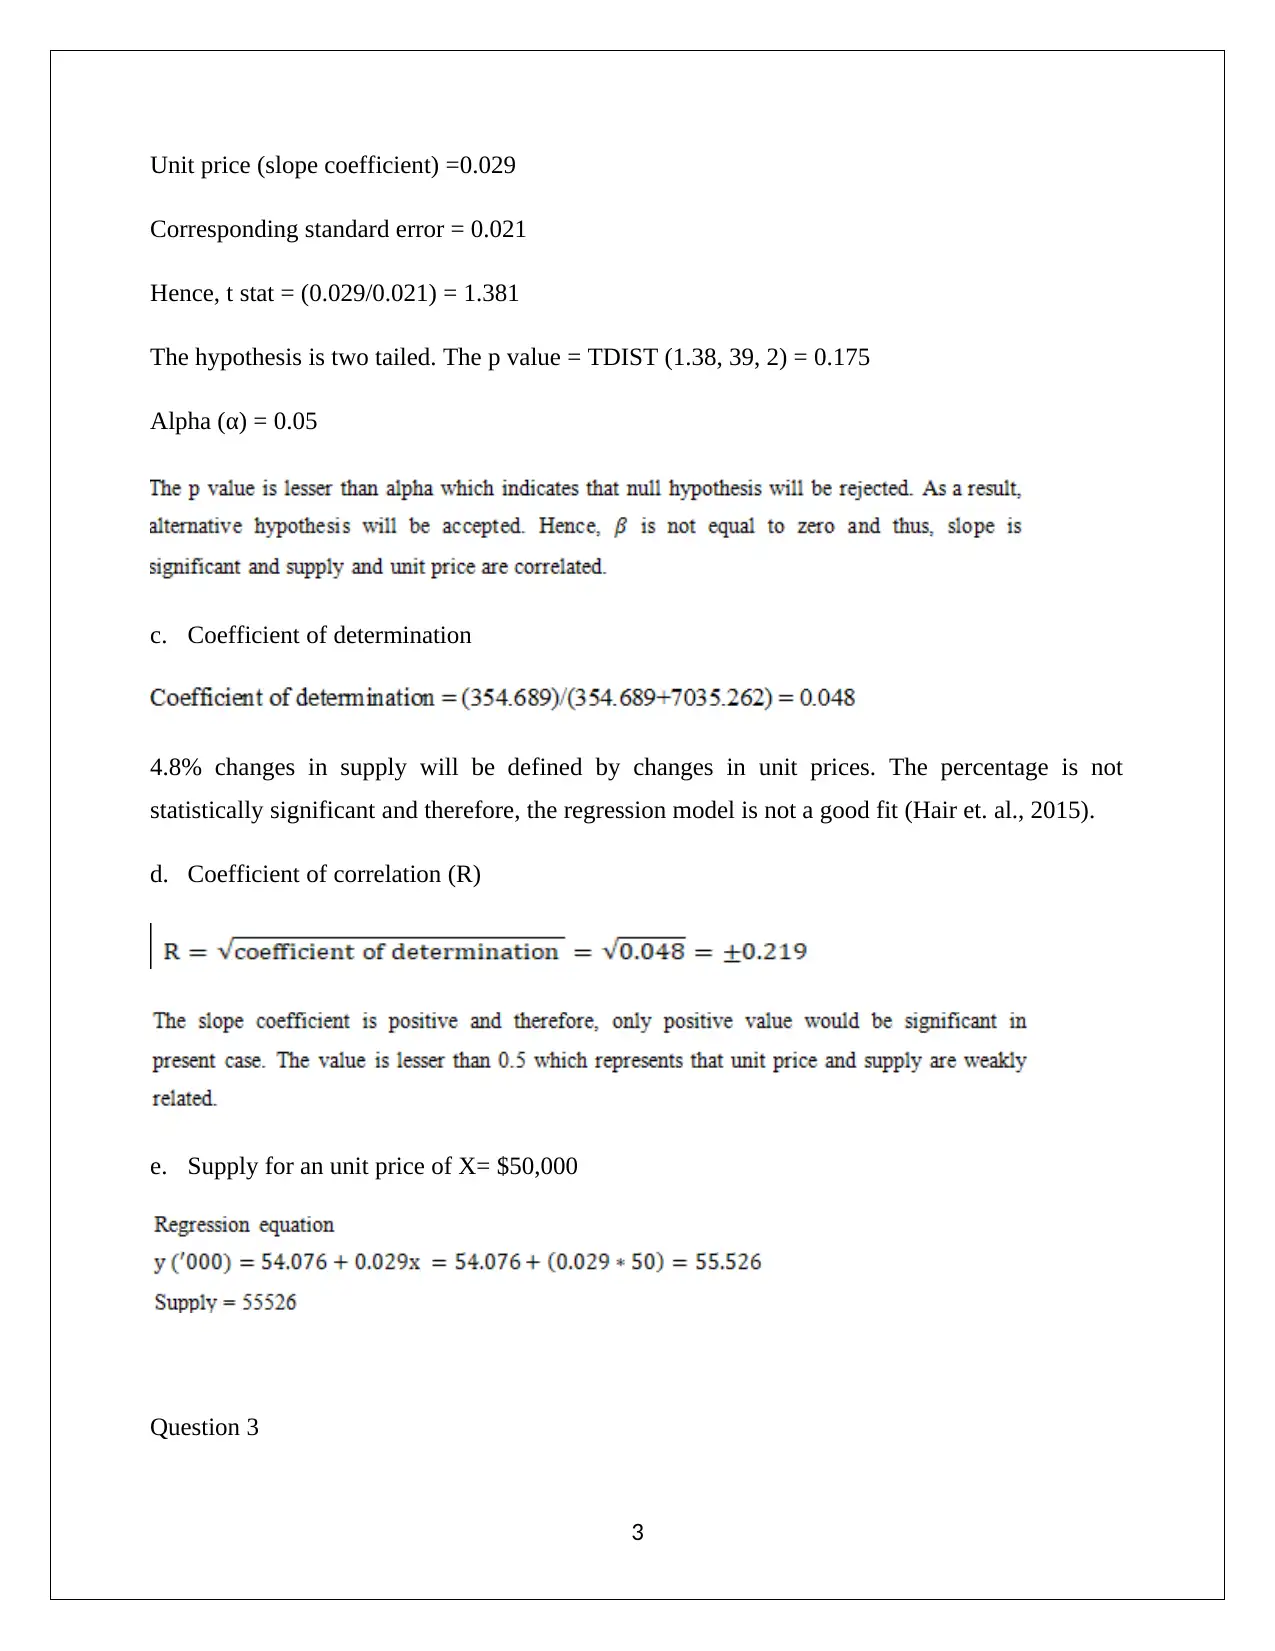
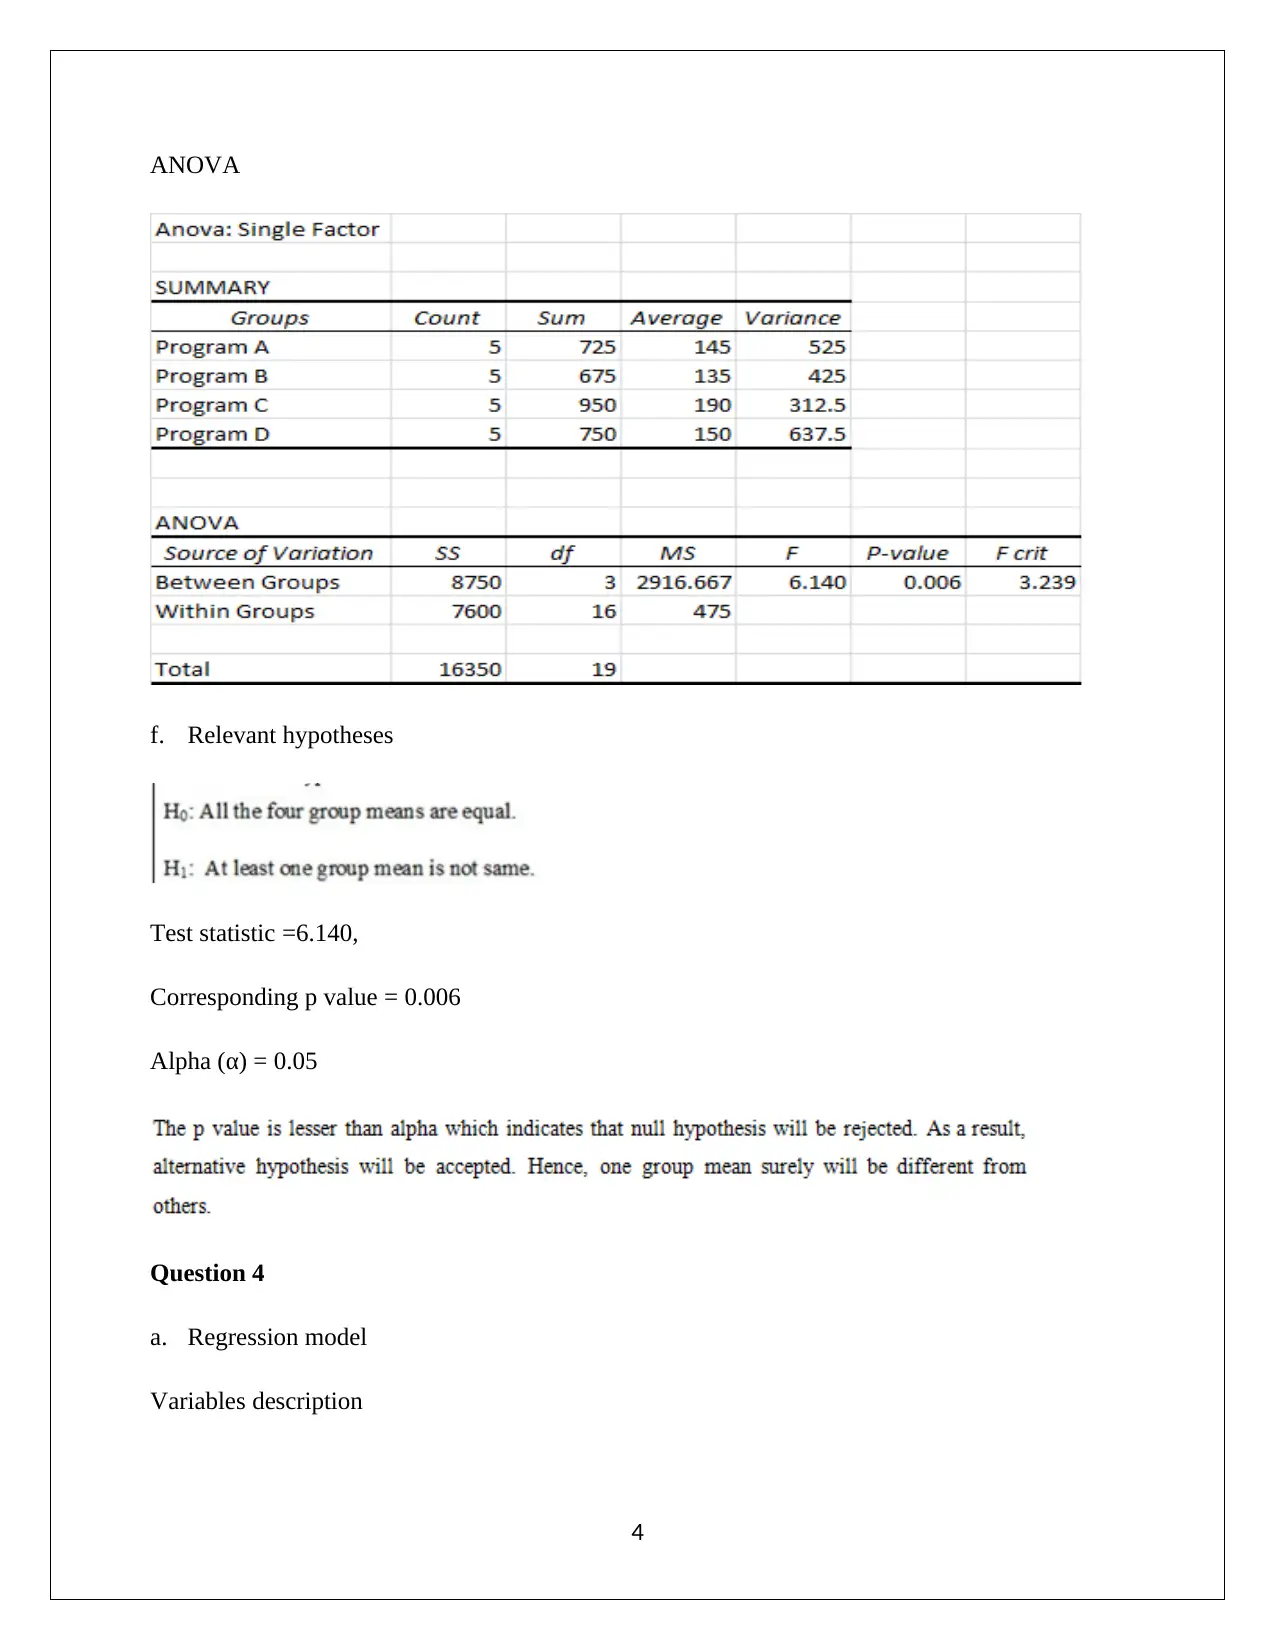
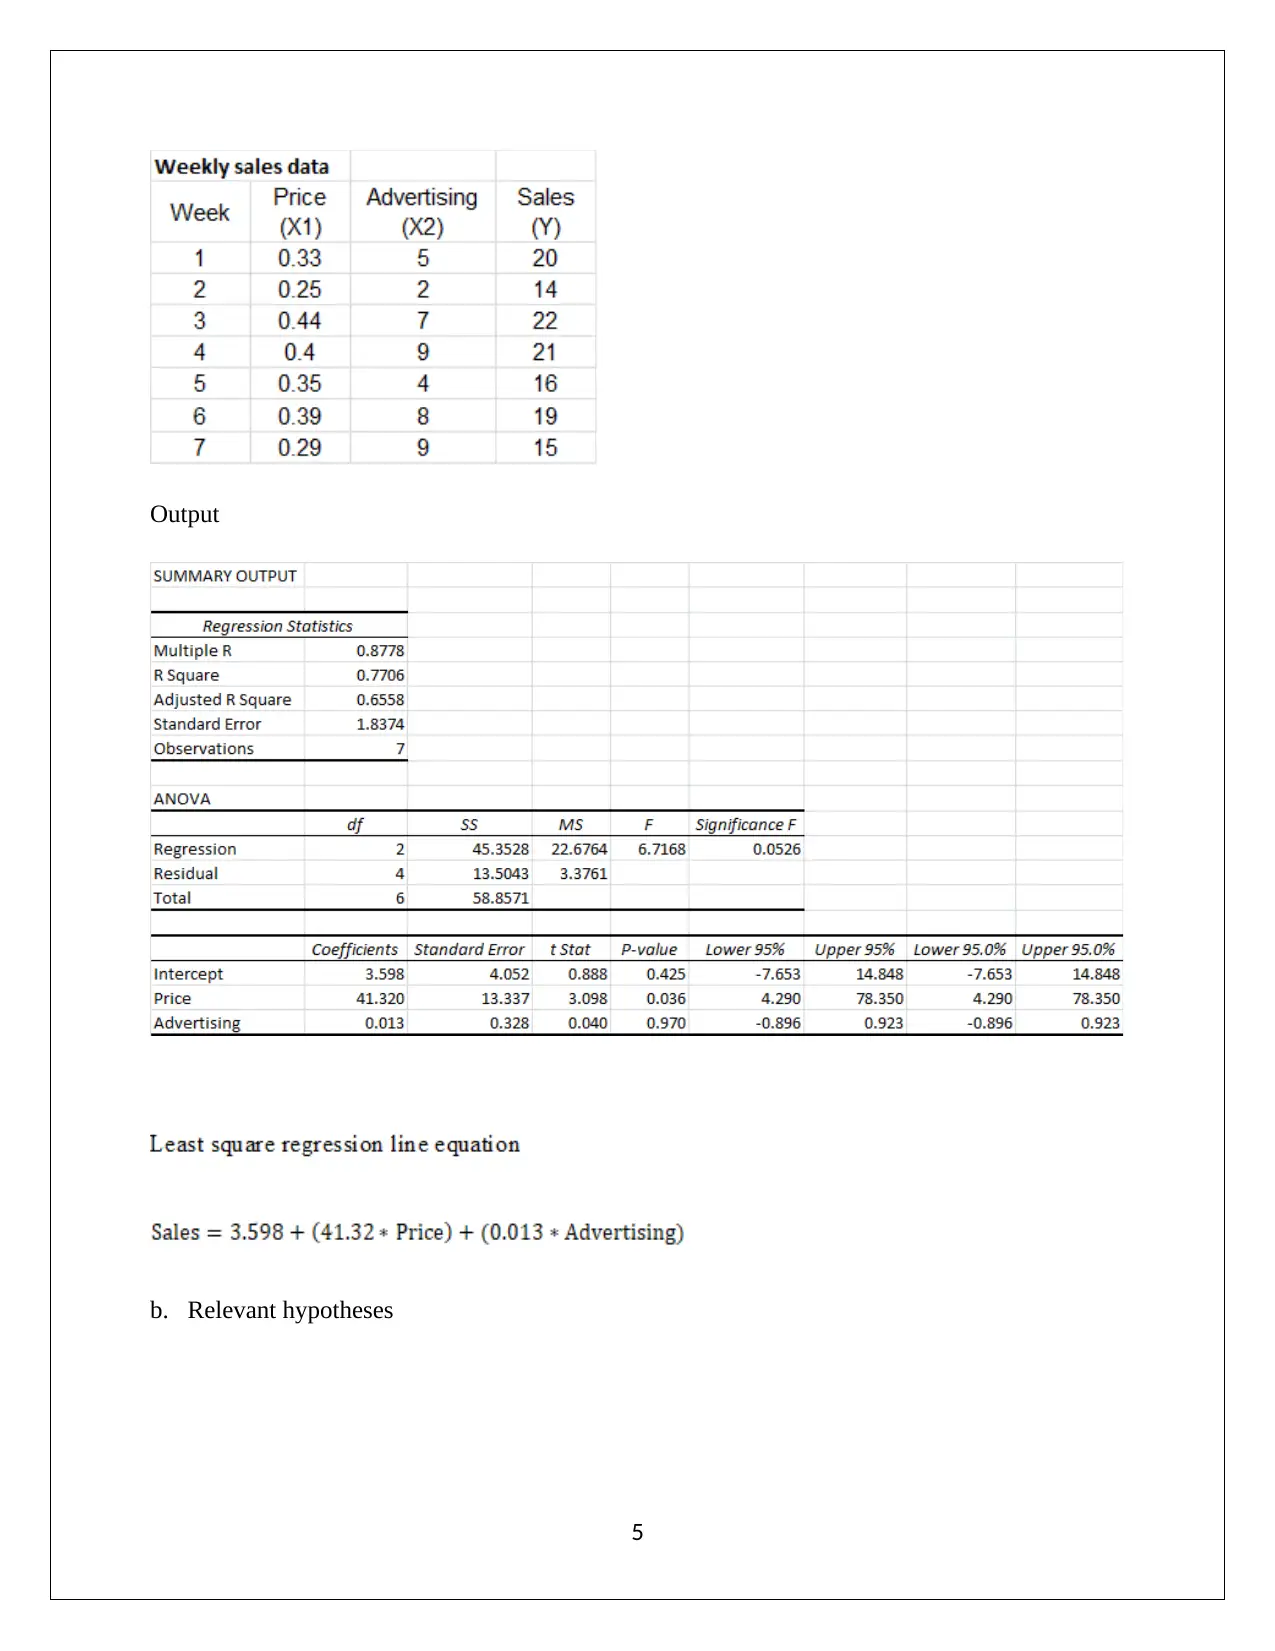
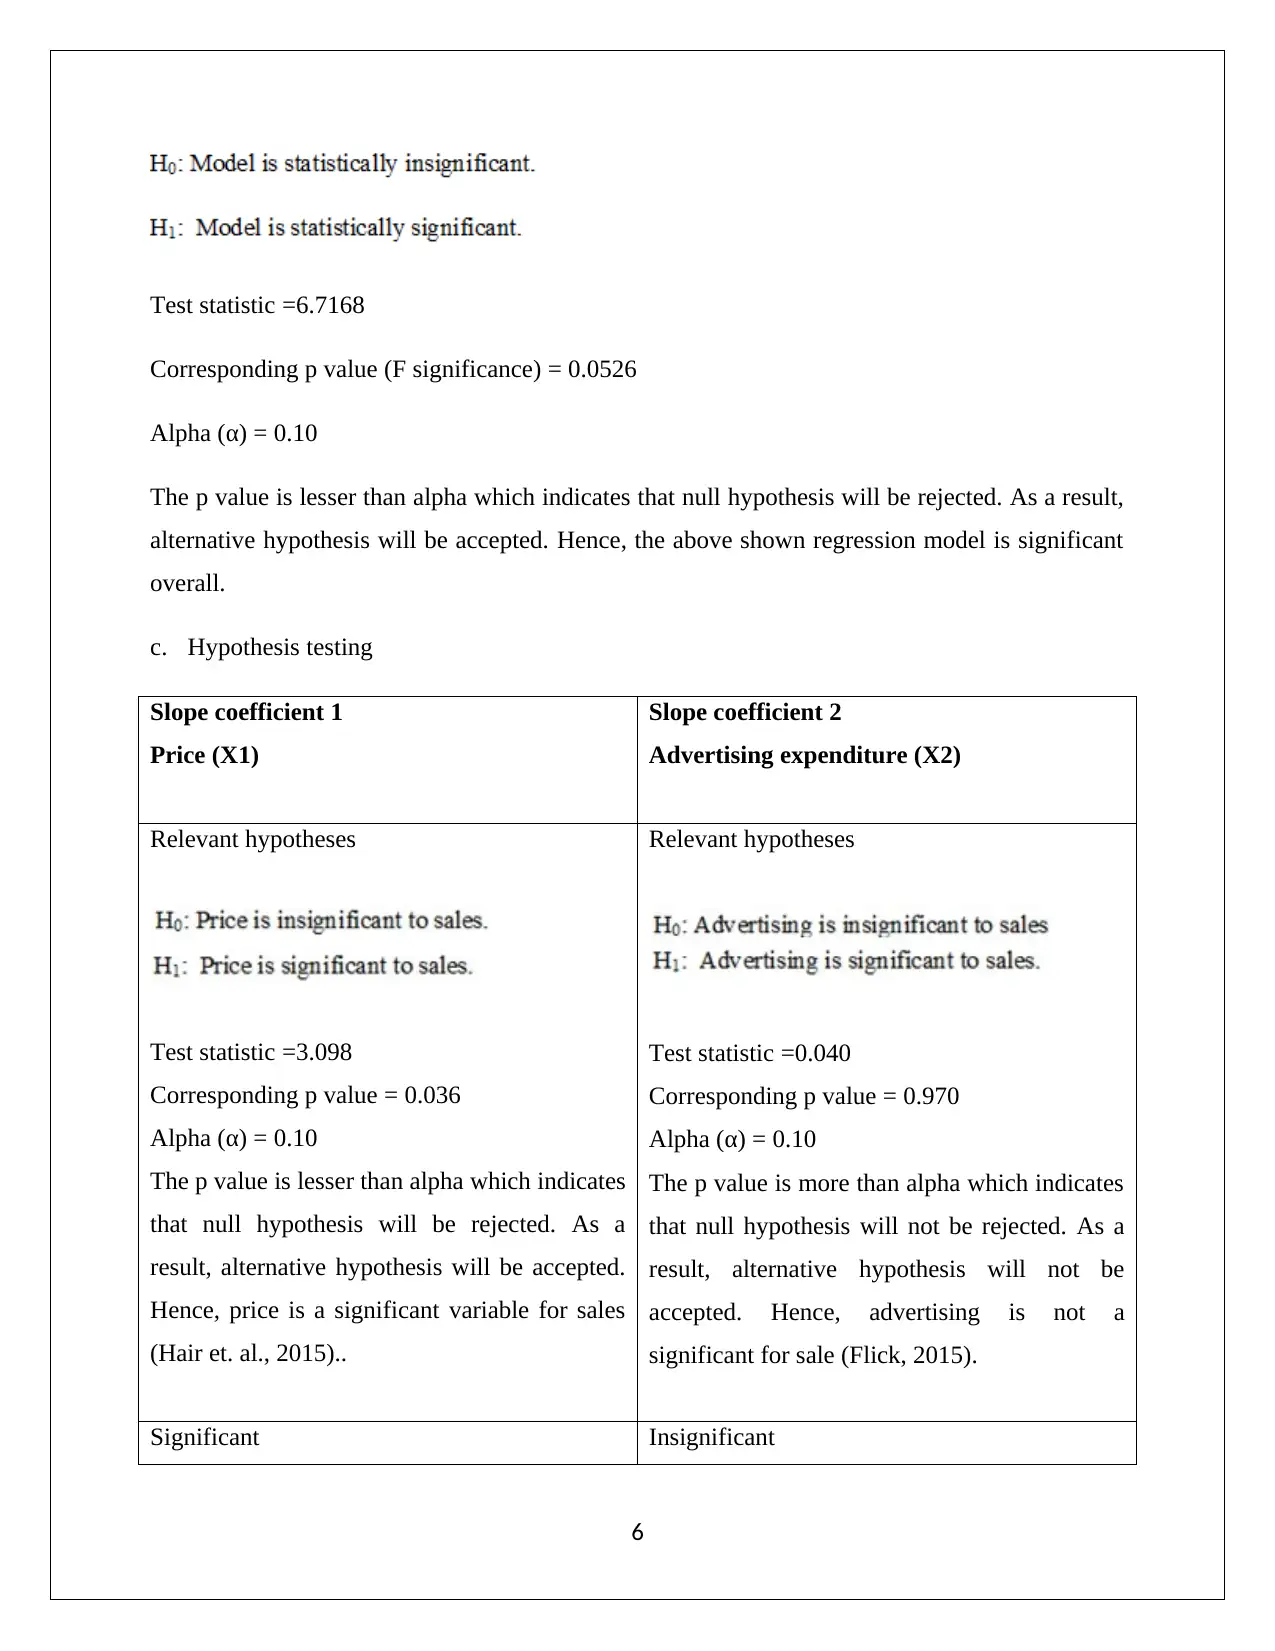
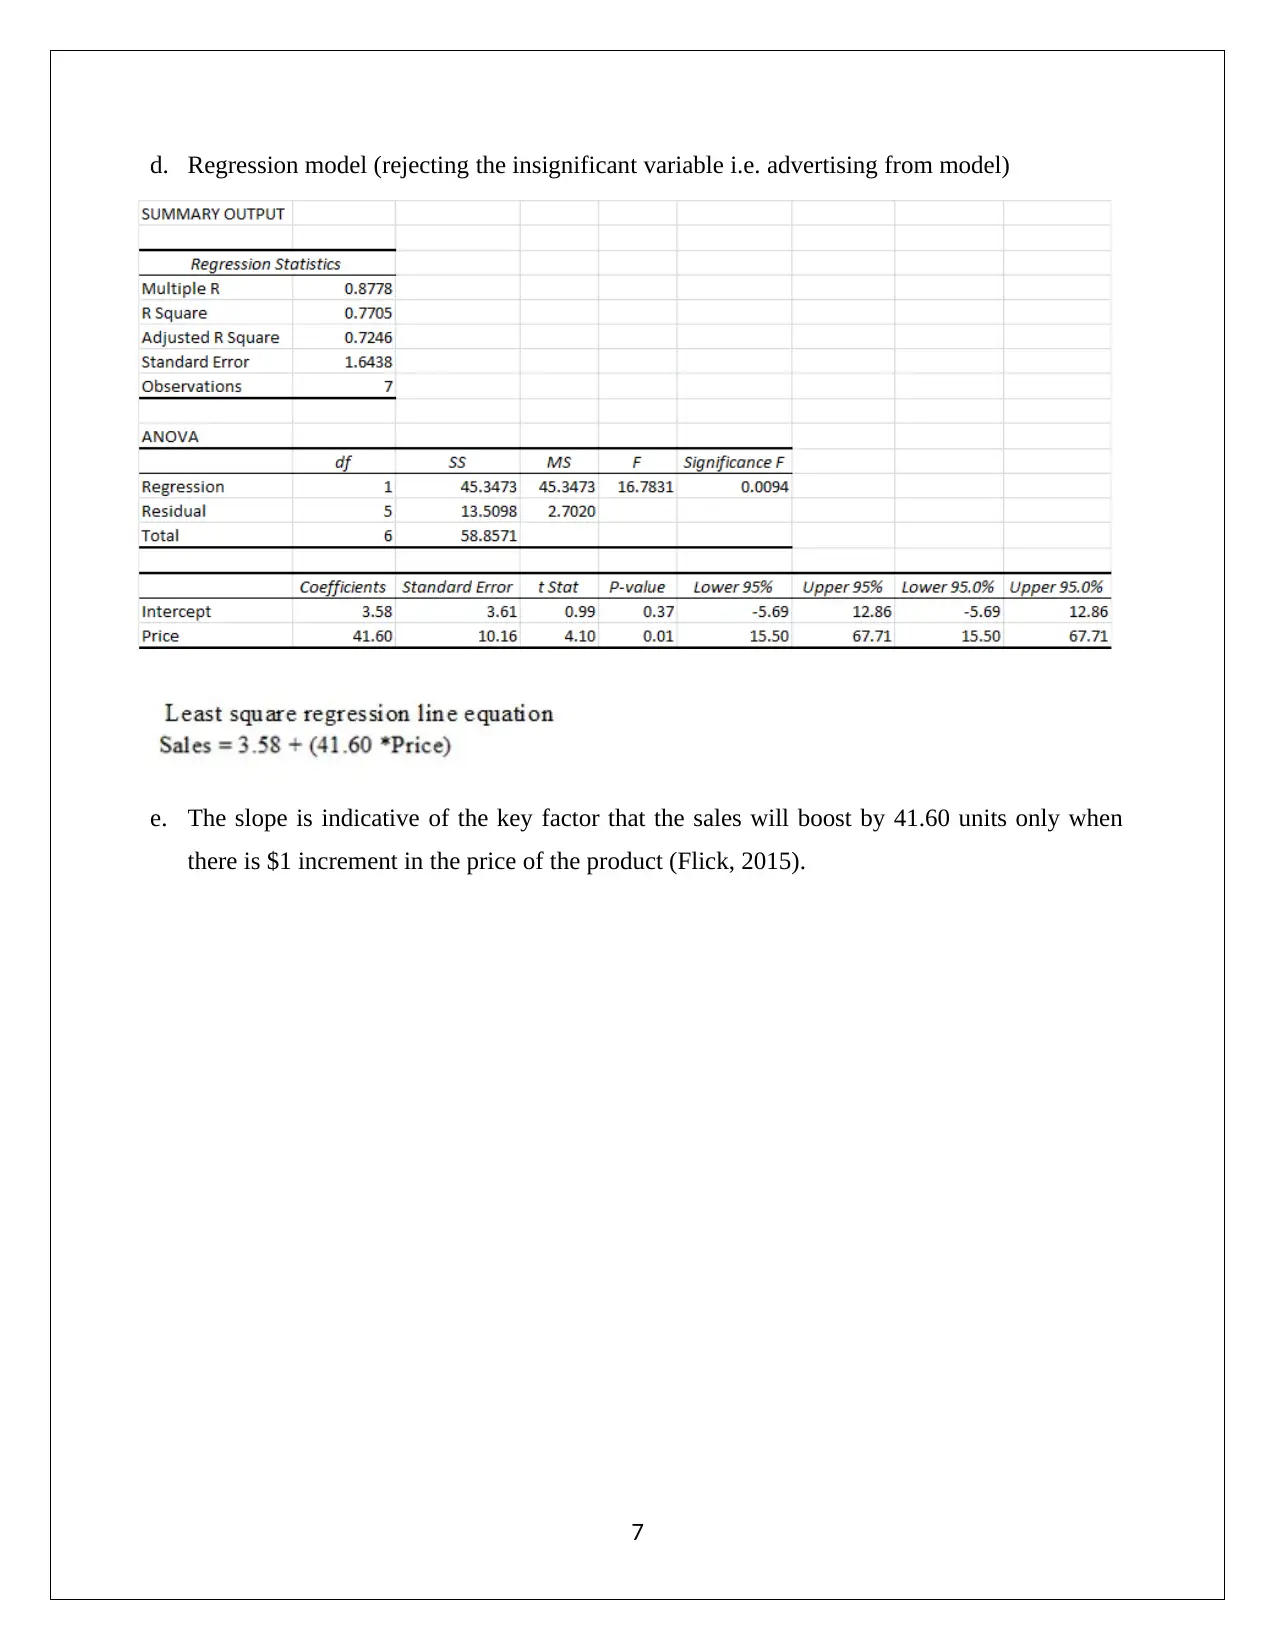
This assignment solution addresses a statistics problem set from Holmes Institute's HI6007 course. The solution begins with constructing frequency distributions, cumulative frequencies, and histograms from a given dataset of examination scores. It then proceeds to analyze regression models, including hypothesis testing for slope coefficients, calculating the coefficient of determination, and interpreting p-values. The assignment covers topics like sample size determination, ANOVA analysis, and the interpretation of regression outputs. The student utilizes MS Excel to perform calculations and graphical presentations, demonstrating a comprehensive understanding of statistical methods and their application to real-world scenarios. The solution also includes relevant references to support the findings and interpretations, providing a well-structured and thoroughly analyzed response to the assignment questions.
tabler-icon-diamond-filled.svg

Contribute Materials

Your contribution can guide someone’s learning journey. Share your documents today.
Document Page
STATISTICS
STUDENT NAME/ID
[Pick the date]
tabler-icon-diamond-filled.svg

Secure Best Marks with AI Grader

Need help grading? Try our AI Grader for instant feedback on your assignments.
Document Page
Question 1
Examination scores
a. Frequency, cumulative frequency, relative frequency, cumulative frequency and percentage
frequency distribution with a class width of 10 for the examination scores is highlighted
below.
b. Histogram
1
Document Page
Skew is apparent as the left tail is shorter than the corresponding value of the right tail. The
skew presence represents that data is not normally distributed (Flick, 2015).
Question 2
a. Sample size (N) = Degree of freedom (dof) +1
Degree of freedom (dof) = 39+1 = 40
Hence,
Sample size (N) = 40 +1 = 41
Therefore, the sample size for the given scenario is 41.
b. Relevant hypotheses
2
Document Page
Unit price (slope coefficient) =0.029
Corresponding standard error = 0.021
Hence, t stat = (0.029/0.021) = 1.381
The hypothesis is two tailed. The p value = TDIST (1.38, 39, 2) = 0.175
Alpha (α) = 0.05
c. Coefficient of determination
4.8% changes in supply will be defined by changes in unit prices. The percentage is not
statistically significant and therefore, the regression model is not a good fit (Hair et. al., 2015).
d. Coefficient of correlation (R)
e. Supply for an unit price of X= $50,000
Question 3
3
tabler-icon-diamond-filled.svg

Secure Best Marks with AI Grader

Need help grading? Try our AI Grader for instant feedback on your assignments.
Document Page
ANOVA
f. Relevant hypotheses
Test statistic =6.140,
Corresponding p value = 0.006
Alpha (α) = 0.05
Question 4
a. Regression model
Variables description
4
Document Page
Output
b. Relevant hypotheses
5
Document Page
Test statistic =6.7168
Corresponding p value (F significance) = 0.0526
Alpha (α) = 0.10
The p value is lesser than alpha which indicates that null hypothesis will be rejected. As a result,
alternative hypothesis will be accepted. Hence, the above shown regression model is significant
overall.
c. Hypothesis testing
Slope coefficient 1
Price (X1)
Slope coefficient 2
Advertising expenditure (X2)
Relevant hypotheses
Test statistic =3.098
Corresponding p value = 0.036
Alpha (α) = 0.10
The p value is lesser than alpha which indicates
that null hypothesis will be rejected. As a
result, alternative hypothesis will be accepted.
Hence, price is a significant variable for sales
(Hair et. al., 2015)..
Relevant hypotheses
Test statistic =0.040
Corresponding p value = 0.970
Alpha (α) = 0.10
The p value is more than alpha which indicates
that null hypothesis will not be rejected. As a
result, alternative hypothesis will not be
accepted. Hence, advertising is not a
significant for sale (Flick, 2015).
Significant Insignificant
6
tabler-icon-diamond-filled.svg

Paraphrase This Document

Need a fresh take? Get an instant paraphrase of this document with our AI Paraphraser
Document Page
d. Regression model (rejecting the insignificant variable i.e. advertising from model)
e. The slope is indicative of the key factor that the sales will boost by 41.60 units only when
there is $1 increment in the price of the product (Flick, 2015).
7
Document Page
Reference
Flick, U. (2015) Introducing research methodology: A beginner's guide to doing a research
project. 4th ed. New York: Sage Publications.
Hair, J. F., Wolfinbarger, M., Money, A. H., Samouel, P., and Page, M. J. (2016) Essentials of
business research methods. 2nd ed. New York: Routledge.
8
chevron_up_icon
1 out of 9
circle_padding
hide_on_mobile
zoom_out_icon
logo.png

Your All-in-One AI-Powered Toolkit for Academic Success.

Available 24*7 on WhatsApp / Email

[object Object]