STAT6003 Statistics for Financial Decisions: House Price Index
VerifiedAdded on 2023/06/09
|15
|931
|156
Homework Assignment
AI Summary
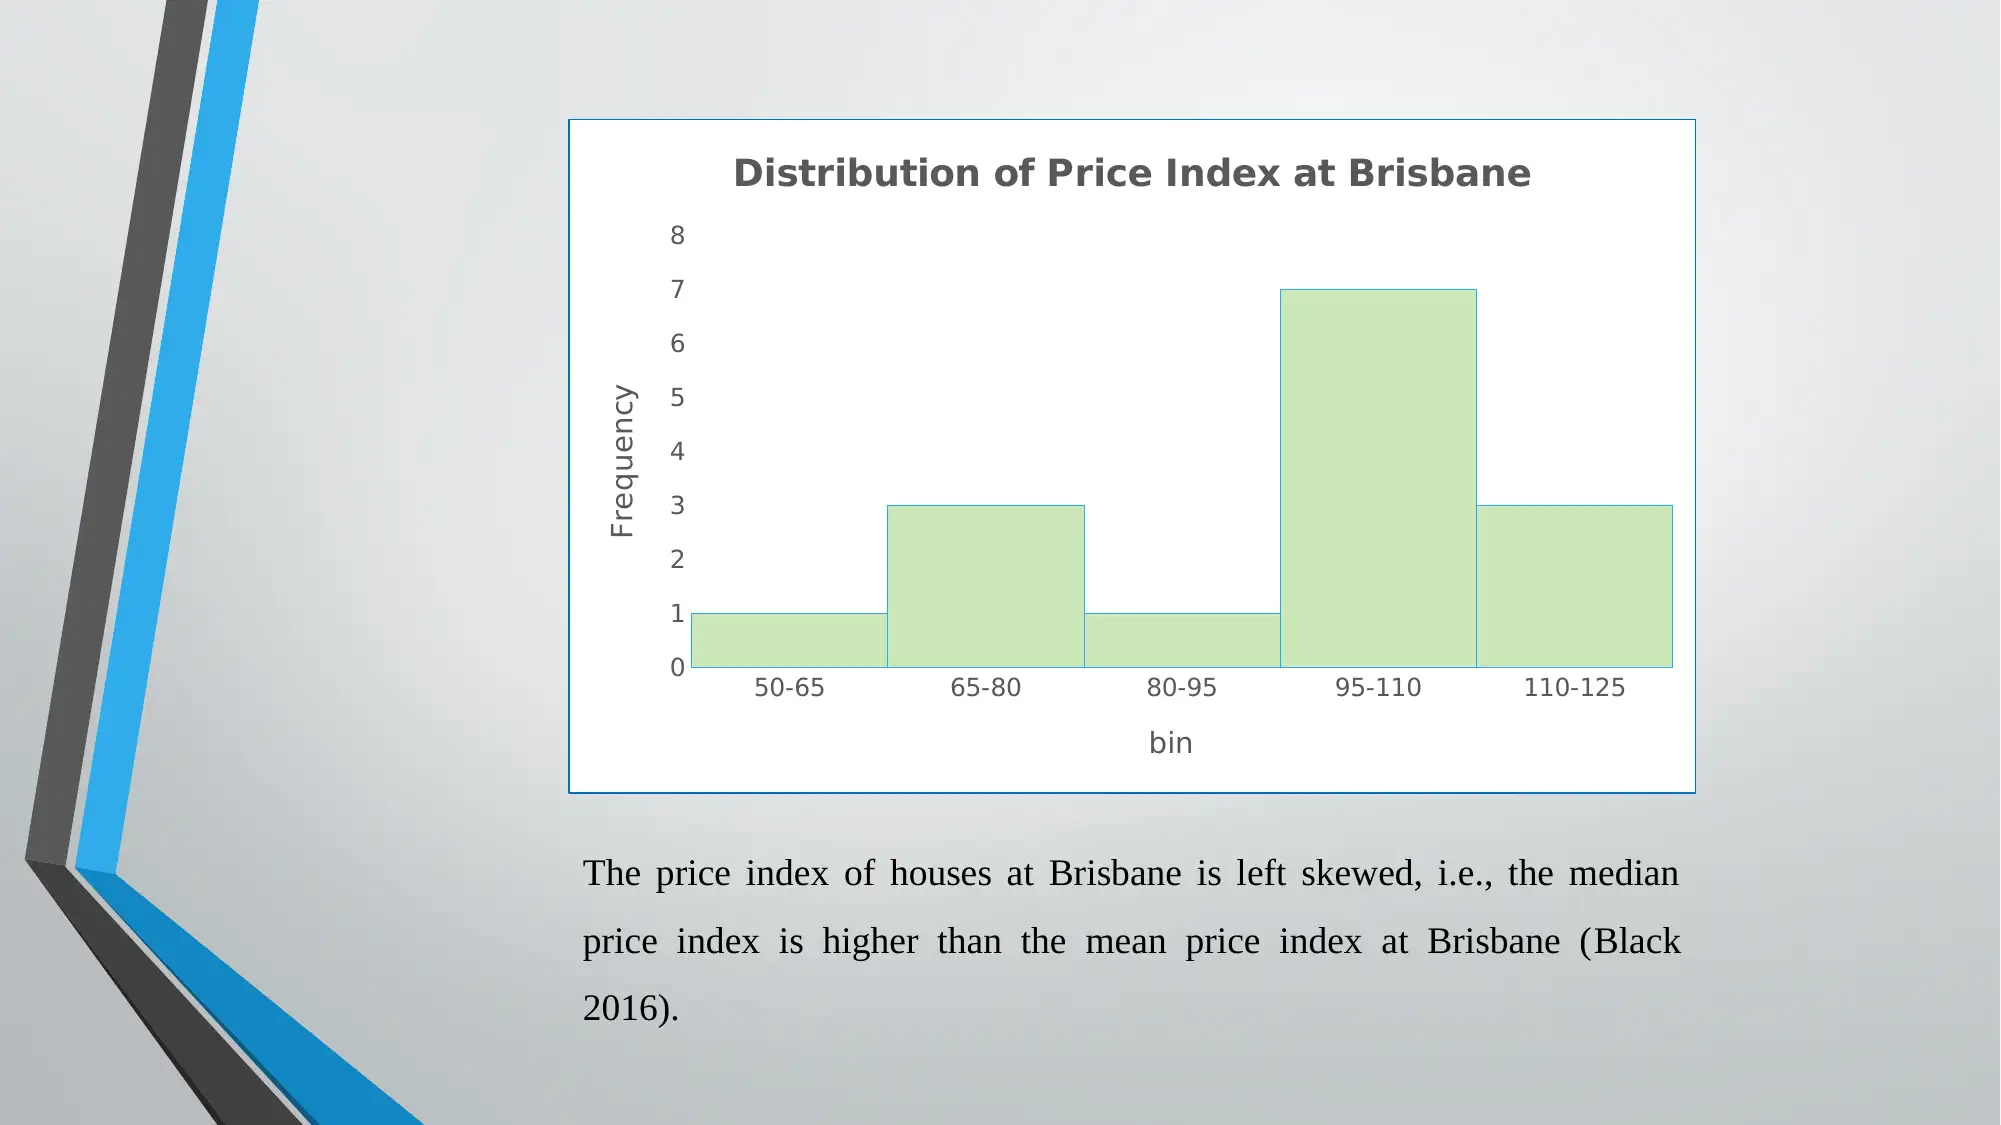
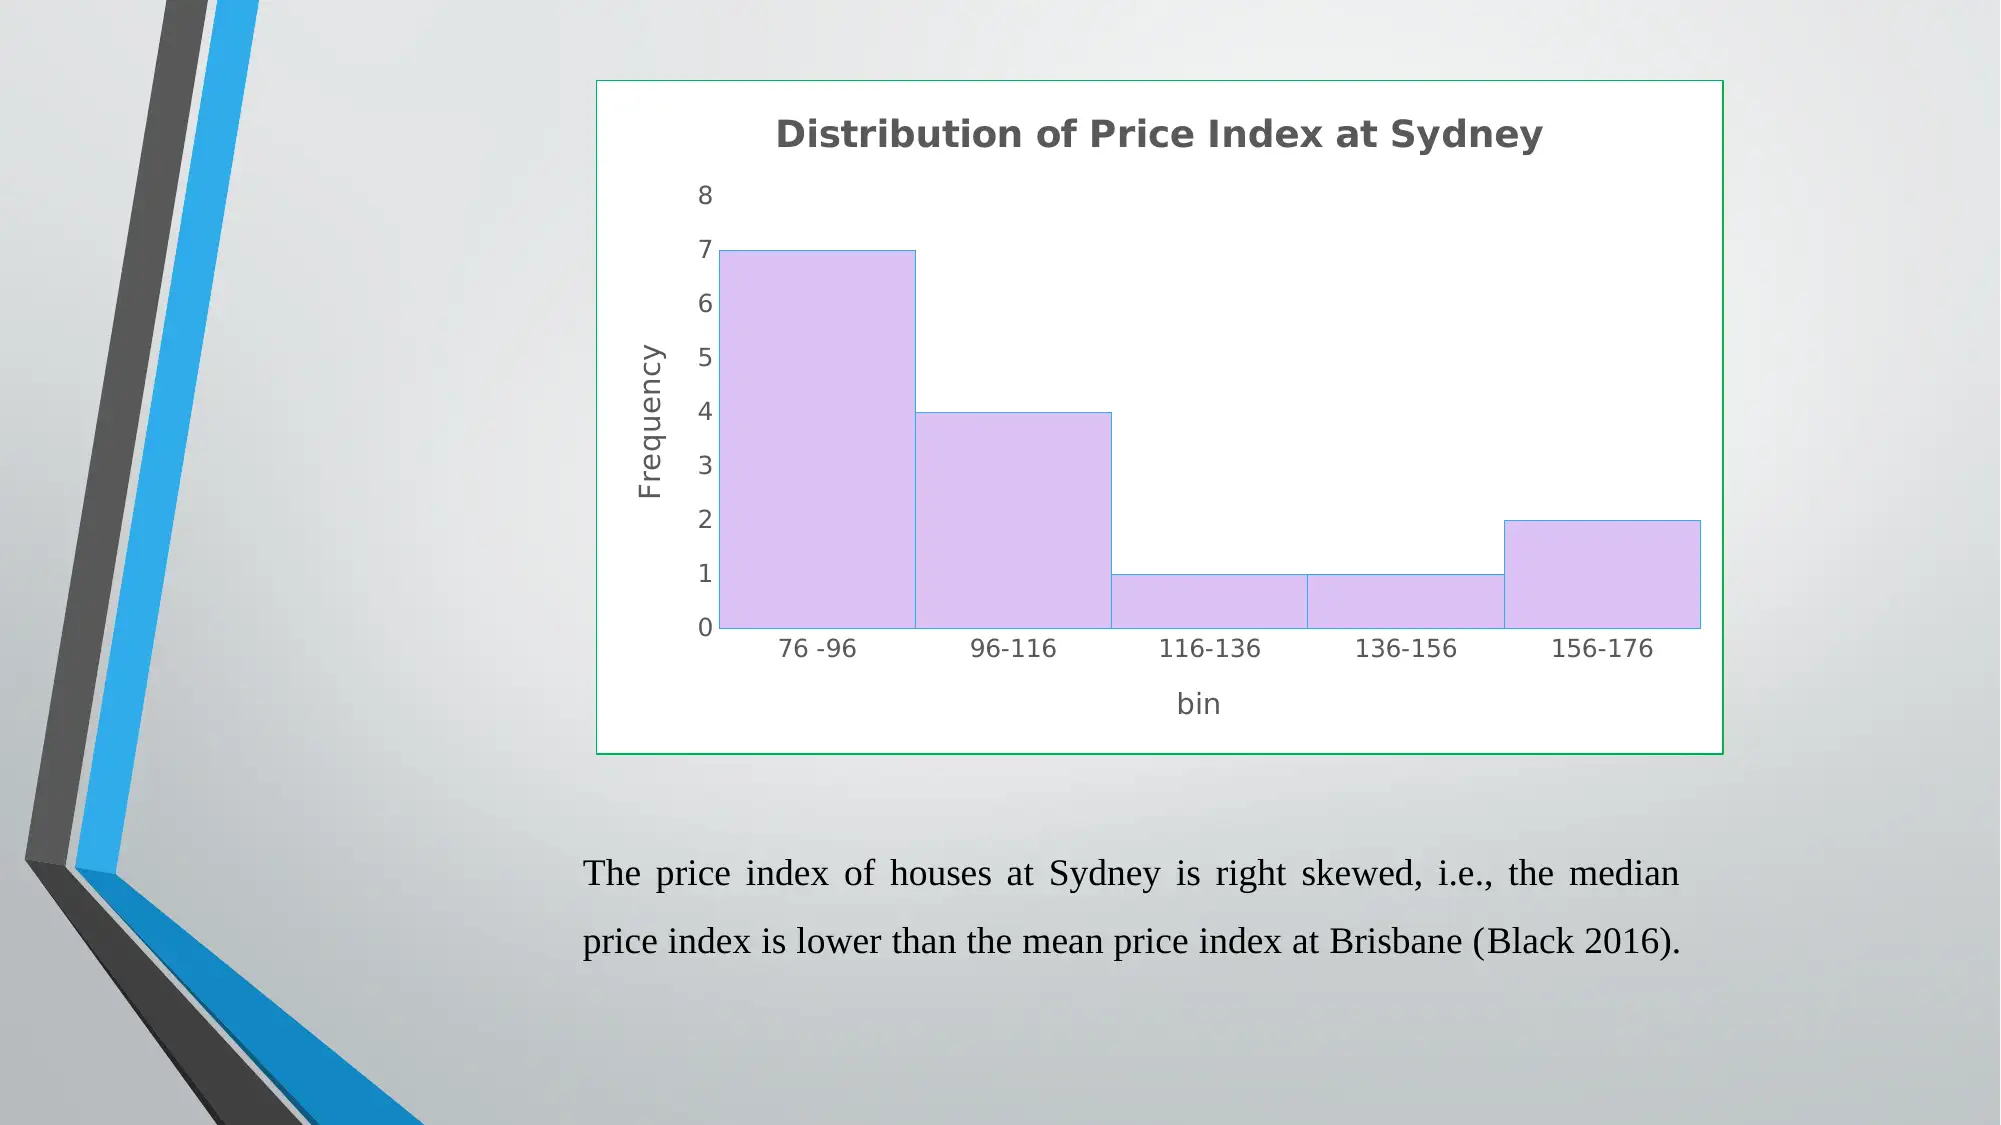
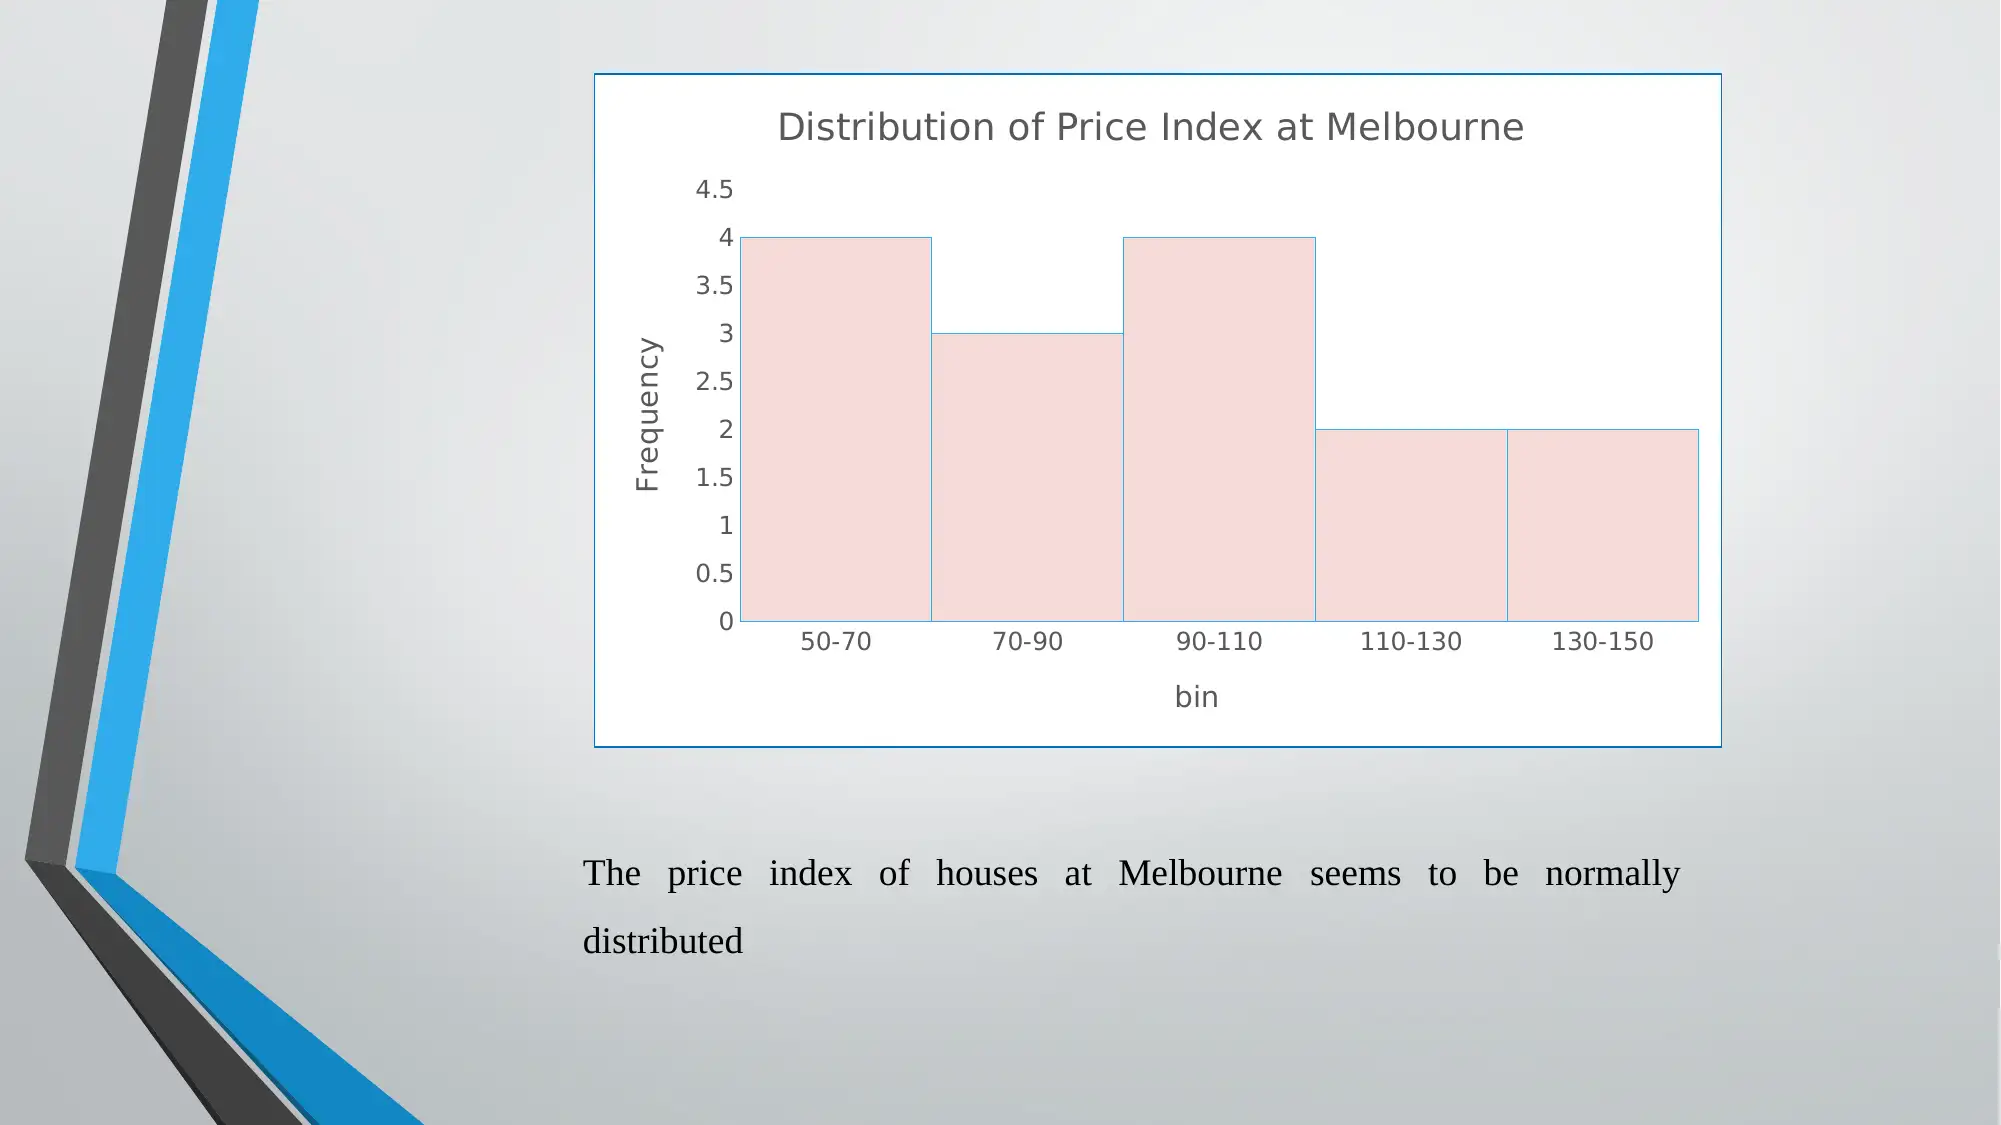
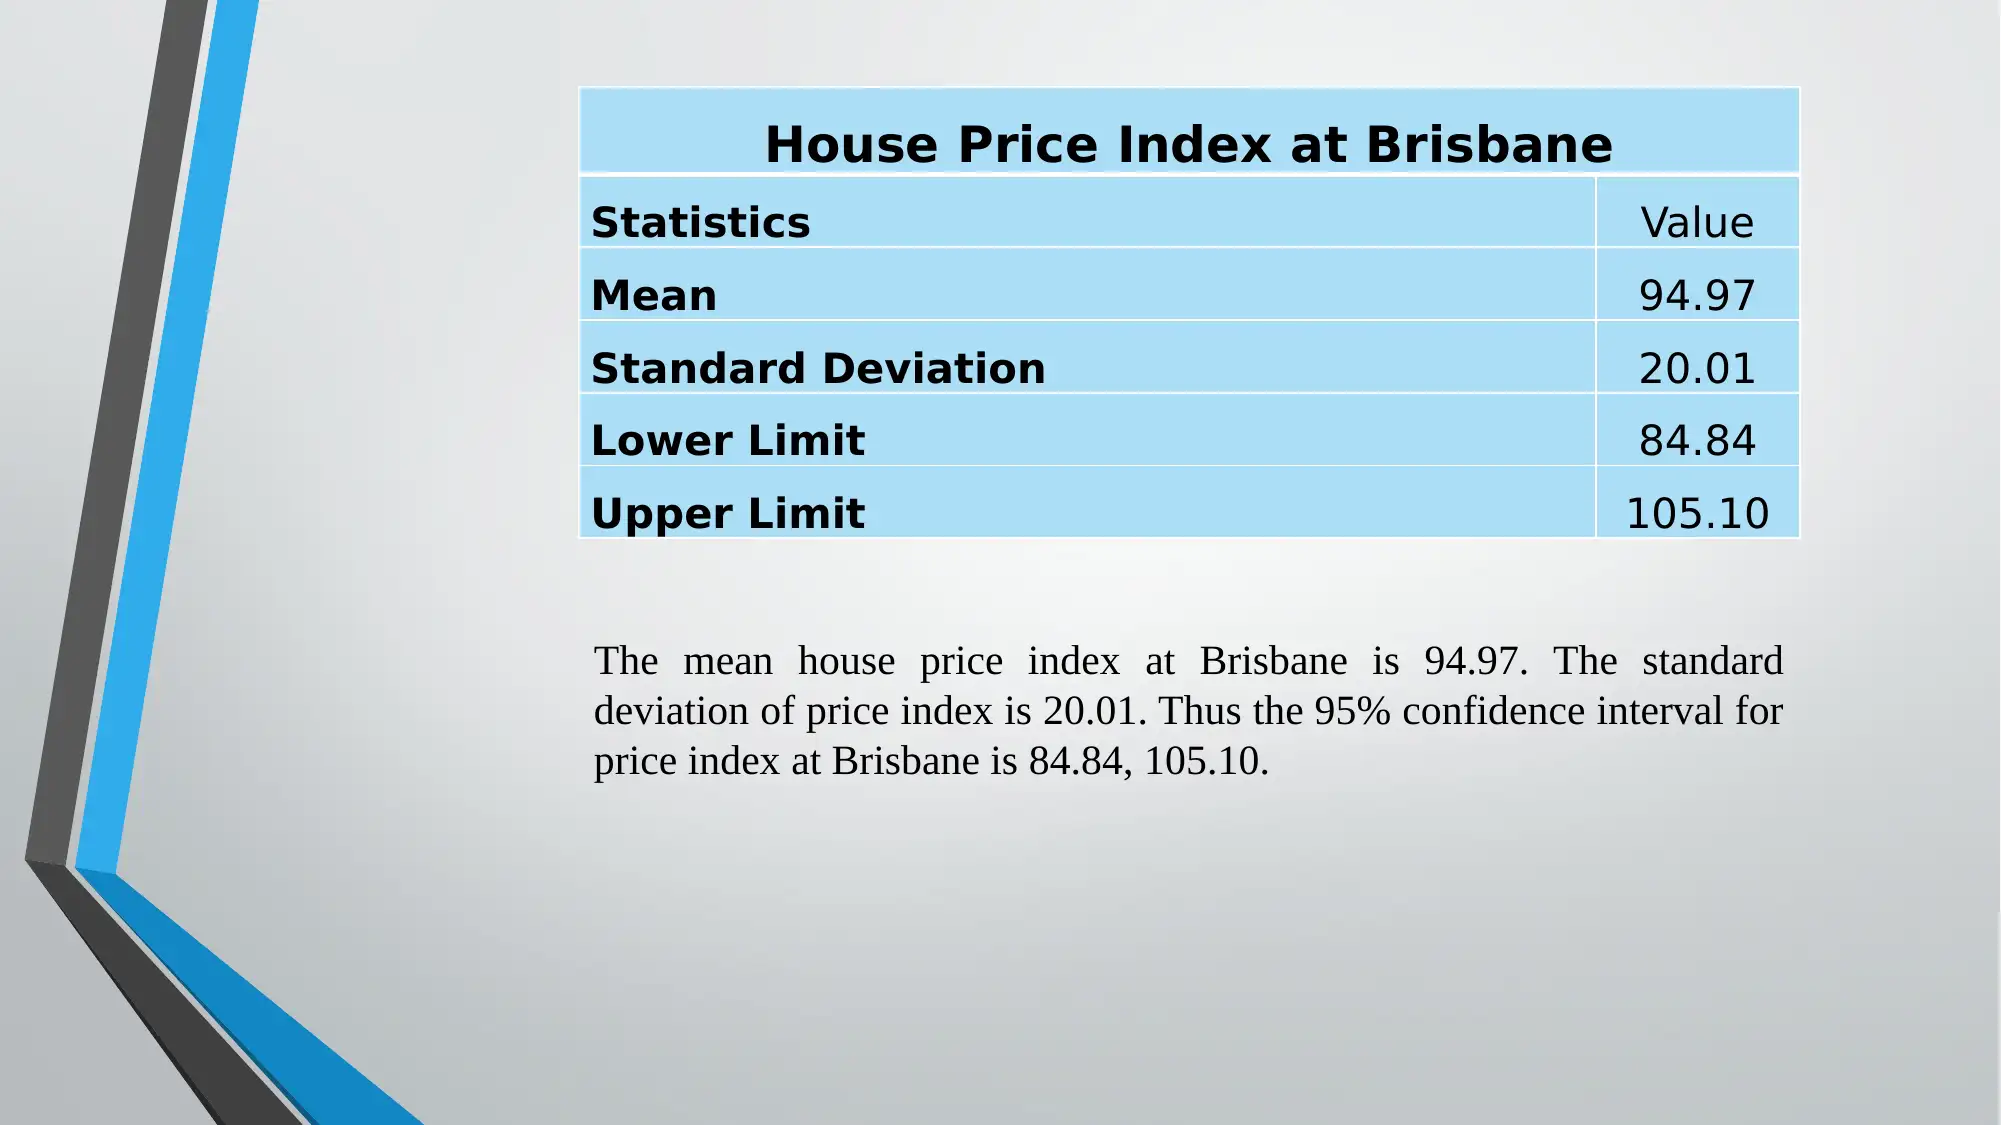
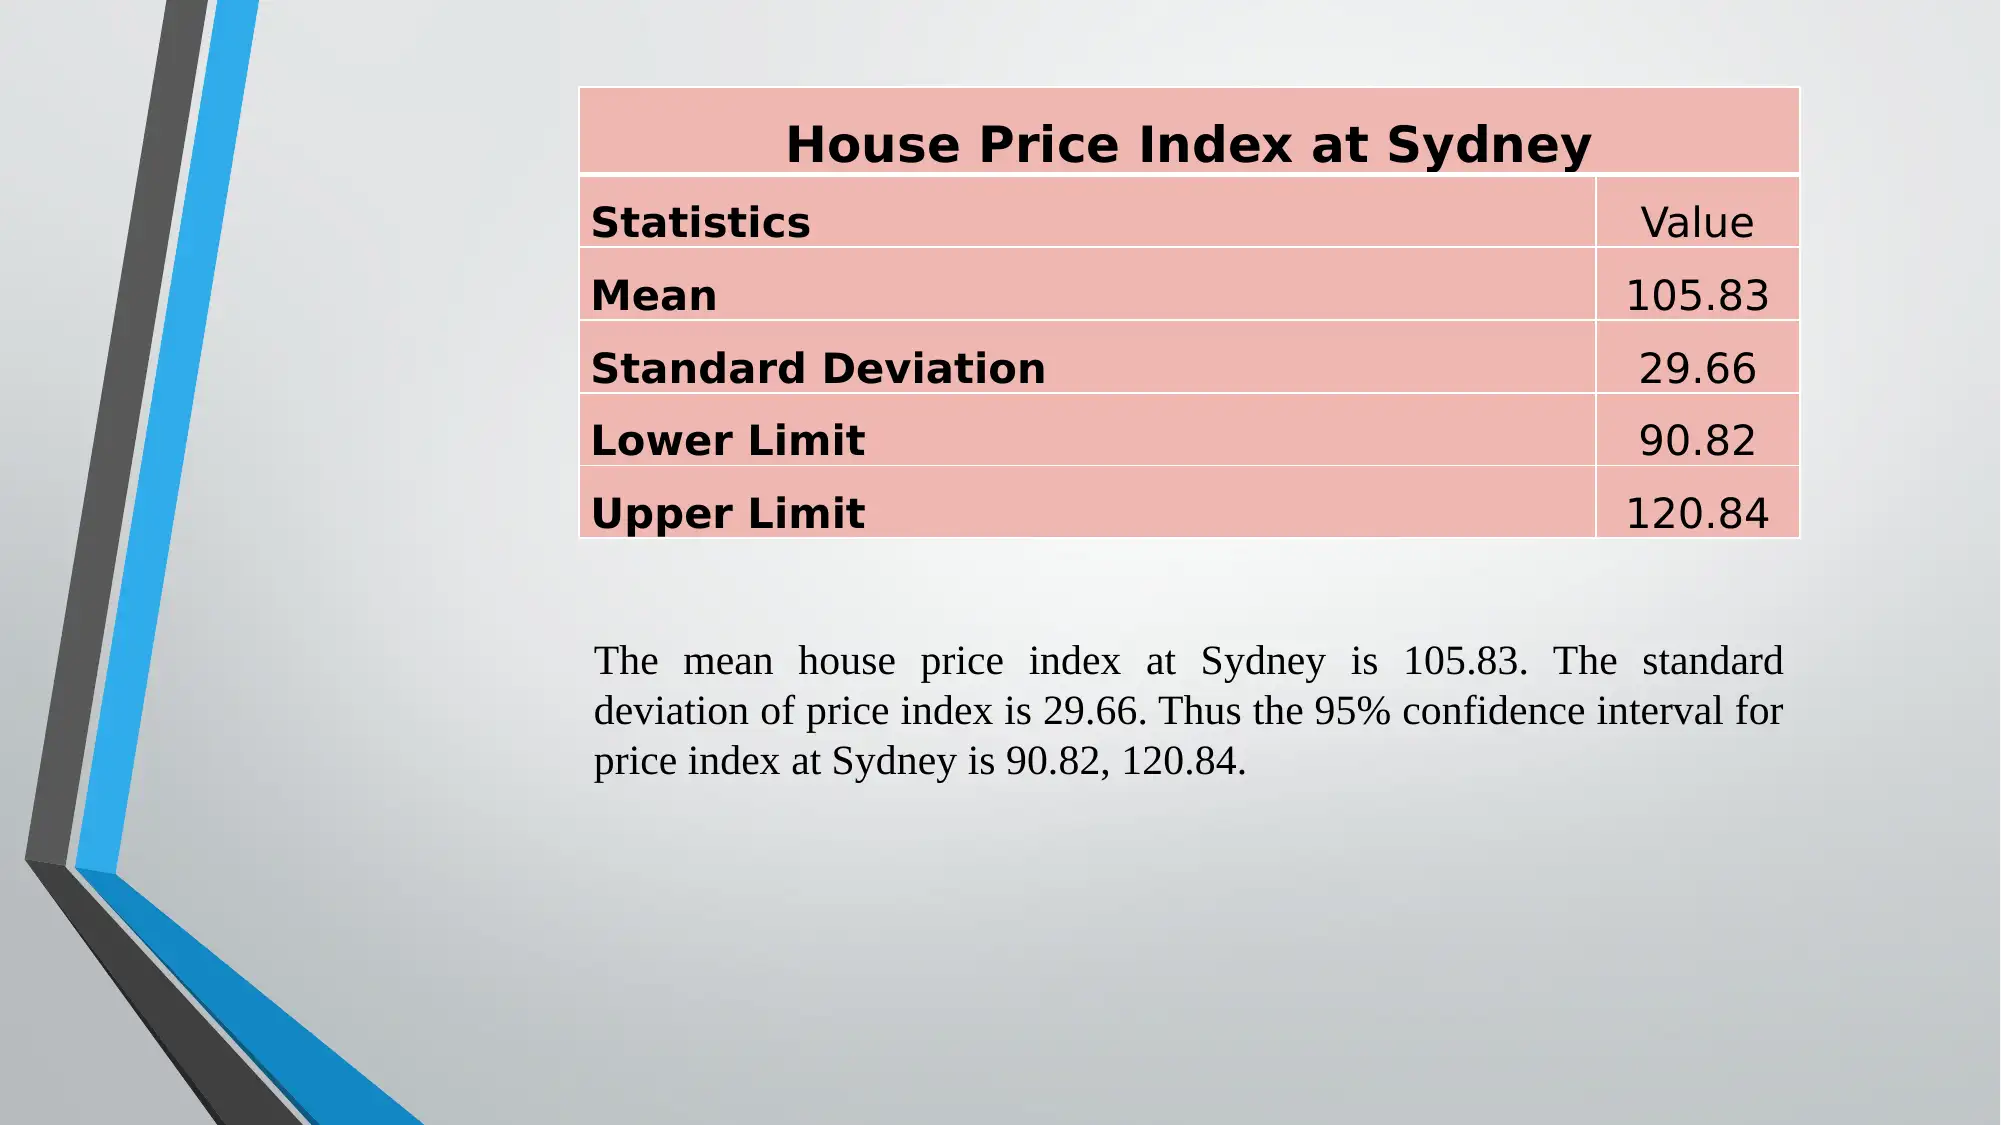
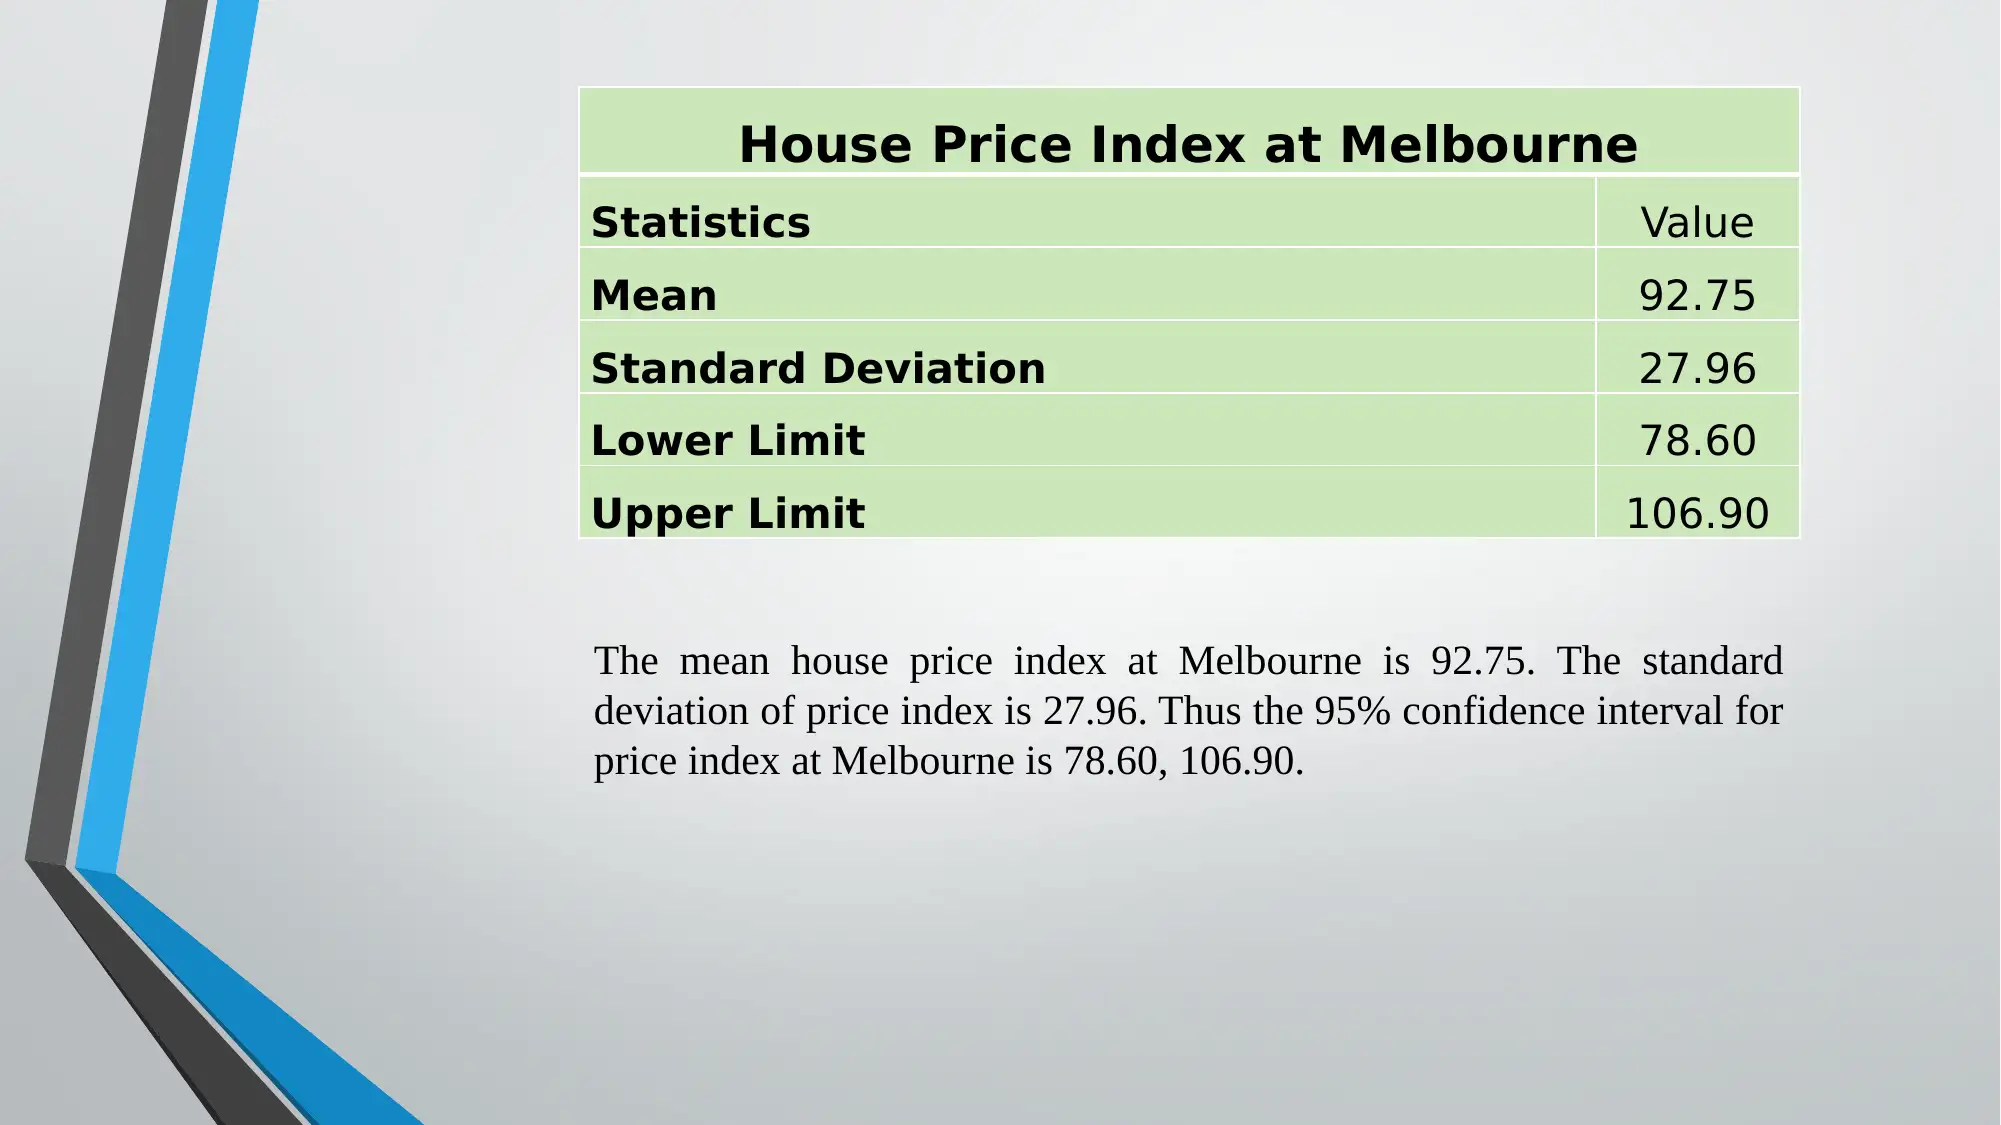
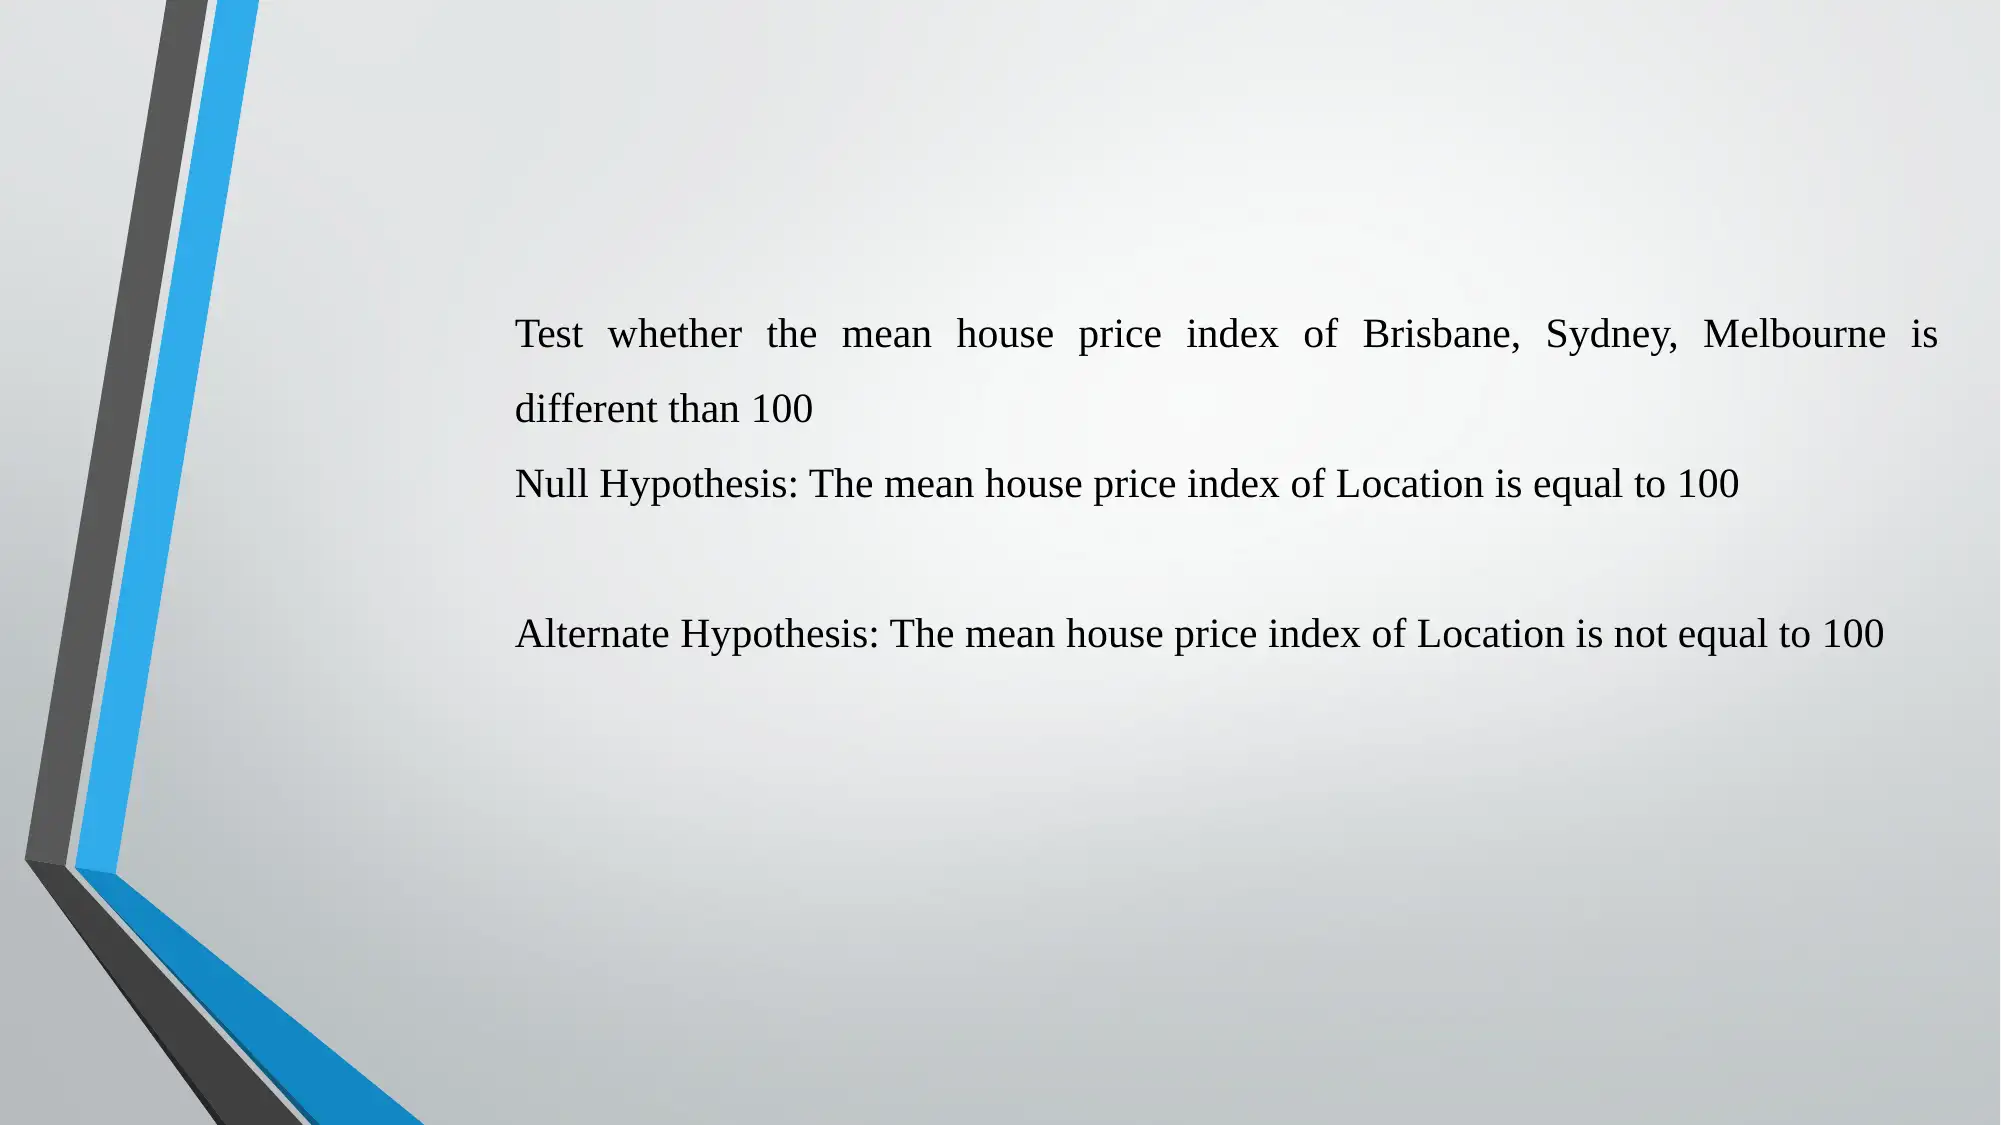
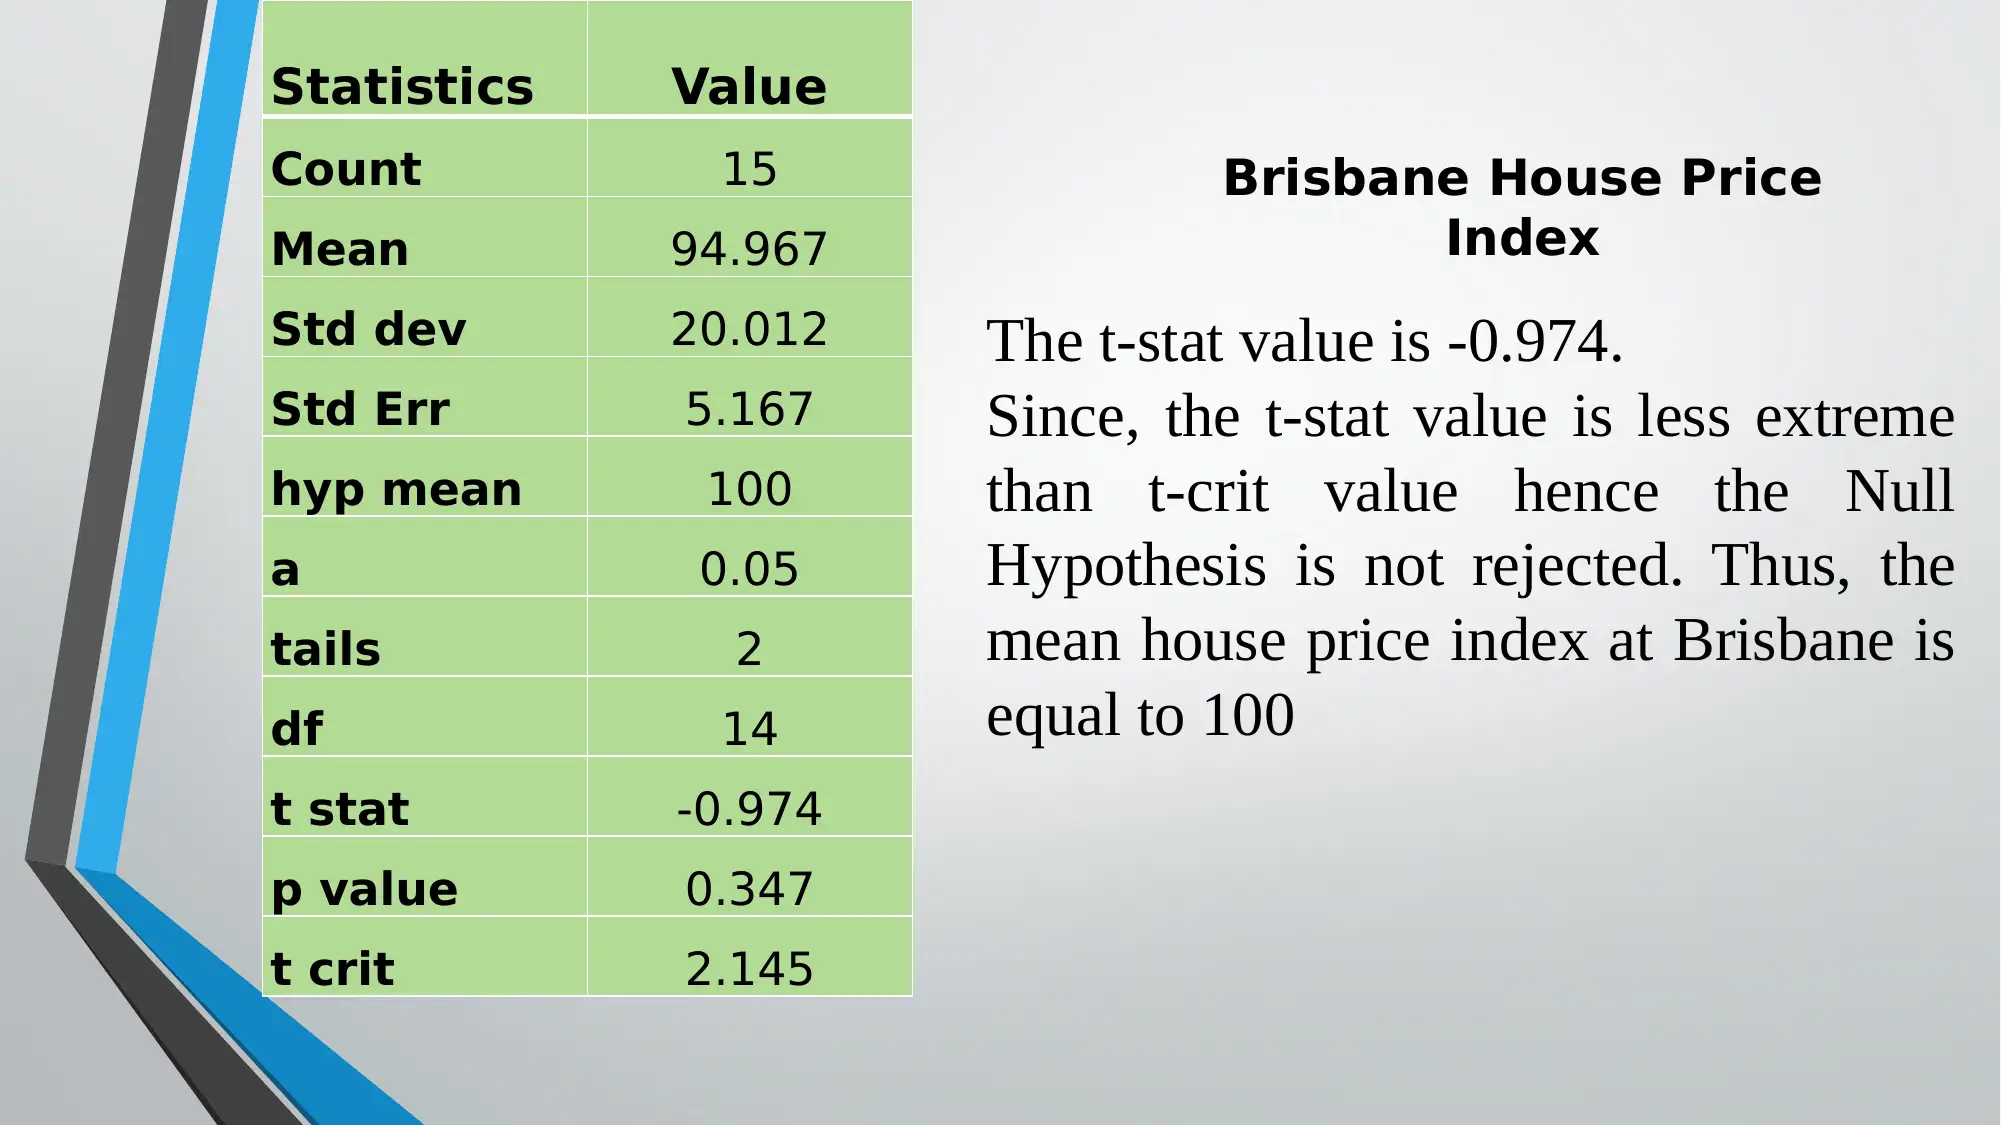
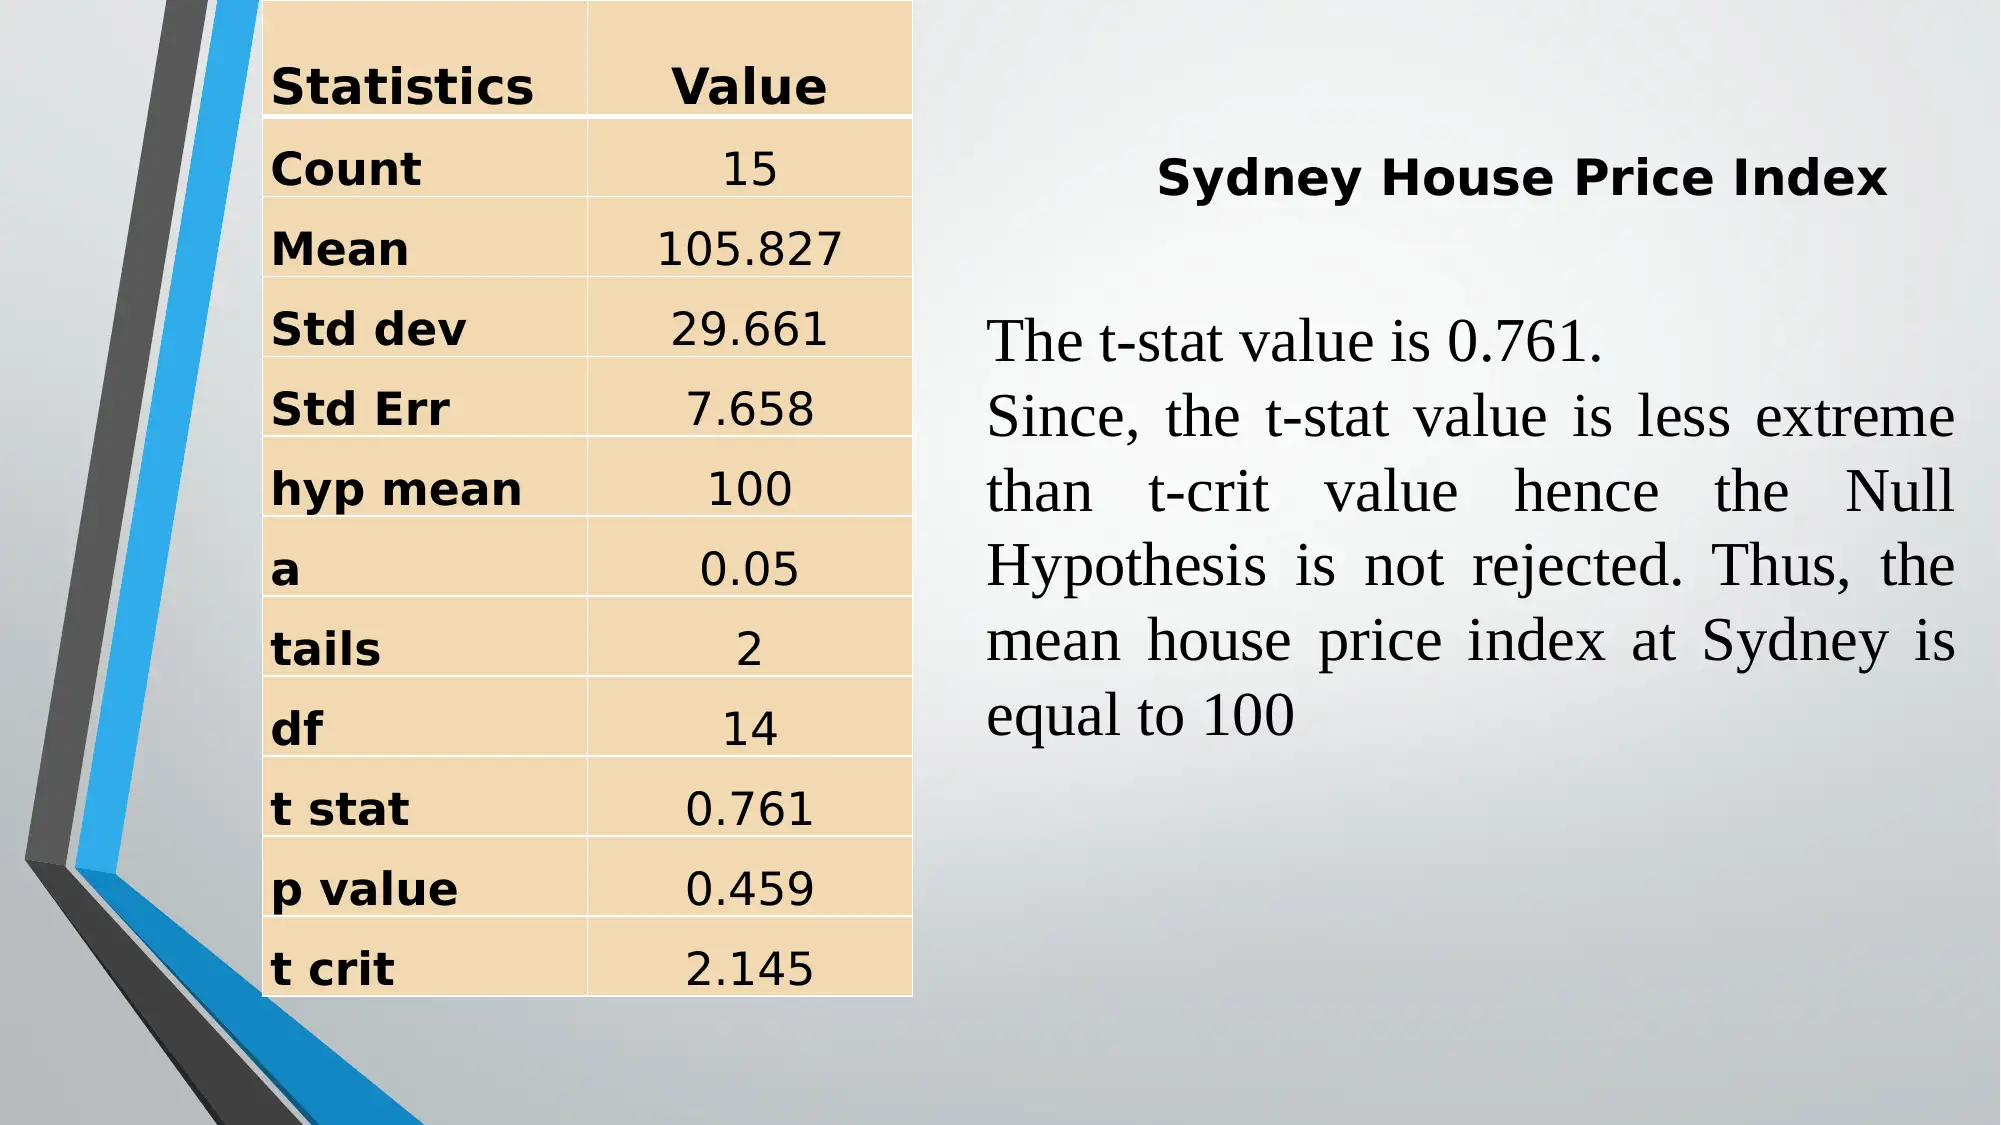
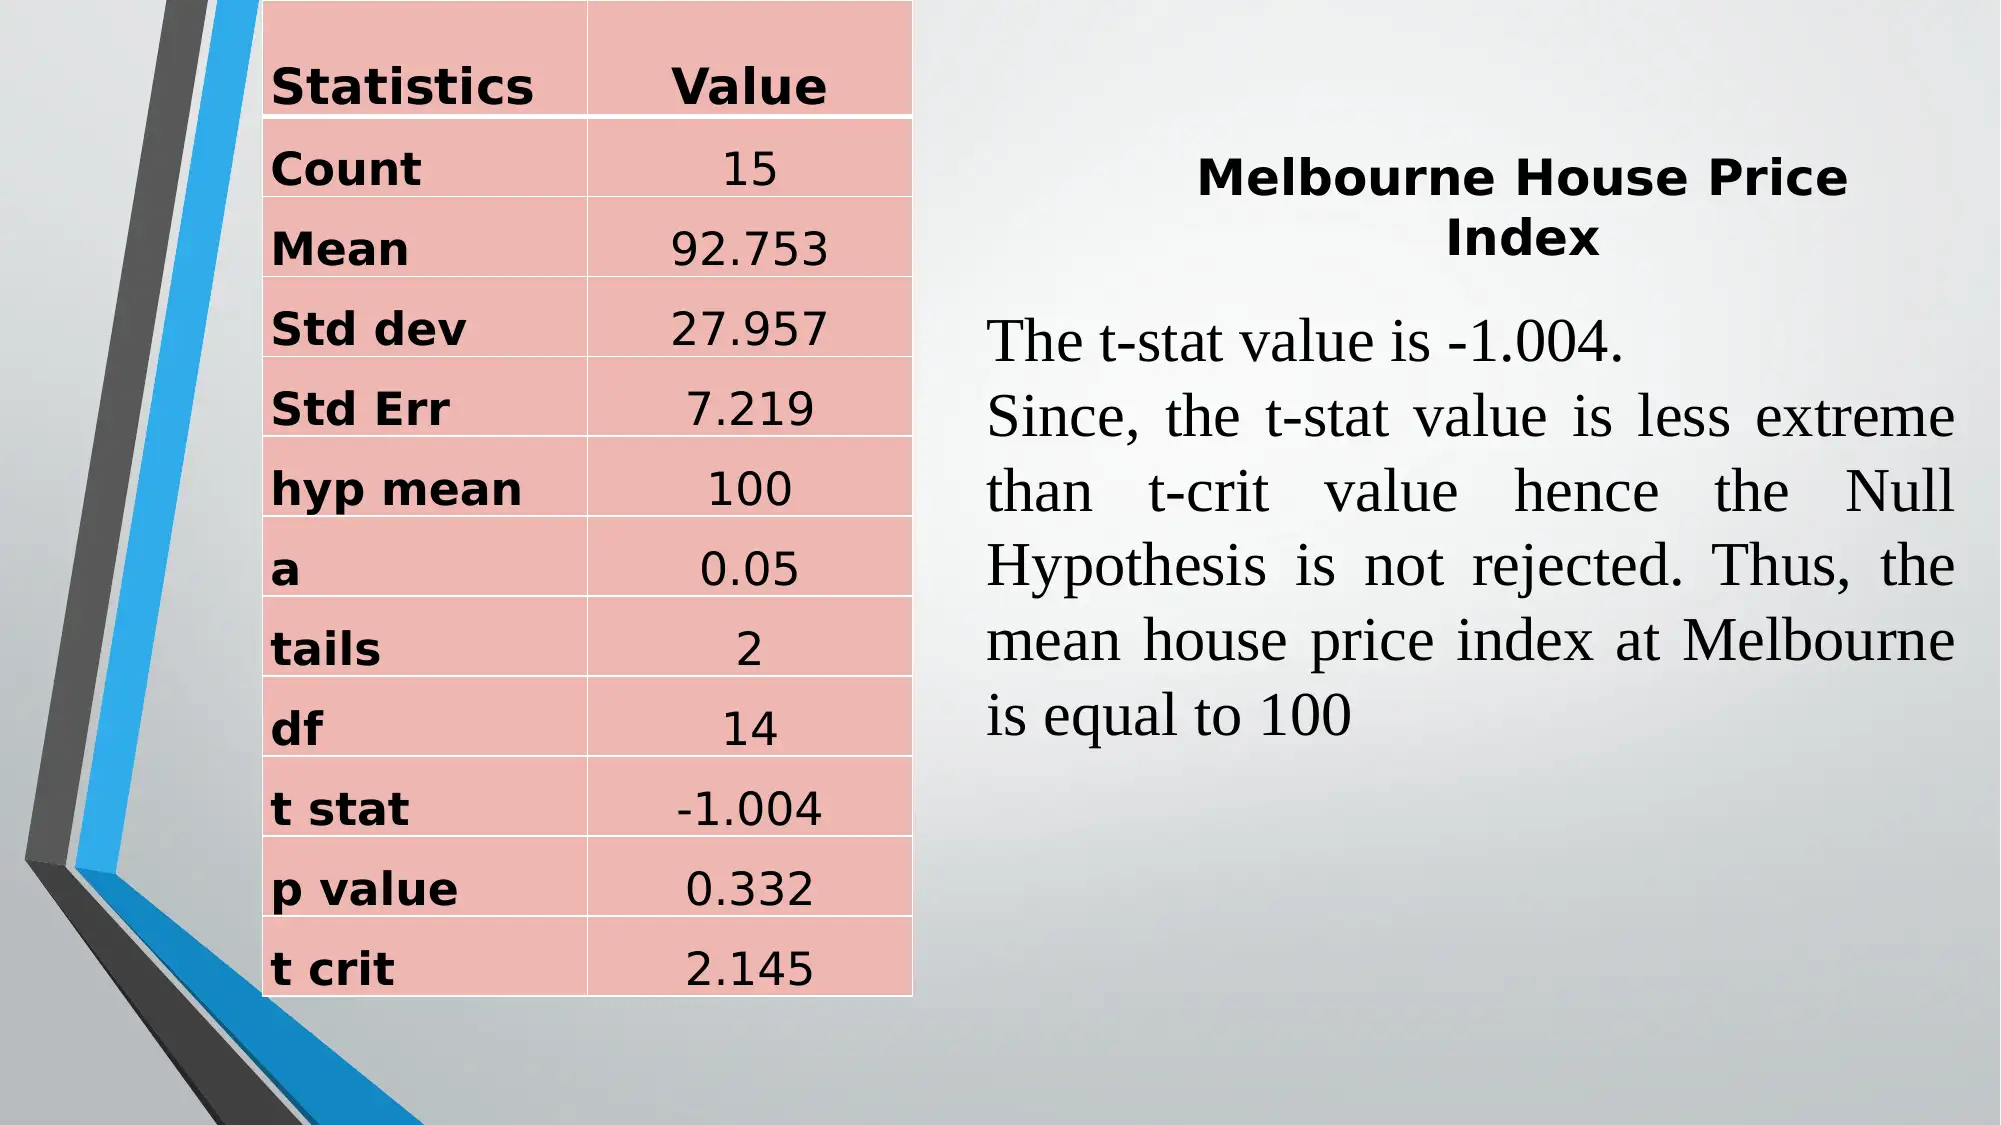
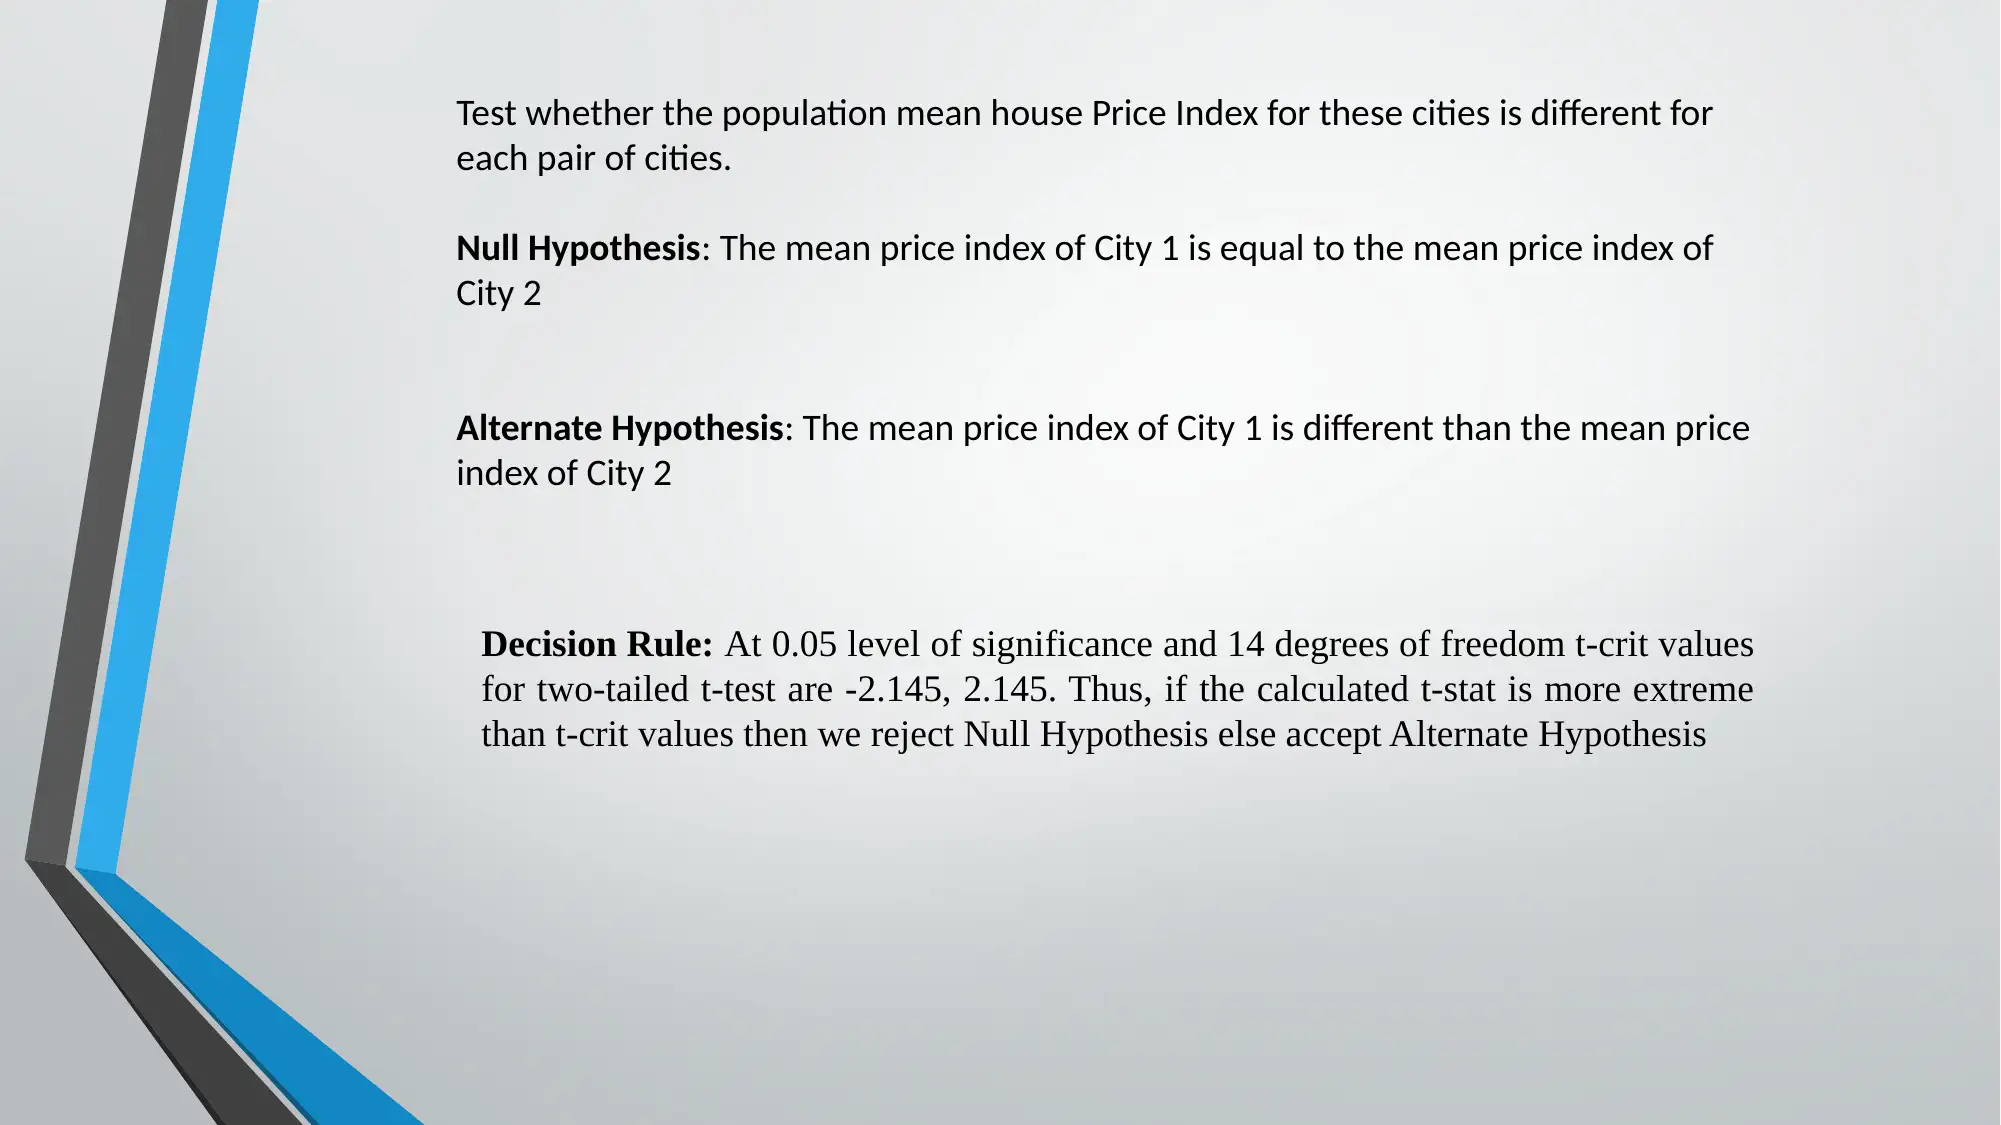
This assignment provides a statistical analysis of house price indexes in Brisbane, Sydney, and Melbourne. It examines the distribution of price indexes in each city, noting the skewness in Brisbane and Sydney, and the near-normal distribution in Melbourne. The mean, standard deviation, and 95% confidence intervals are calculated for each city's house price index. Hypothesis tests are conducted to determine if the mean house price index of each city is different from 100, and whether the population mean house price indexes differ between pairs of cities. The conclusion summarizes the key findings, including the relationship between mean and median price indexes, the confidence intervals, and the comparisons of mean price indexes across the three cities. Desklib offers a range of study tools and solved assignments to support students.
1 out of 15

Your All-in-One AI-Powered Toolkit for Academic Success.
+13062052269
info@desklib.com
Available 24*7 on WhatsApp / Email
![[object Object]](/_next/static/media/star-bottom.7253800d.svg)
Copyright © 2020–2026 A2Z Services. All Rights Reserved. Developed and managed by ZUCOL.