Statistics for Business 200032 Assignment: Data Set 119 Solution
VerifiedAdded on 2023/03/20
|6
|446
|34
Homework Assignment
AI Summary
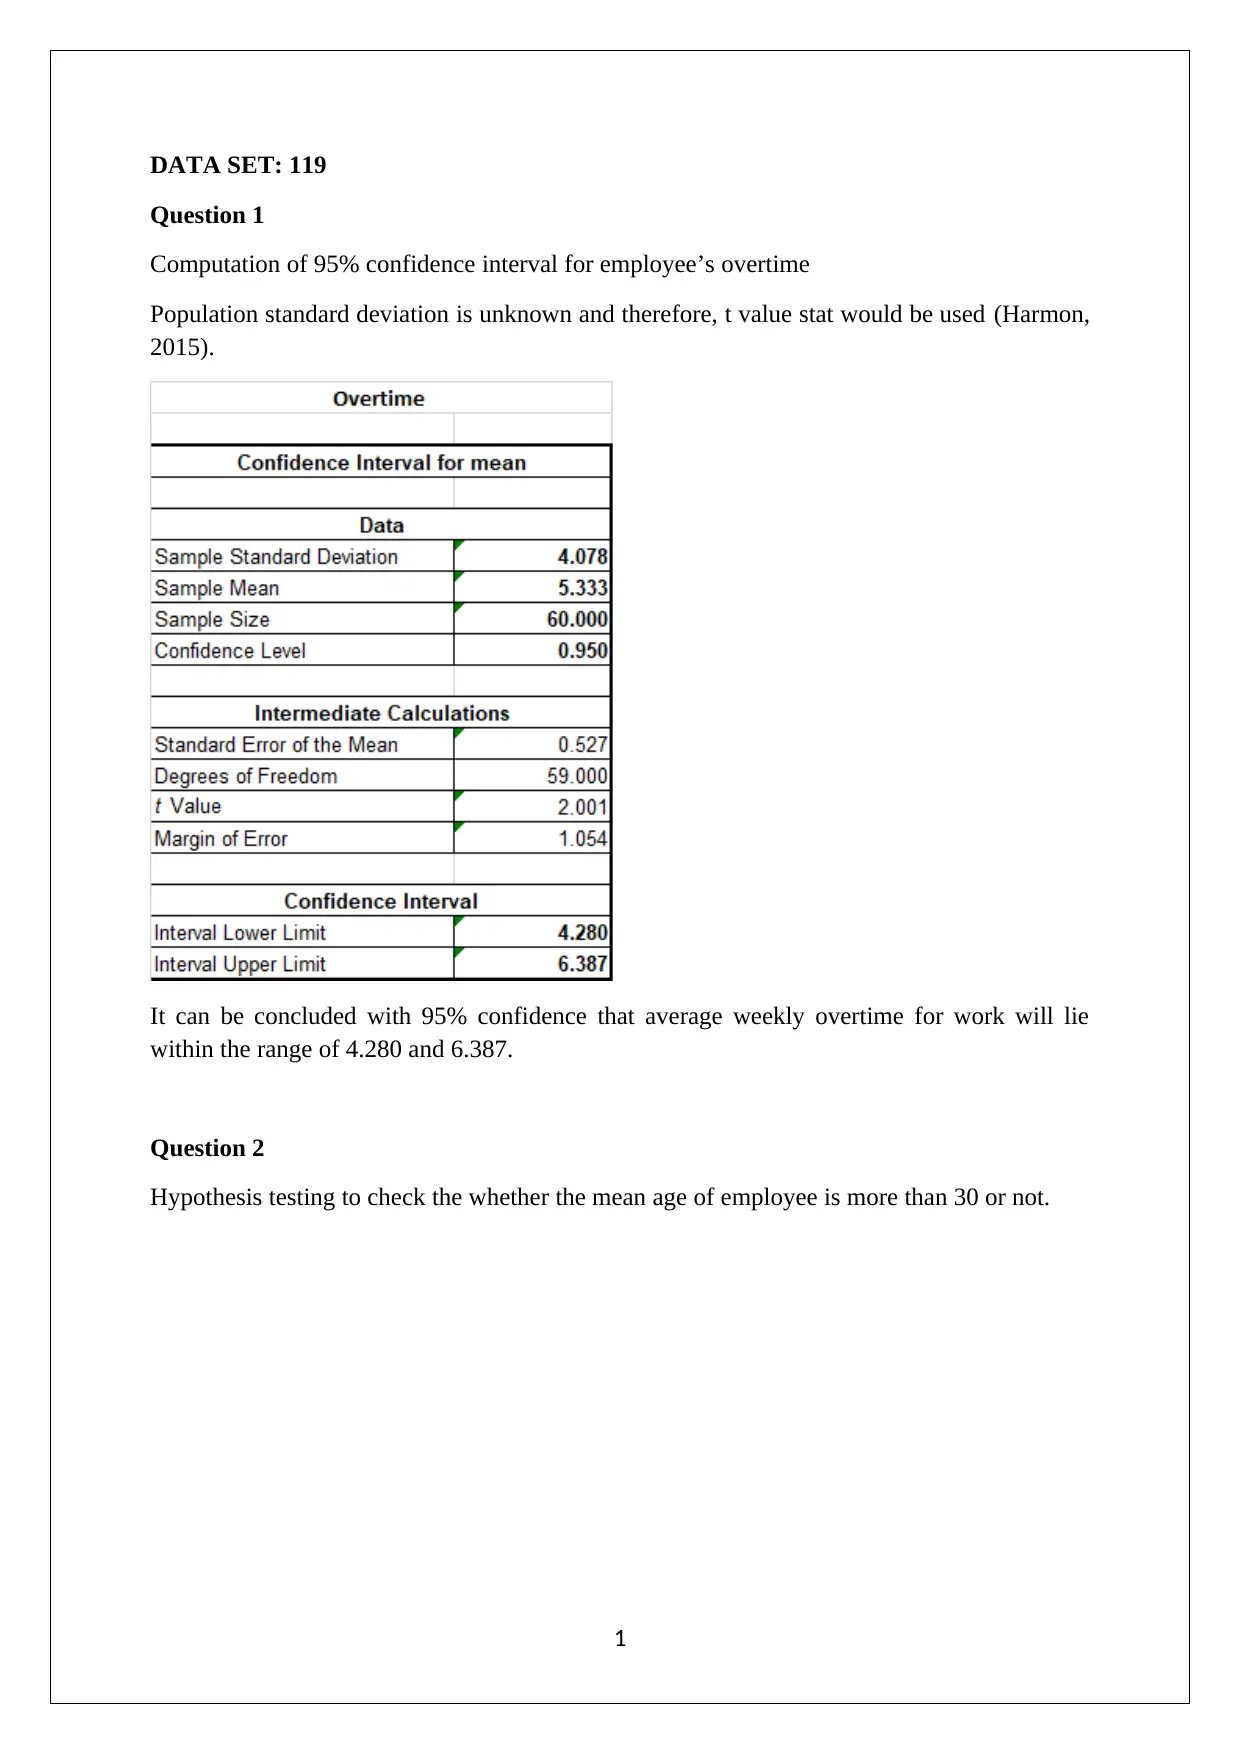
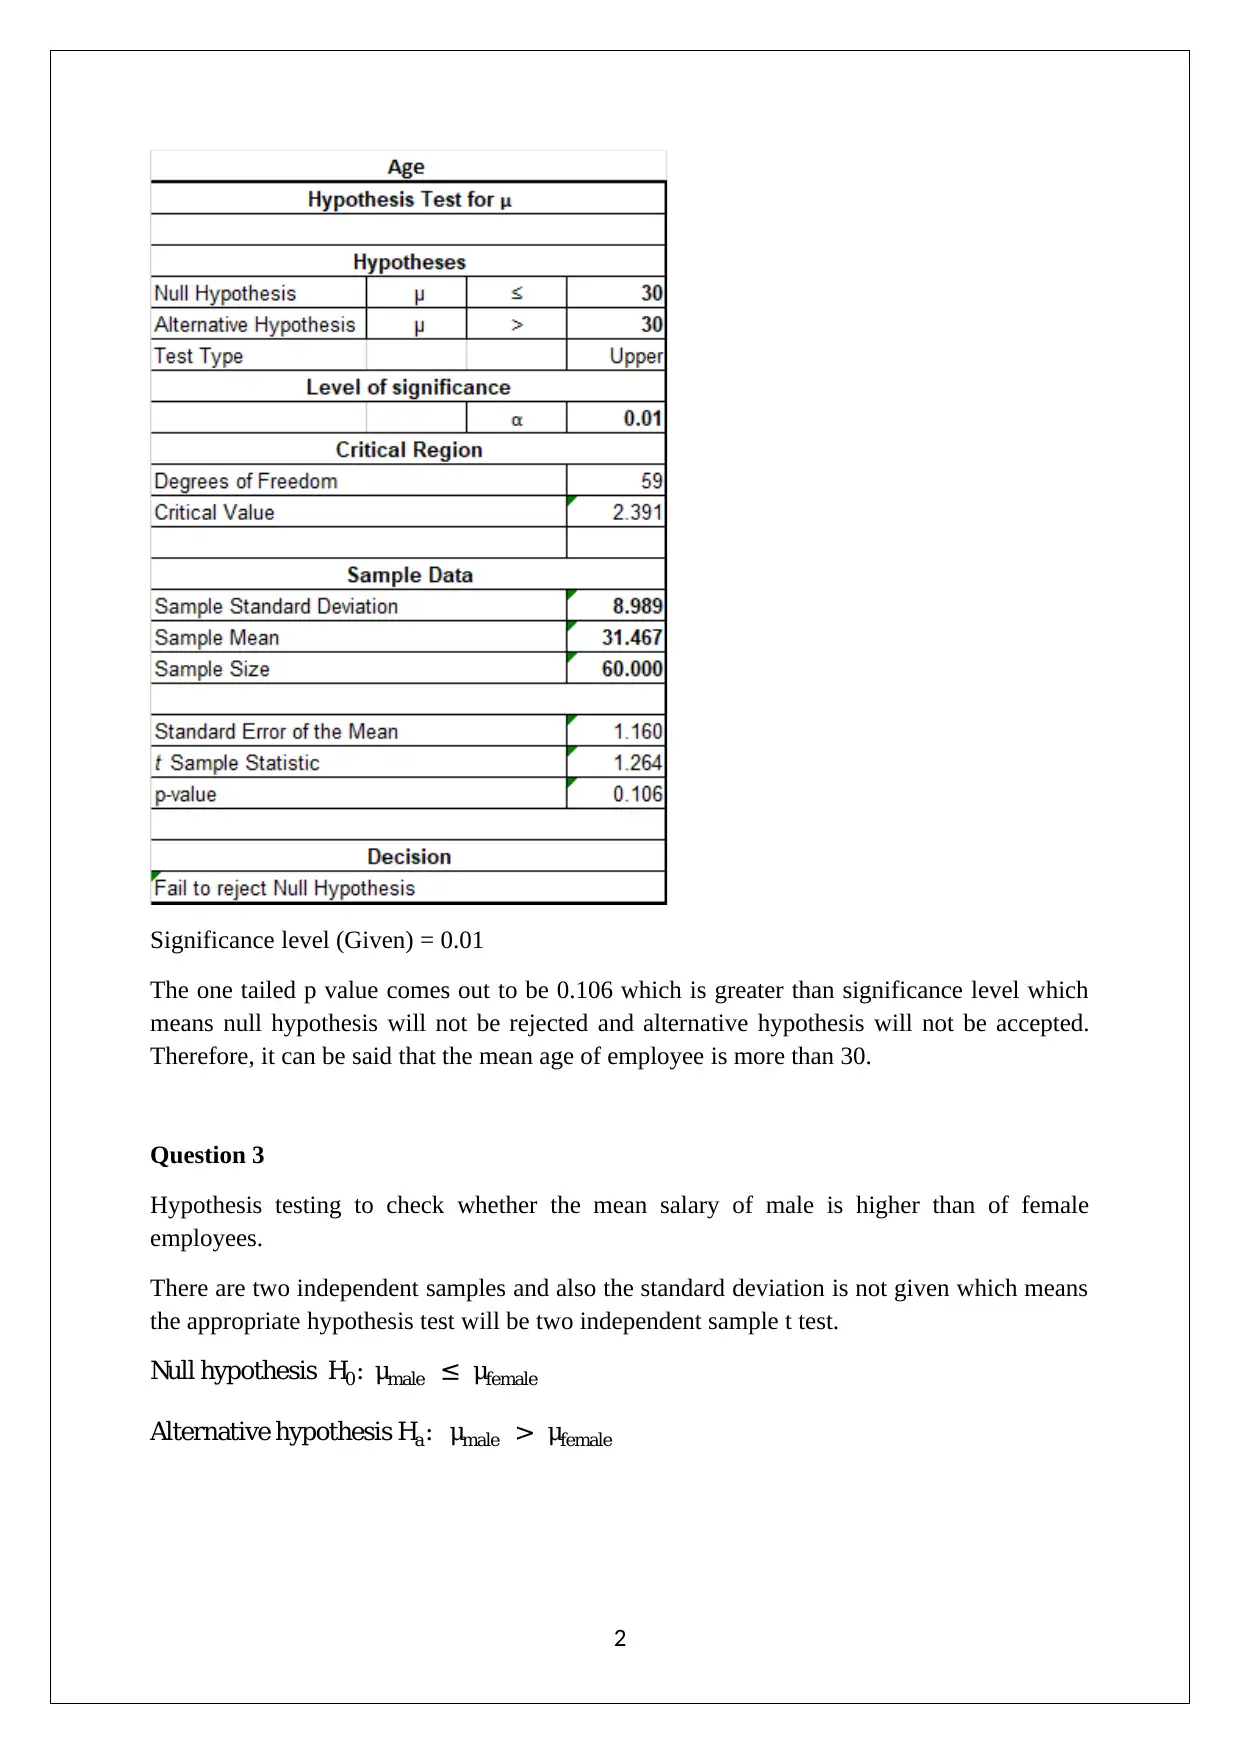
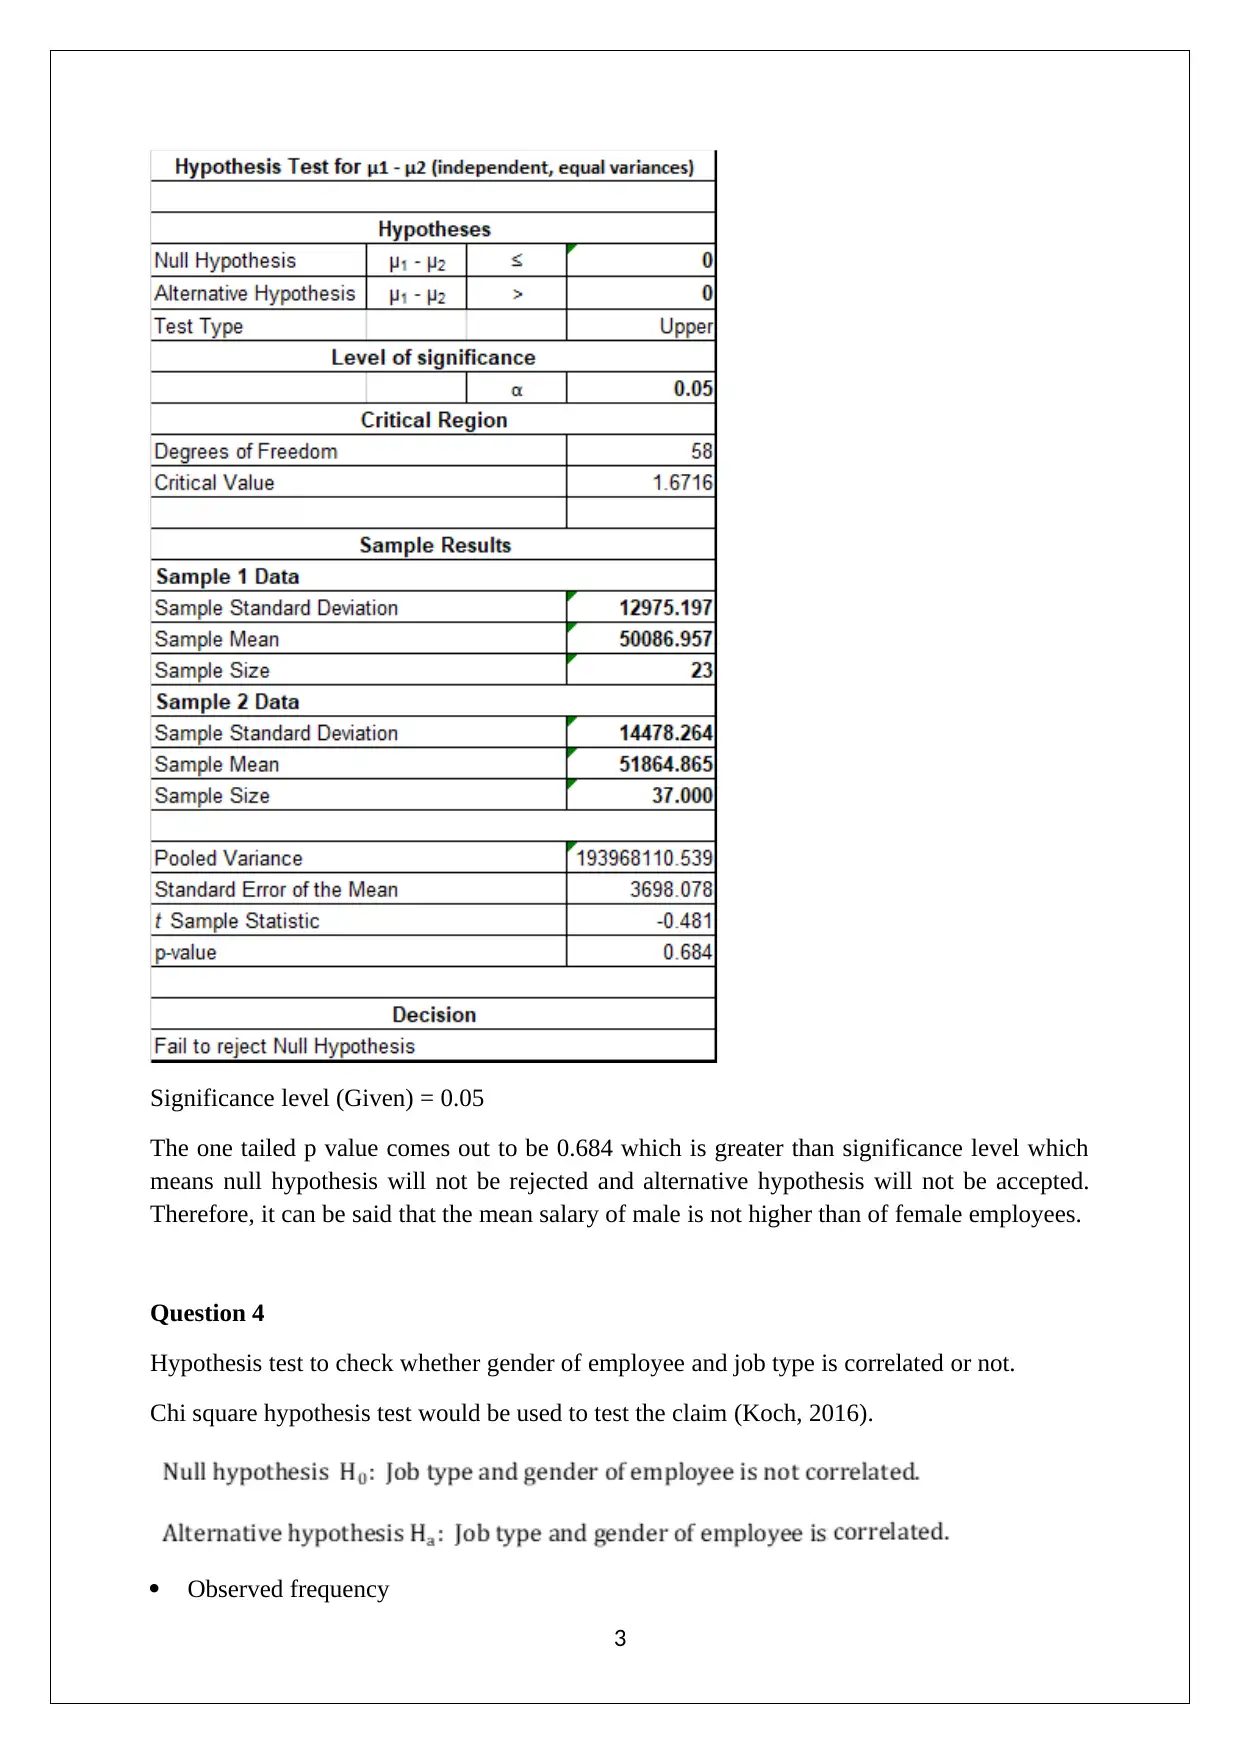
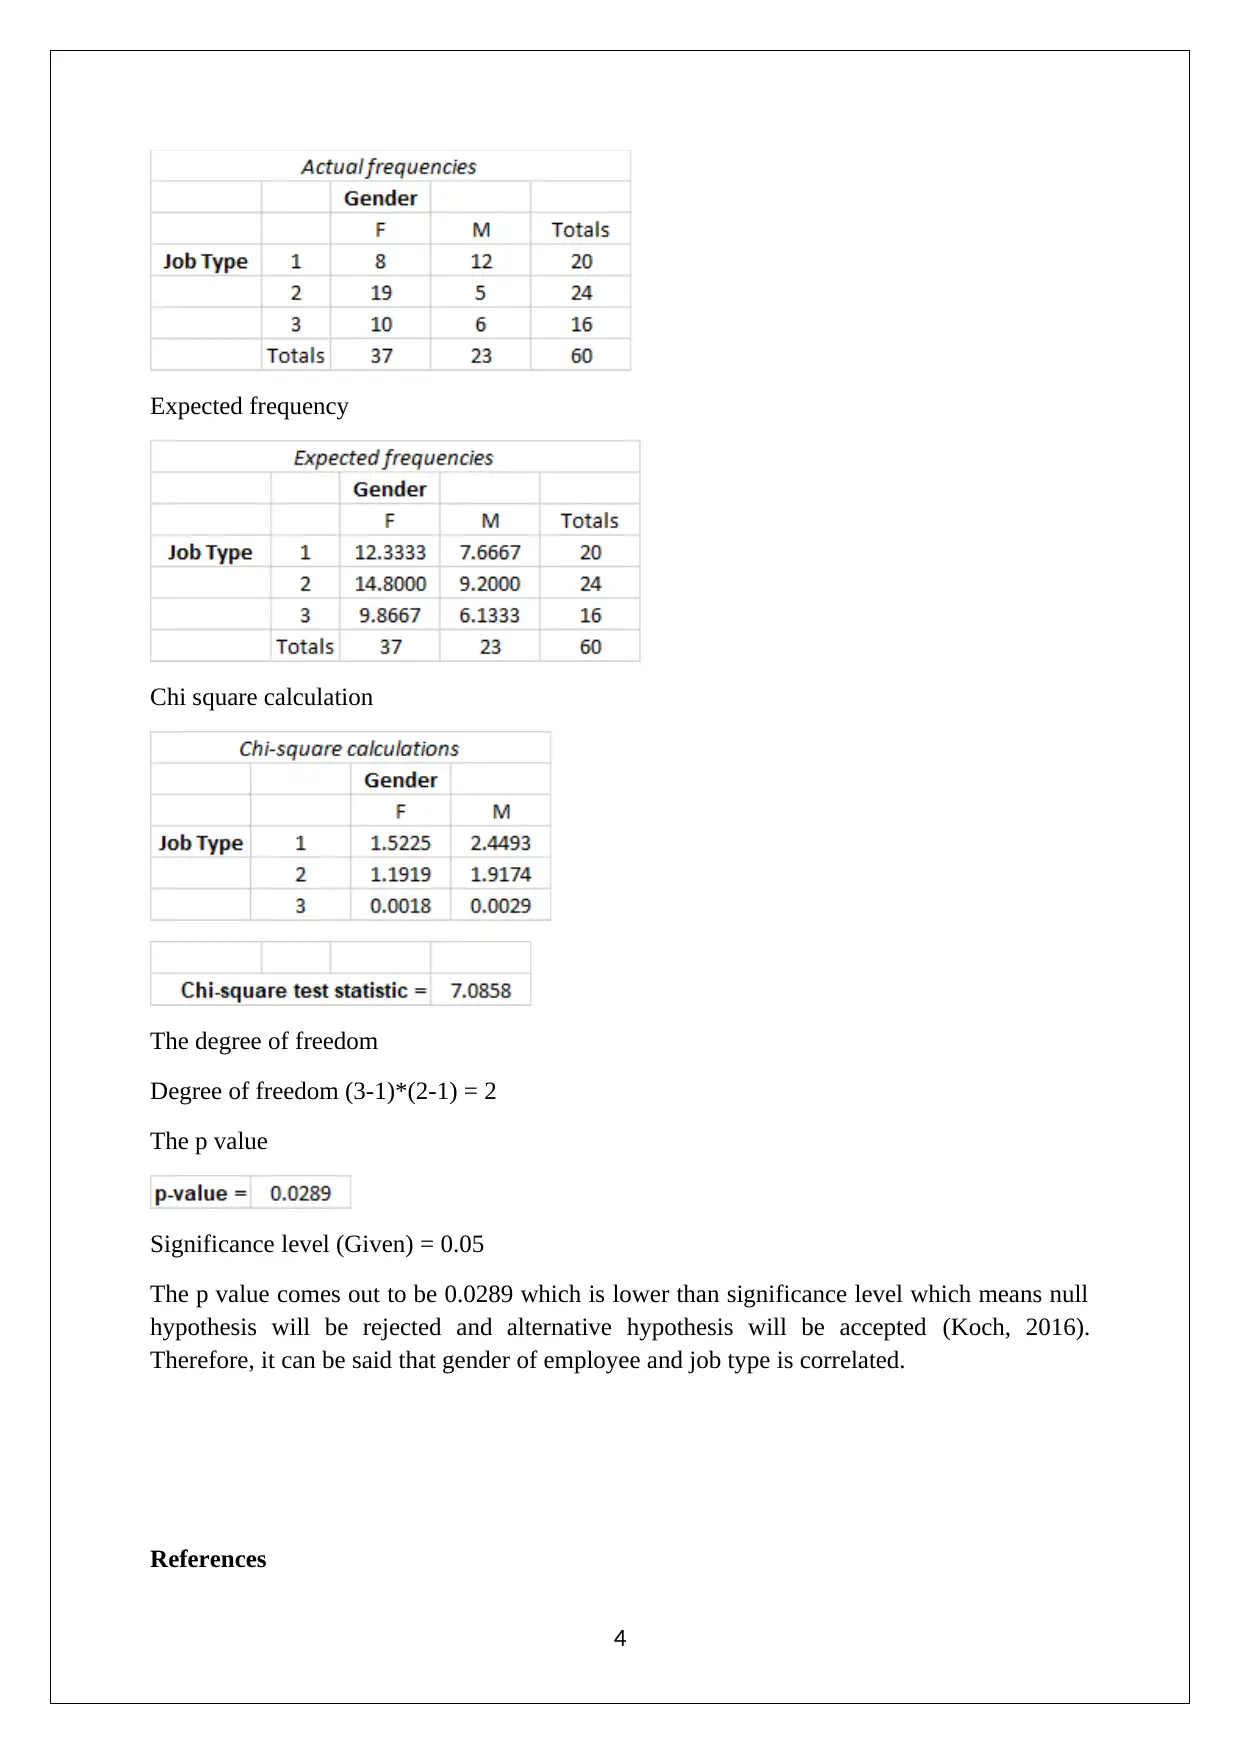
This assignment solution addresses a Statistics for Business problem set, specifically focusing on data set 119. The solution provides a detailed analysis of the data using statistical methods. Question 1 computes a 95% confidence interval for employee overtime, utilizing a t-value due to an unknown population standard deviation. Question 2 performs hypothesis testing to determine if the mean employee age exceeds 30, concluding that the mean age is not more than 30. Question 3 conducts a two-sample t-test to compare the mean salaries of male and female employees, concluding that male salaries are not higher. Finally, Question 4 employs a chi-square test to assess the correlation between employee gender and job type, determining that the two variables are correlated. The solution includes the statistical tests' results and relevant references.


1 out of 6
Related Documents


![Statistical Analysis and Hypothesis Testing Assignment - [Course Name]](/_next/image/?url=https%3A%2F%2Fdesklib.com%2Fmedia%2Fimages%2Fgm%2F139f8470657347ce91a85f124f52b5d8.jpg&w=256&q=75)


Your All-in-One AI-Powered Toolkit for Academic Success.
+13062052269
info@desklib.com
Available 24*7 on WhatsApp / Email
![[object Object]](/_next/static/media/star-bottom.7253800d.svg)
Copyright © 2020–2025 A2Z Services. All Rights Reserved. Developed and managed by ZUCOL.