University Statistics Report: Analysing Household Data (BUS5SBF)

Verified

Added on  2022/11/25

|8
|772
|87
Report
AI Summary
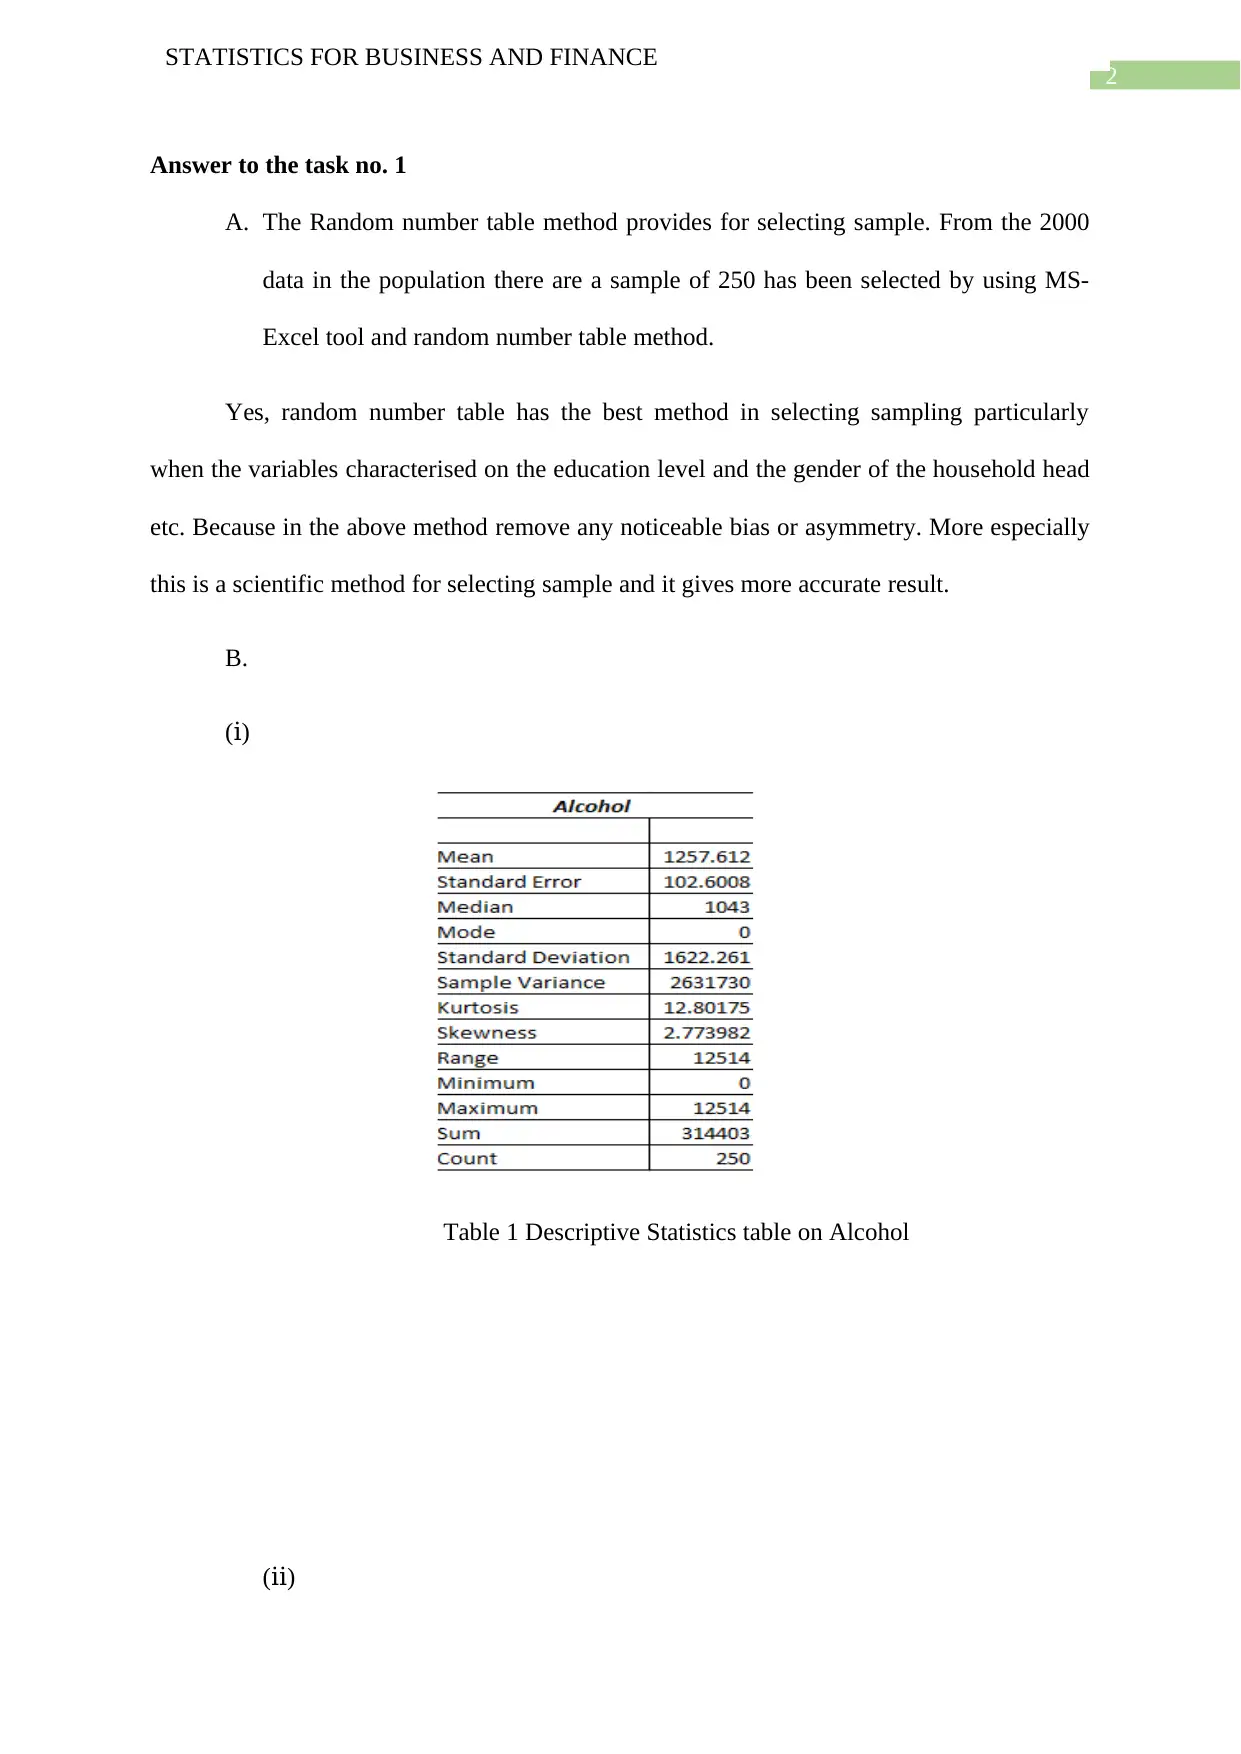
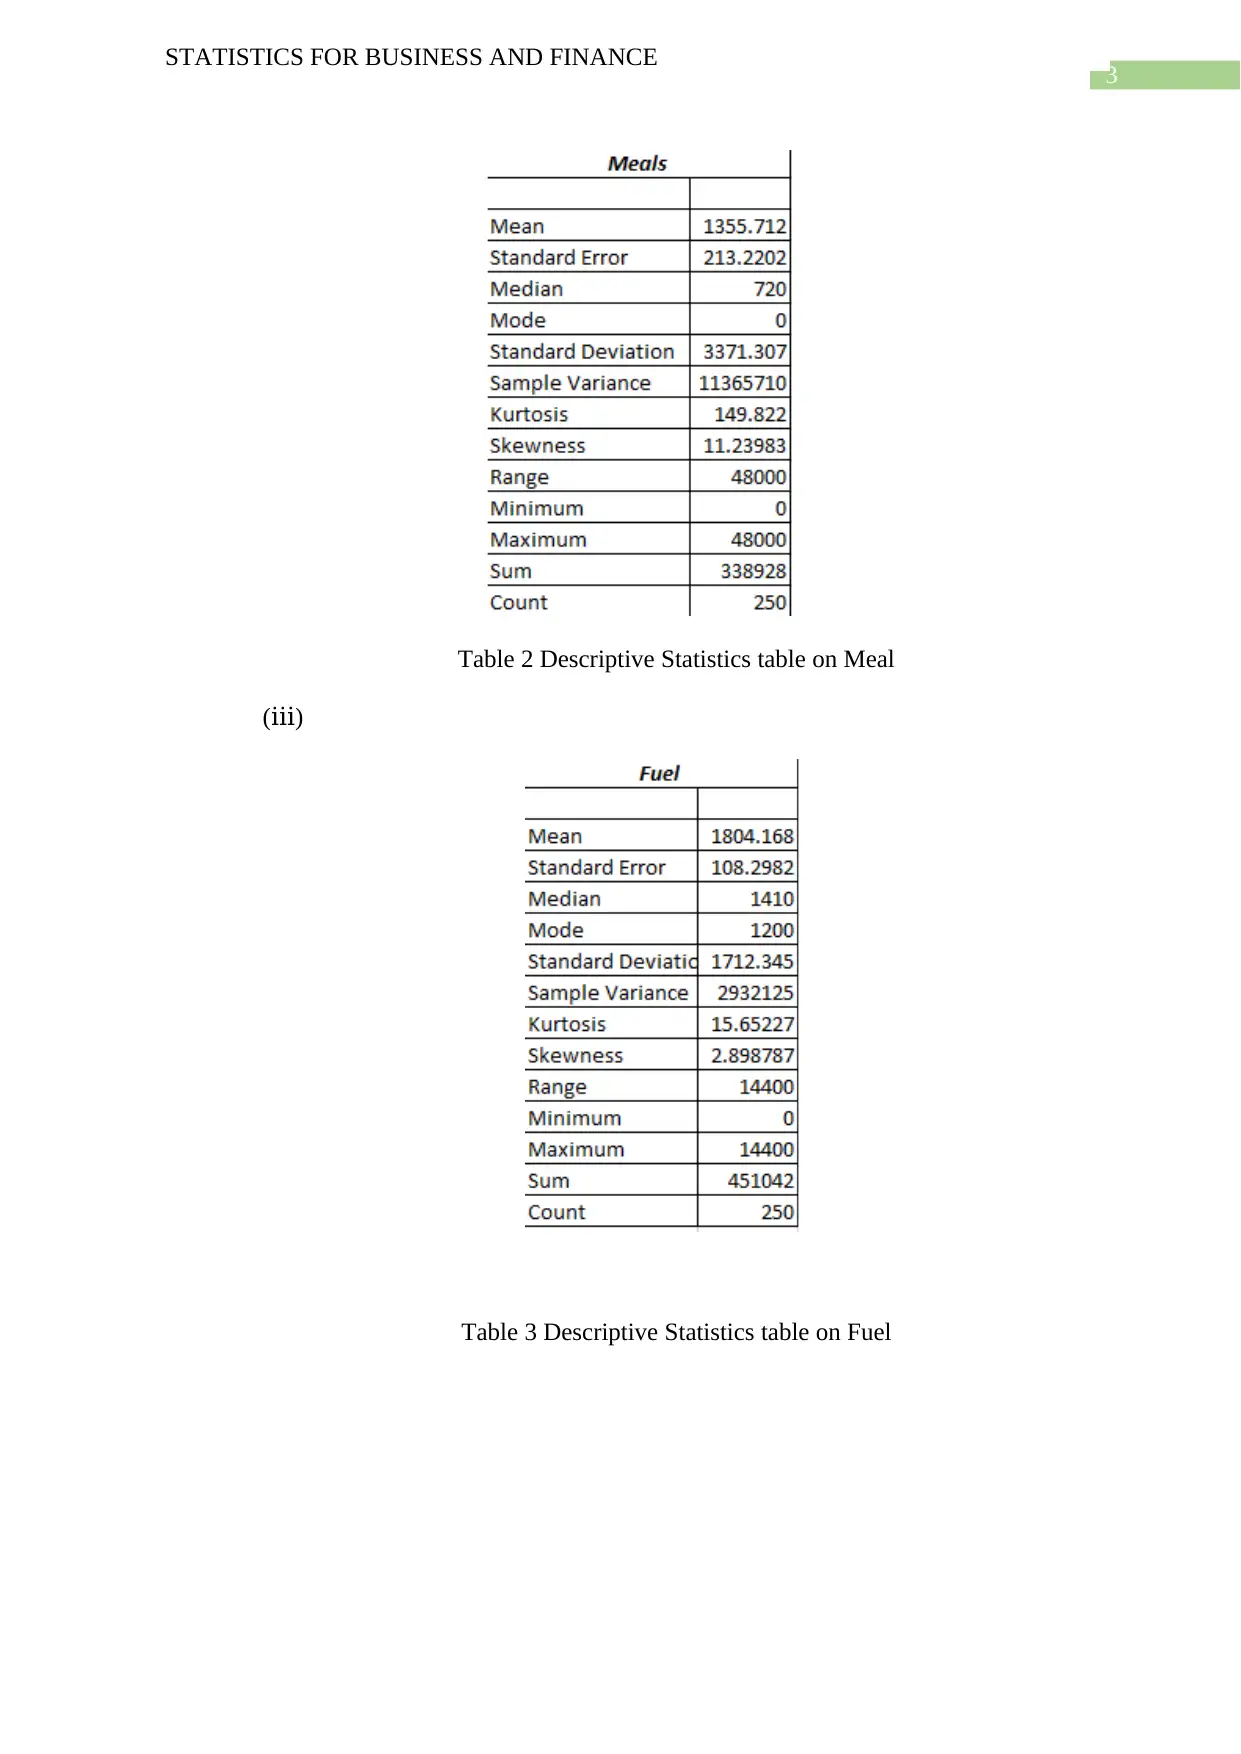
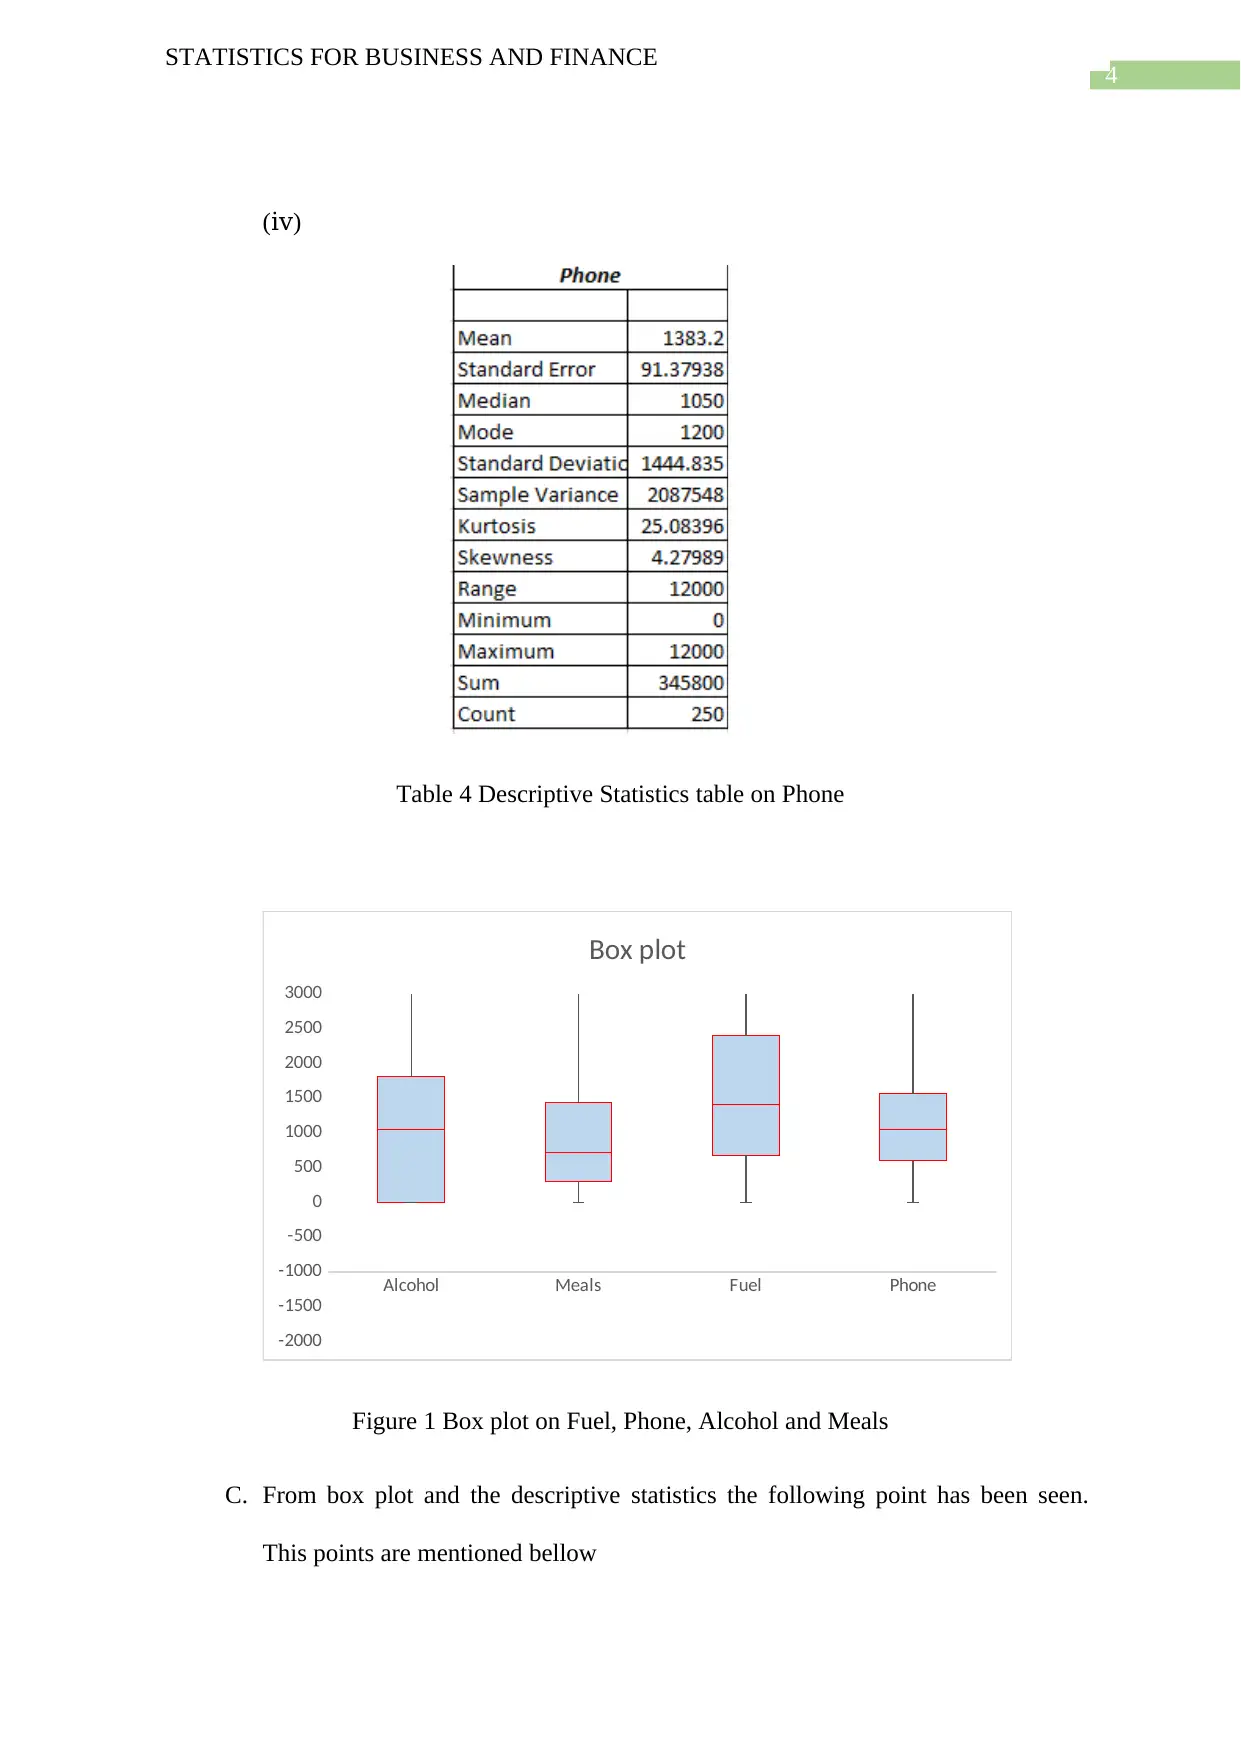
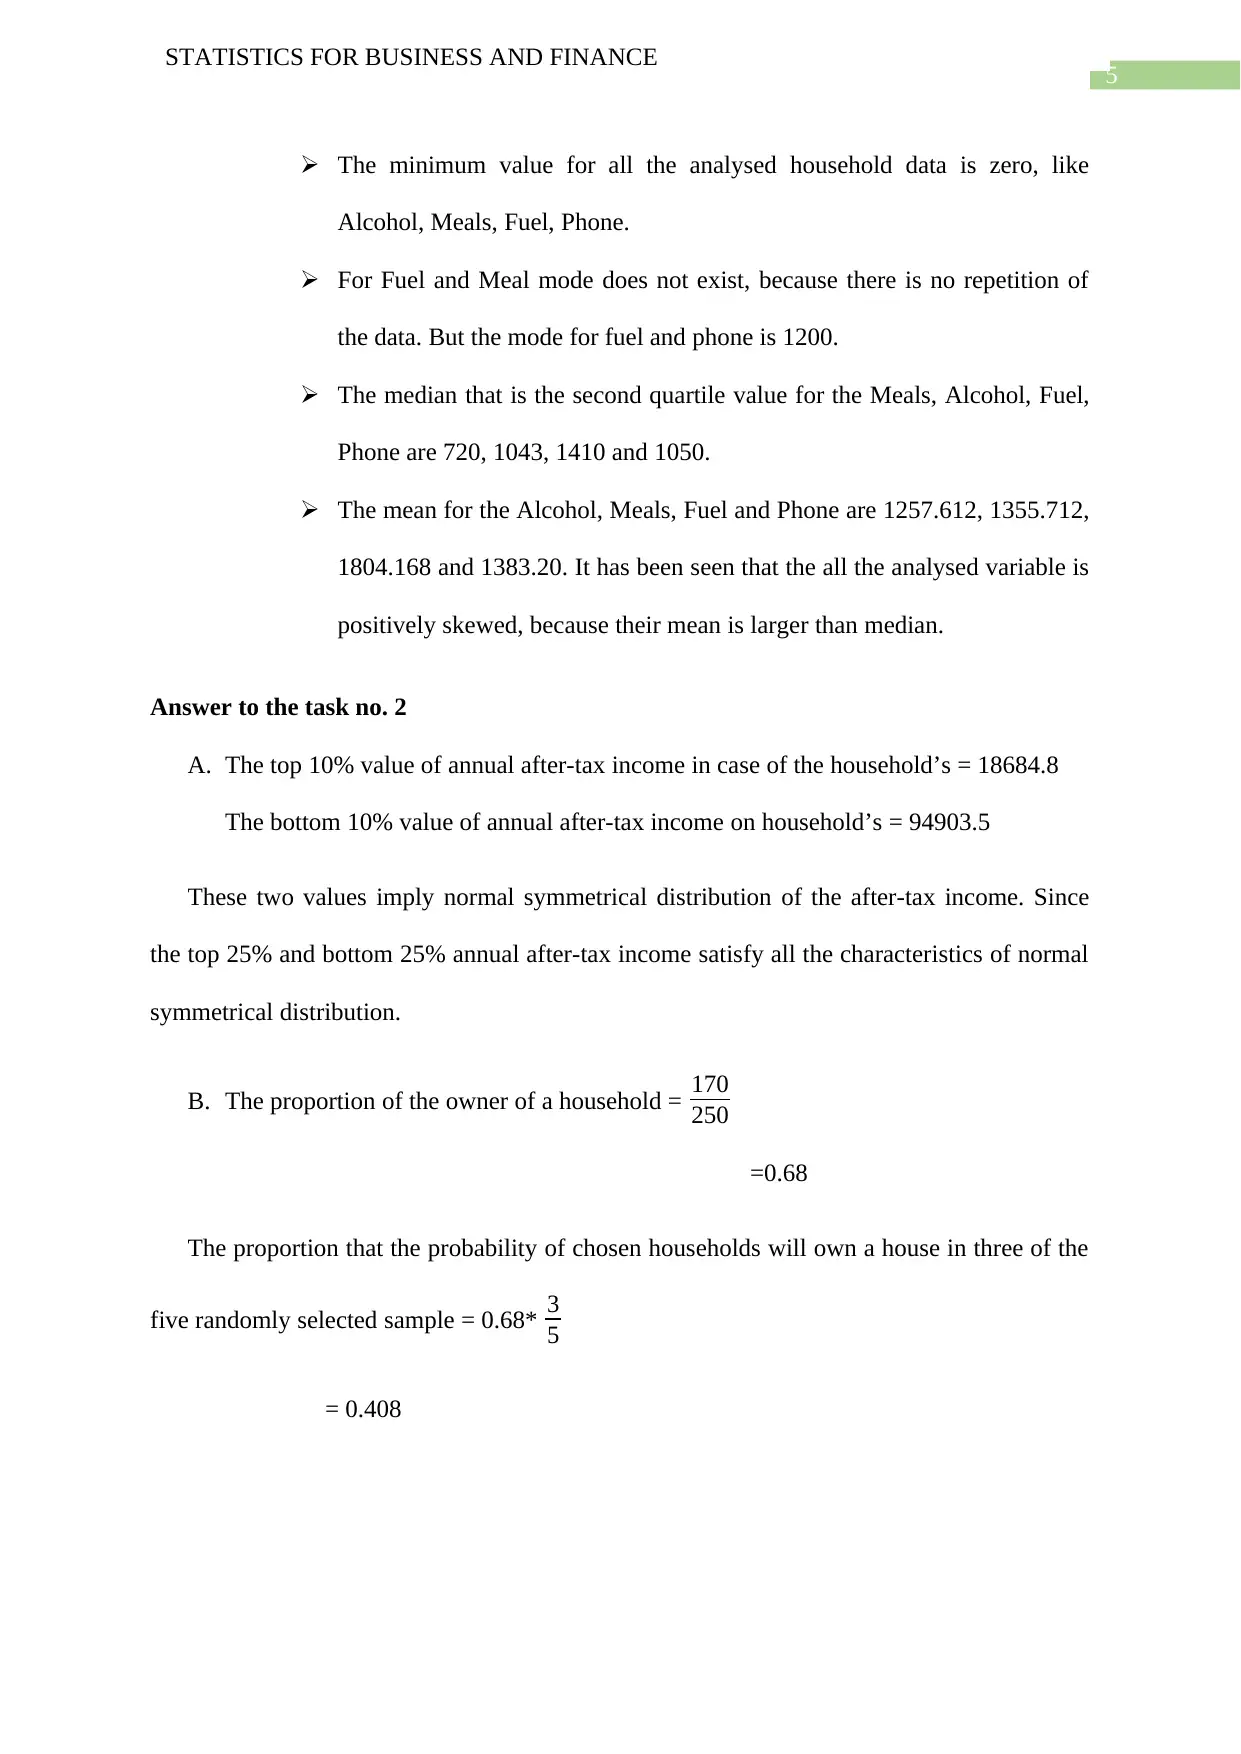
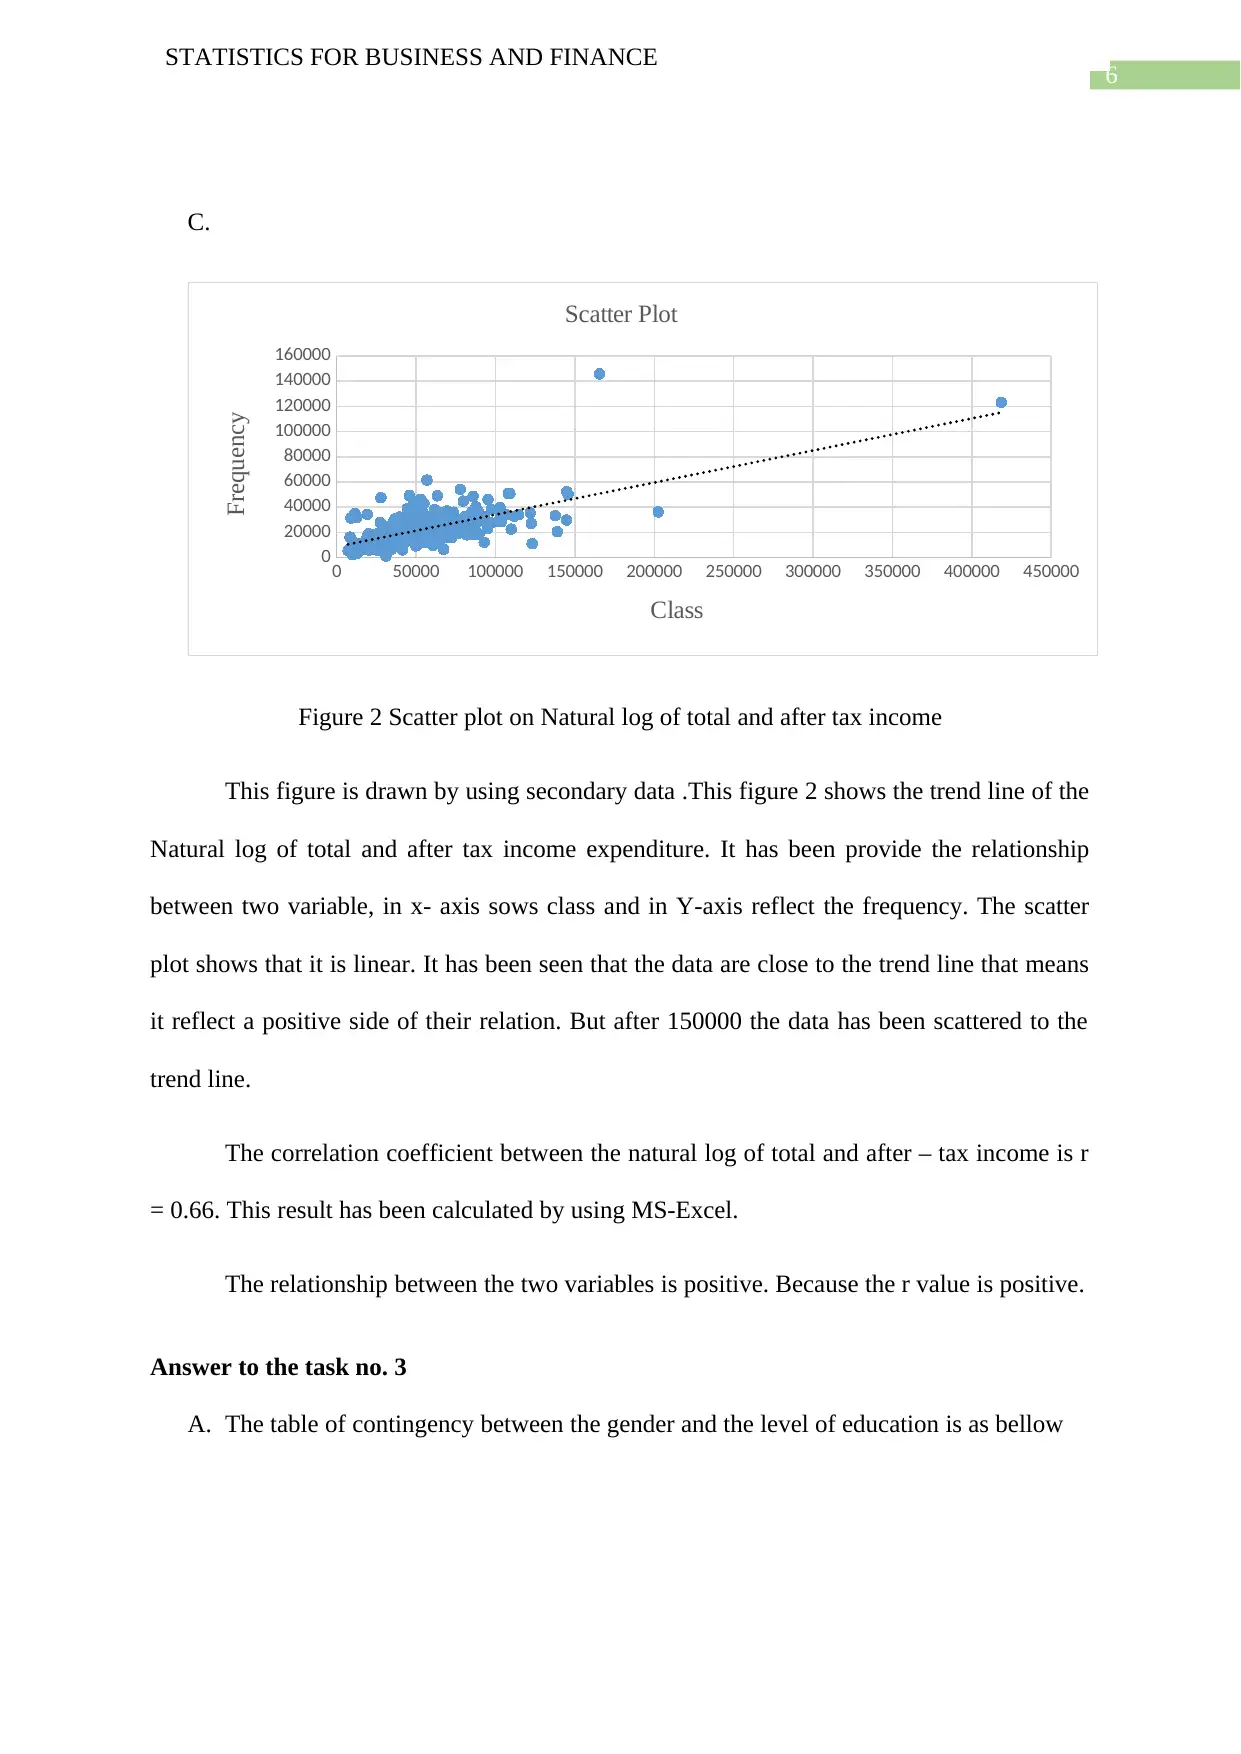
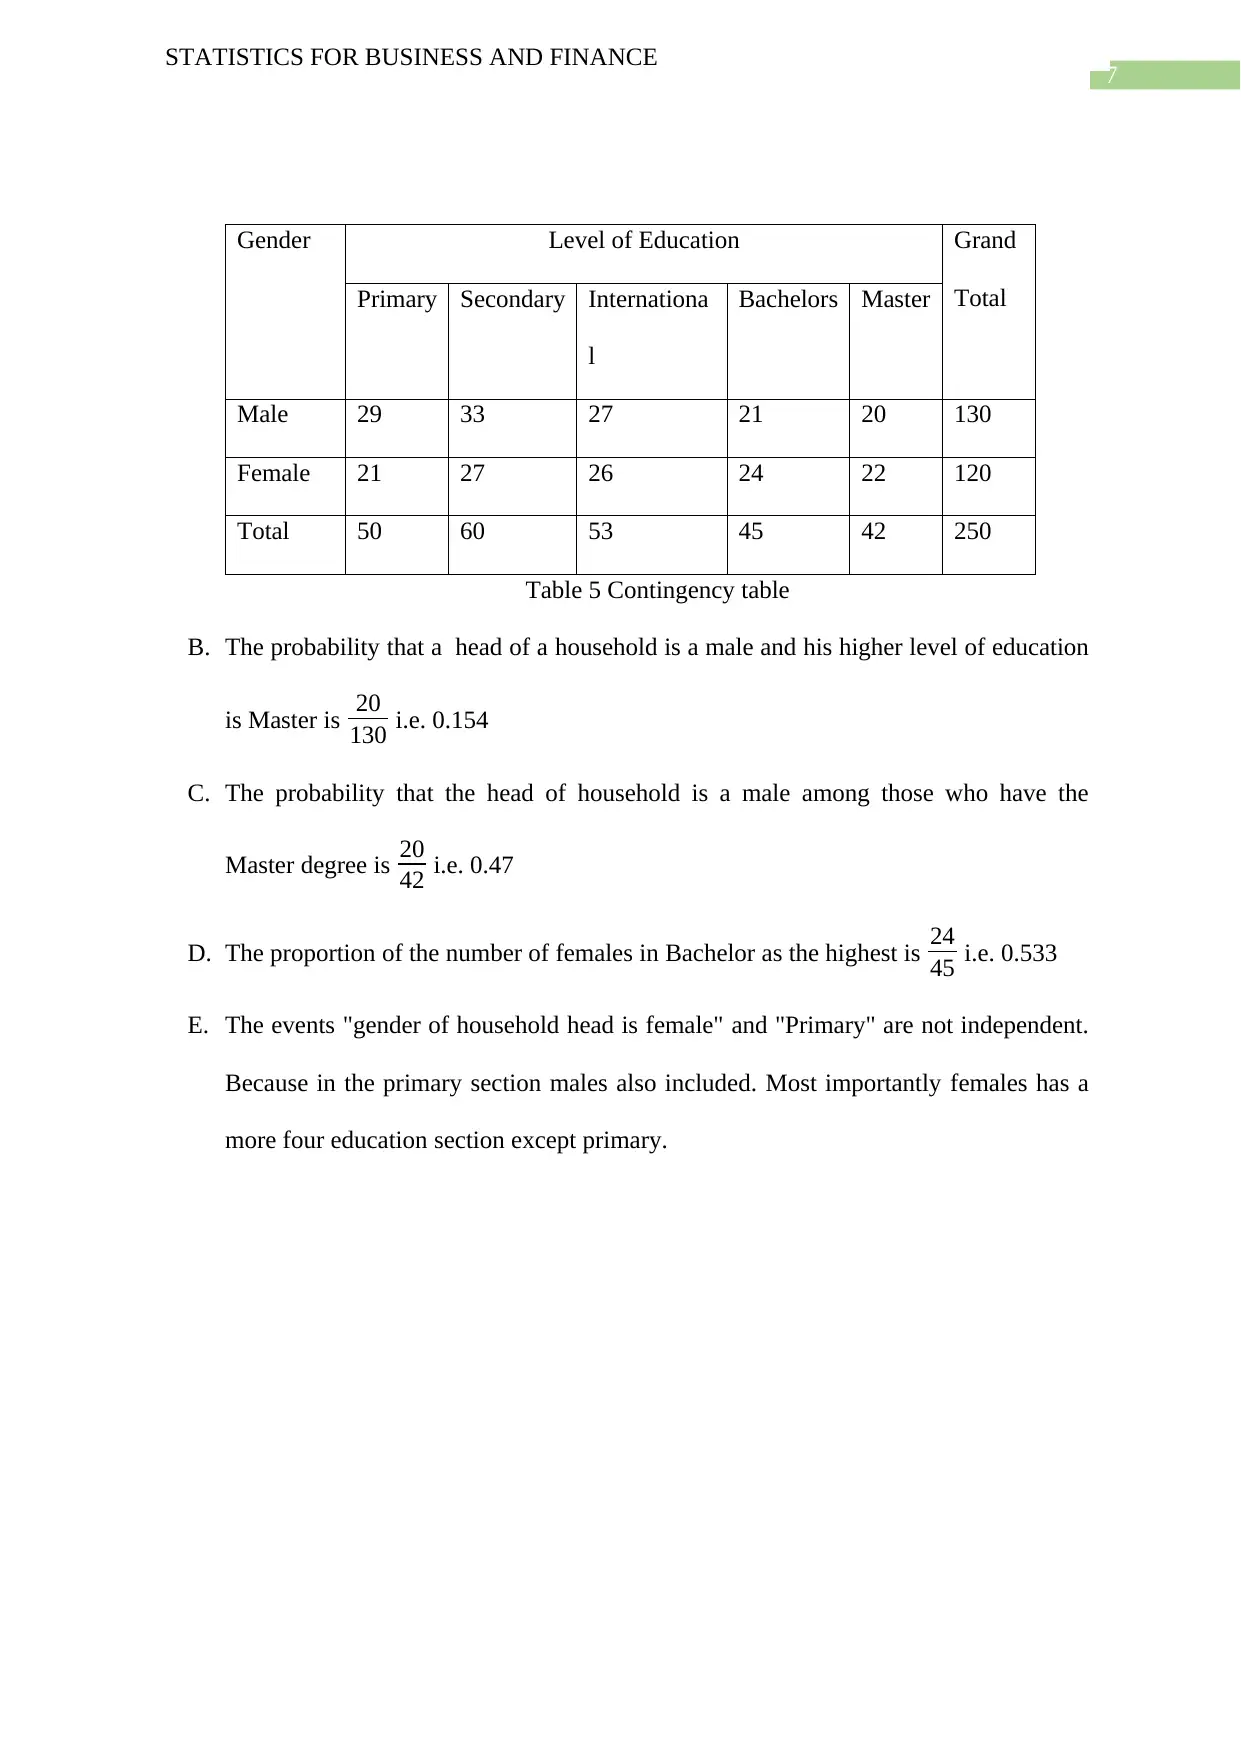
This report presents a statistical analysis of household data, covering various aspects such as random sampling, descriptive statistics, correlation, and contingency tables. The analysis utilizes data from a provided dataset and employs MS-Excel for calculations and visualizations. The report includes descriptive statistics tables for variables like Alcohol, Meals, Fuel, and Phone, along with a box plot illustrating their distributions. It further examines the relationship between annual after-tax income, and total income through scatter plots and correlation coefficients. Additionally, a contingency table is used to analyze the relationship between the gender of the household head and their level of education. The student has addressed the specified tasks, providing detailed explanations and calculations to support the findings. The report concludes with interpretations of the results and their implications, demonstrating a solid understanding of statistical methods and their application to real-world data analysis.
Document Page
Running Head: STATISTICS FOR BUSINESS AND FINANCE
Statistics for Business and Finance
Name of the Student:
Name of the University:
Author Note:
tabler-icon-diamond-filled.svg

Paraphrase This Document

Need a fresh take? Get an instant paraphrase of this document with our AI Paraphraser
Document Page
1
STATISTICS FOR BUSINESS AND FINANCE
Table of Contents
Answer to the task no. 1.............................................................................................................2
Answer to the task no. 2.............................................................................................................5
Answer to the task no. 3.............................................................................................................6
Document Page
2
STATISTICS FOR BUSINESS AND FINANCE
Answer to the task no. 1
A. The Random number table method provides for selecting sample. From the 2000
data in the population there are a sample of 250 has been selected by using MS-
Excel tool and random number table method.
Yes, random number table has the best method in selecting sampling particularly
when the variables characterised on the education level and the gender of the household head
etc. Because in the above method remove any noticeable bias or asymmetry. More especially
this is a scientific method for selecting sample and it gives more accurate result.
B.
()
Table 1 Descriptive Statistics table on Alcohol
()
Document Page
3
STATISTICS FOR BUSINESS AND FINANCE
Table 2 Descriptive Statistics table on Meal
()
Table 3 Descriptive Statistics table on Fuel
tabler-icon-diamond-filled.svg

Paraphrase This Document

Need a fresh take? Get an instant paraphrase of this document with our AI Paraphraser
Document Page
4
STATISTICS FOR BUSINESS AND FINANCE
()
Table 4 Descriptive Statistics table on Phone
Alcohol Meals Fuel Phone
-2000
-1500
-1000
-500
0
500
1000
1500
2000
2500
3000
Box plot
Figure 1 Box plot on Fuel, Phone, Alcohol and Meals
C. From box plot and the descriptive statistics the following point has been seen.
This points are mentioned bellow
Document Page
5
STATISTICS FOR BUSINESS AND FINANCE
The minimum value for all the analysed household data is zero, like
Alcohol, Meals, Fuel, Phone.
For Fuel and Meal mode does not exist, because there is no repetition of
the data. But the mode for fuel and phone is 1200.
The median that is the second quartile value for the Meals, Alcohol, Fuel,
Phone are 720, 1043, 1410 and 1050.
The mean for the Alcohol, Meals, Fuel and Phone are 1257.612, 1355.712,
1804.168 and 1383.20. It has been seen that the all the analysed variable is
positively skewed, because their mean is larger than median.
Answer to the task no. 2
A. The top 10% value of annual after-tax income in case of the household’s = 18684.8
The bottom 10% value of annual after-tax income on household’s = 94903.5
These two values imply normal symmetrical distribution of the after-tax income. Since
the top 25% and bottom 25% annual after-tax income satisfy all the characteristics of normal
symmetrical distribution.
B. The proportion of the owner of a household = 170
250
=0.68
The proportion that the probability of chosen households will own a house in three of the
five randomly selected sample = 0.68* 3
5
= 0.408
Document Page
6
STATISTICS FOR BUSINESS AND FINANCE
C.
0 50000 100000 150000 200000 250000 300000 350000 400000 450000
0
20000
40000
60000
80000
100000
120000
140000
160000
Scatter Plot
Class
Frequency
Figure 2 Scatter plot on Natural log of total and after tax income
This figure is drawn by using secondary data .This figure 2 shows the trend line of the
Natural log of total and after tax income expenditure. It has been provide the relationship
between two variable, in x- axis sows class and in Y-axis reflect the frequency. The scatter
plot shows that it is linear. It has been seen that the data are close to the trend line that means
it reflect a positive side of their relation. But after 150000 the data has been scattered to the
trend line.
The correlation coefficient between the natural log of total and after – tax income is r
= 0.66. This result has been calculated by using MS-Excel.
The relationship between the two variables is positive. Because the r value is positive.
Answer to the task no. 3
A. The table of contingency between the gender and the level of education is as bellow
tabler-icon-diamond-filled.svg

Paraphrase This Document

Need a fresh take? Get an instant paraphrase of this document with our AI Paraphraser
Document Page
7
STATISTICS FOR BUSINESS AND FINANCE
Gender Level of Education Grand
TotalPrimary Secondary Internationa
l
Bachelors Master
Male 29 33 27 21 20 130
Female 21 27 26 24 22 120
Total 50 60 53 45 42 250
Table 5 Contingency table
B. The probability that a head of a household is a male and his higher level of education
is Master is 20
130 i.e. 0.154
C. The probability that the head of household is a male among those who have the
Master degree is 20
42 i.e. 0.47
D. The proportion of the number of females in Bachelor as the highest is 24
45 i.e. 0.533
E. The events "gender of household head is female" and "Primary" are not independent.
Because in the primary section males also included. Most importantly females has a
more four education section except primary.
chevron_up_icon
1 out of 8
circle_padding
hide_on_mobile
zoom_out_icon