Statistics for Business Decision
Added on 2023-01-06
11 Pages1637 Words3 Views
Statistics for business
Decision
Decision
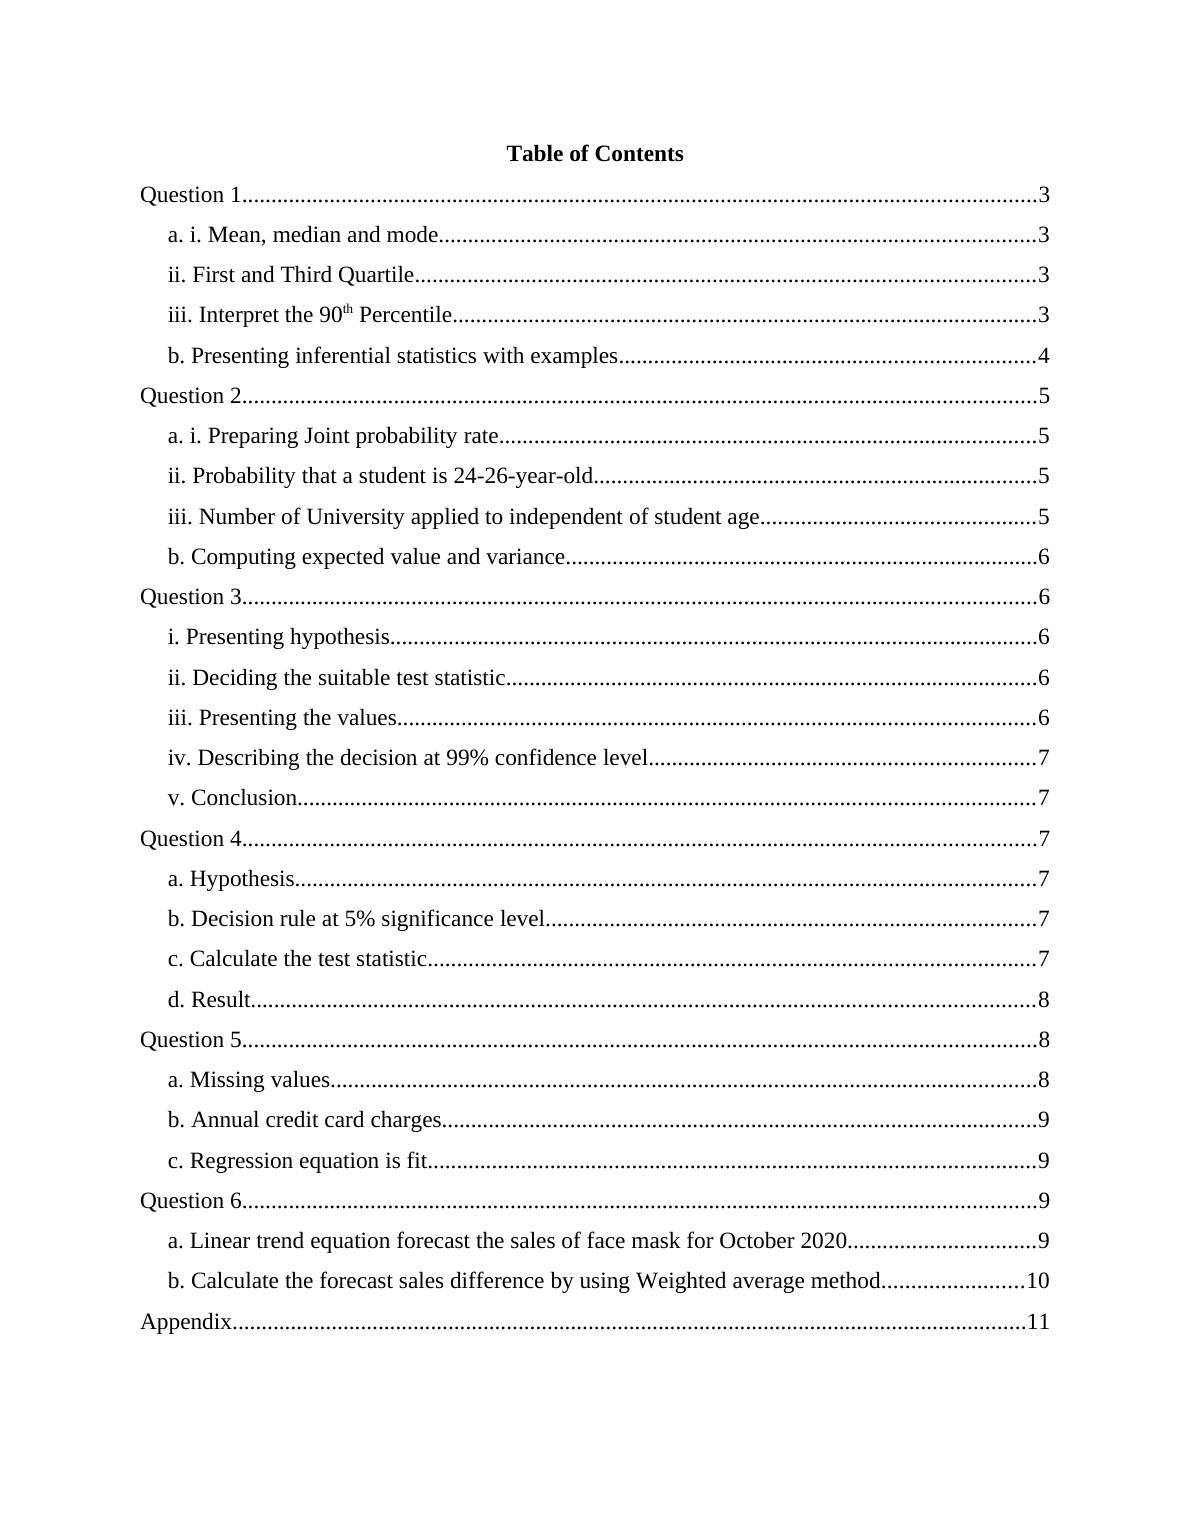
Table of Contents
Question 1........................................................................................................................................3
a. i. Mean, median and mode......................................................................................................3
ii. First and Third Quartile..........................................................................................................3
iii. Interpret the 90th Percentile....................................................................................................3
b. Presenting inferential statistics with examples.......................................................................4
Question 2........................................................................................................................................5
a. i. Preparing Joint probability rate............................................................................................5
ii. Probability that a student is 24-26-year-old............................................................................5
iii. Number of University applied to independent of student age...............................................5
b. Computing expected value and variance.................................................................................6
Question 3........................................................................................................................................6
i. Presenting hypothesis...............................................................................................................6
ii. Deciding the suitable test statistic...........................................................................................6
iii. Presenting the values.............................................................................................................6
iv. Describing the decision at 99% confidence level..................................................................7
v. Conclusion..............................................................................................................................7
Question 4........................................................................................................................................7
a. Hypothesis...............................................................................................................................7
b. Decision rule at 5% significance level....................................................................................7
c. Calculate the test statistic........................................................................................................7
d. Result......................................................................................................................................8
Question 5........................................................................................................................................8
a. Missing values.........................................................................................................................8
b. Annual credit card charges......................................................................................................9
c. Regression equation is fit........................................................................................................9
Question 6........................................................................................................................................9
a. Linear trend equation forecast the sales of face mask for October 2020................................9
b. Calculate the forecast sales difference by using Weighted average method........................10
Appendix........................................................................................................................................11
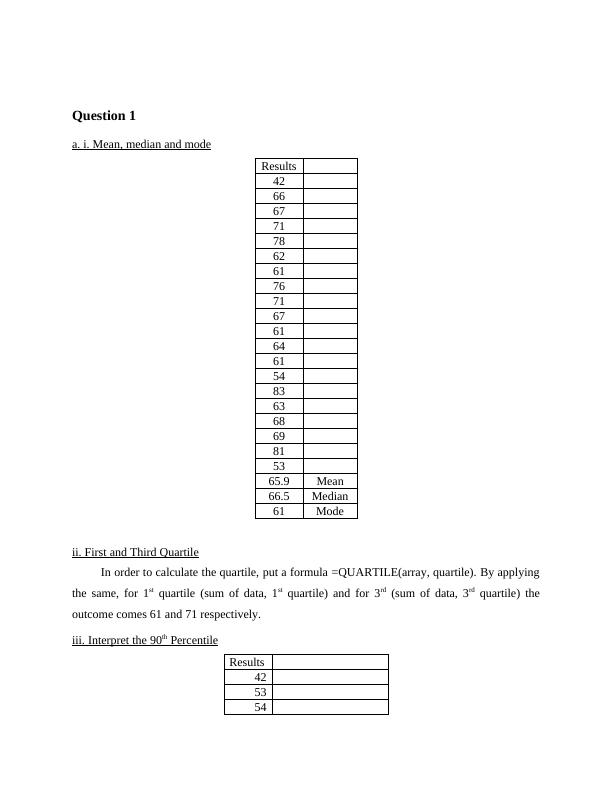
Question 1
a. i. Mean, median and mode
Results
42
66
67
71
78
62
61
76
71
67
61
64
61
54
83
63
68
69
81
53
65.9 Mean
66.5 Median
61 Mode
ii. First and Third Quartile
In order to calculate the quartile, put a formula =QUARTILE(array, quartile). By applying
the same, for 1st quartile (sum of data, 1st quartile) and for 3rd (sum of data, 3rd quartile) the
outcome comes 61 and 71 respectively.
iii. Interpret the 90th Percentile
Results
42
53
54
a. i. Mean, median and mode
Results
42
66
67
71
78
62
61
76
71
67
61
64
61
54
83
63
68
69
81
53
65.9 Mean
66.5 Median
61 Mode
ii. First and Third Quartile
In order to calculate the quartile, put a formula =QUARTILE(array, quartile). By applying
the same, for 1st quartile (sum of data, 1st quartile) and for 3rd (sum of data, 3rd quartile) the
outcome comes 61 and 71 respectively.
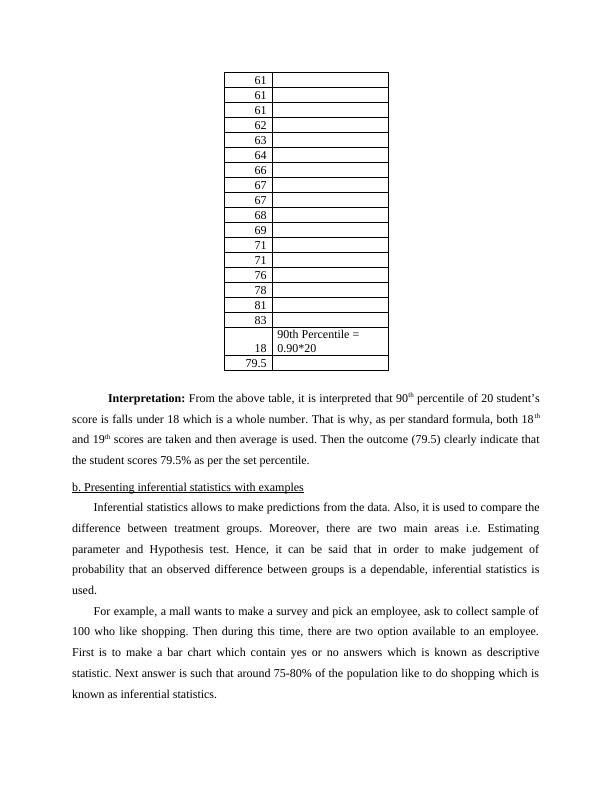
iii. Interpret the 90th Percentile
Results
42
53
54
61
61
61
62
63
64
66
67
67
68
69
71
71
76
78
81
83
18
90th Percentile =
0.90*20
79.5
Interpretation: From the above table, it is interpreted that 90th percentile of 20 student’s
score is falls under 18 which is a whole number. That is why, as per standard formula, both 18th
and 19th scores are taken and then average is used. Then the outcome (79.5) clearly indicate that
the student scores 79.5% as per the set percentile.
b. Presenting inferential statistics with examples
Inferential statistics allows to make predictions from the data. Also, it is used to compare the
difference between treatment groups. Moreover, there are two main areas i.e. Estimating
parameter and Hypothesis test. Hence, it can be said that in order to make judgement of
probability that an observed difference between groups is a dependable, inferential statistics is
used.
For example, a mall wants to make a survey and pick an employee, ask to collect sample of
100 who like shopping. Then during this time, there are two option available to an employee.
First is to make a bar chart which contain yes or no answers which is known as descriptive
statistic. Next answer is such that around 75-80% of the population like to do shopping which is
known as inferential statistics.
61
61
62
63
64
66
67
67
68
69
71
71
76
78
81
83
18
90th Percentile =
0.90*20
79.5
Interpretation: From the above table, it is interpreted that 90th percentile of 20 student’s
score is falls under 18 which is a whole number. That is why, as per standard formula, both 18th
and 19th scores are taken and then average is used. Then the outcome (79.5) clearly indicate that
the student scores 79.5% as per the set percentile.
b. Presenting inferential statistics with examples
Inferential statistics allows to make predictions from the data. Also, it is used to compare the
difference between treatment groups. Moreover, there are two main areas i.e. Estimating
parameter and Hypothesis test. Hence, it can be said that in order to make judgement of
probability that an observed difference between groups is a dependable, inferential statistics is
used.
For example, a mall wants to make a survey and pick an employee, ask to collect sample of
100 who like shopping. Then during this time, there are two option available to an employee.
First is to make a bar chart which contain yes or no answers which is known as descriptive
statistic. Next answer is such that around 75-80% of the population like to do shopping which is
known as inferential statistics.
End of preview
Want to access all the pages? Upload your documents or become a member.
Related Documents
Comparative Analysis of Exam Scores using Boxplots, Histograms, F-test, Confidence Interval and Hypothesis Testlg...
|8
|785
|125
Statistics And Research Methods for Businesslg...
|6
|700
|35
Business Statistics - Deskliblg...
|7
|545
|169
SPSS Project: Data Analysis and Findingslg...
|10
|1167
|63
Data Analysis Assignment | Question & Answerlg...
|18
|3322
|241
Questions and Answers of Statisticslg...
|10
|390
|16