Statistics for Management: Data Analysis and Inflation Report - 2024
VerifiedAdded on 2020/11/23
|15
|3242
|330
Report
AI Summary
This report presents a comprehensive statistical analysis for management, focusing on data related to consumer price index (CPI), retail price index (RPI), and inflation rates. The analysis includes the collection of data from the Office of National Statistics, tabular and graphical representations of the data over a 10-year period, and a comparison of CPI and RPI. The report also delves into the calculation of annual inflation rates and explains their importance. Furthermore, it explores hourly earnings data, calculating median, quartile, mean, and standard deviation, and comparing earnings between London and Manchester. The report concludes with a paired t-test analysis and graphical representations, such as bar and ogive charts, to illustrate the findings. The statistical tools used support decision-making processes in business planning and data interpretation.

STATISTICS FOR
MANAGEMENT
MANAGEMENT
Paraphrase This Document
Need a fresh take? Get an instant paraphrase of this document with our AI Paraphraser
Table of Contents
INTRODUCTION...........................................................................................................................1
ACTIVITY 1....................................................................................................................................1
a. Collection of data related with CPI and RPI from website of Office of National Statistics...1
b. Representation of data in tabular and graphical format to show the changes in indices over
a period of 10 years.....................................................................................................................3
c. Presenting the differences between CPI and RPI....................................................................3
d. Calculation of annual inflation by using the data of consumer price index............................5
e. Explaining the Importance of rate of inflations.......................................................................5
ACTIVITY 2....................................................................................................................................6
a.1 Estimation of median and quartile of hourly earnings..........................................................6
a.2 Hourly earning's mean and standard deviation .....................................................................7
b. Earnings of London and Manchester with appropriate comparison.......................................8
ACTIVITY 3....................................................................................................................................9
A. Paired t test (5% significance)................................................................................................9
B. Representing usual conditions for paired t test.......................................................................9
C. Paired t test with 99% confidence interval.............................................................................9
ACTIVITY 4..................................................................................................................................11
A. Framing bar chart on basis of CPIH, CPI and RPI for 10 years (2007 to 2017)..................11
B. Framing Ogive chart for hourly earnings vs cumulative % staff.........................................12
CONCLUSION..............................................................................................................................12
REFERENCES..............................................................................................................................13
Inflation explained. 2018. [Online]. Available through <https://www.bbc.com/news/business-
12196322>.....................................................................................................................................13
INTRODUCTION
Statistical analysis with various tools and techniques are important for management of an
organisation as it assist in decision making process. It is determined as science of taking decision
with prevailing and upcoming uncertainties. The disciplined used for analysis and evaluation of
the data and information are financial analysis, econometric, auditing, production and operation
involving services. The statistical data analysis revolves around collection of data in its
evaluation and presented in interpretative, diagrammatic or graphical presentation. With the data
analysis interpretations are drawn in quantitative manner which aids the management in decision
making process.
In the present report, a discussion related with research of business data is done for
business planning. Consumer and retail prove index data is collected from website of office of
national statistics and same is presented in tabular and graphical manners. Along with this, per
hour pay rate in the region of UK and Manchester is presented bu using different statistical tools
such as mean and, median, standard deviation and qartile. In the last section of the report Ogive
chart is prepared for comparing the percentage of staff and their hourly earnings.
ACTIVITY 1
a. Collection of data related with CPI and RPI from website of Office of National Statistics
Consumer price index:
The consumer price index (CPI) is a measure rather examines the weighted average of
price of basket of consumer goods and services (Bachan, 2017). In takes into consideration the
changes on price of each consumer commodities in predetermined basket and them dividing the
same by number of the goods and services in the basket. The fluctuation in the CPI is one of the
most used statistics for identification of inflation or deflation.
Retail price Index:
This index defines the change in the prices of the fixed goods on the basket over a period
of time. This one of the measure of calculation of the consumer price index. This is published on
the site of Office of National statistics. The item in the basket are those which have high weighs.
CPIH:
This is an additional measure for calculation of consumer price inflation which also
includes the measure owner occupiers' housing costs (OOH). This Ooh used to exclude this cost
1
⊘ This is a preview!⊘
Do you want full access?
Subscribe today to unlock all pages.
Trusted by 1+ million students worldwide
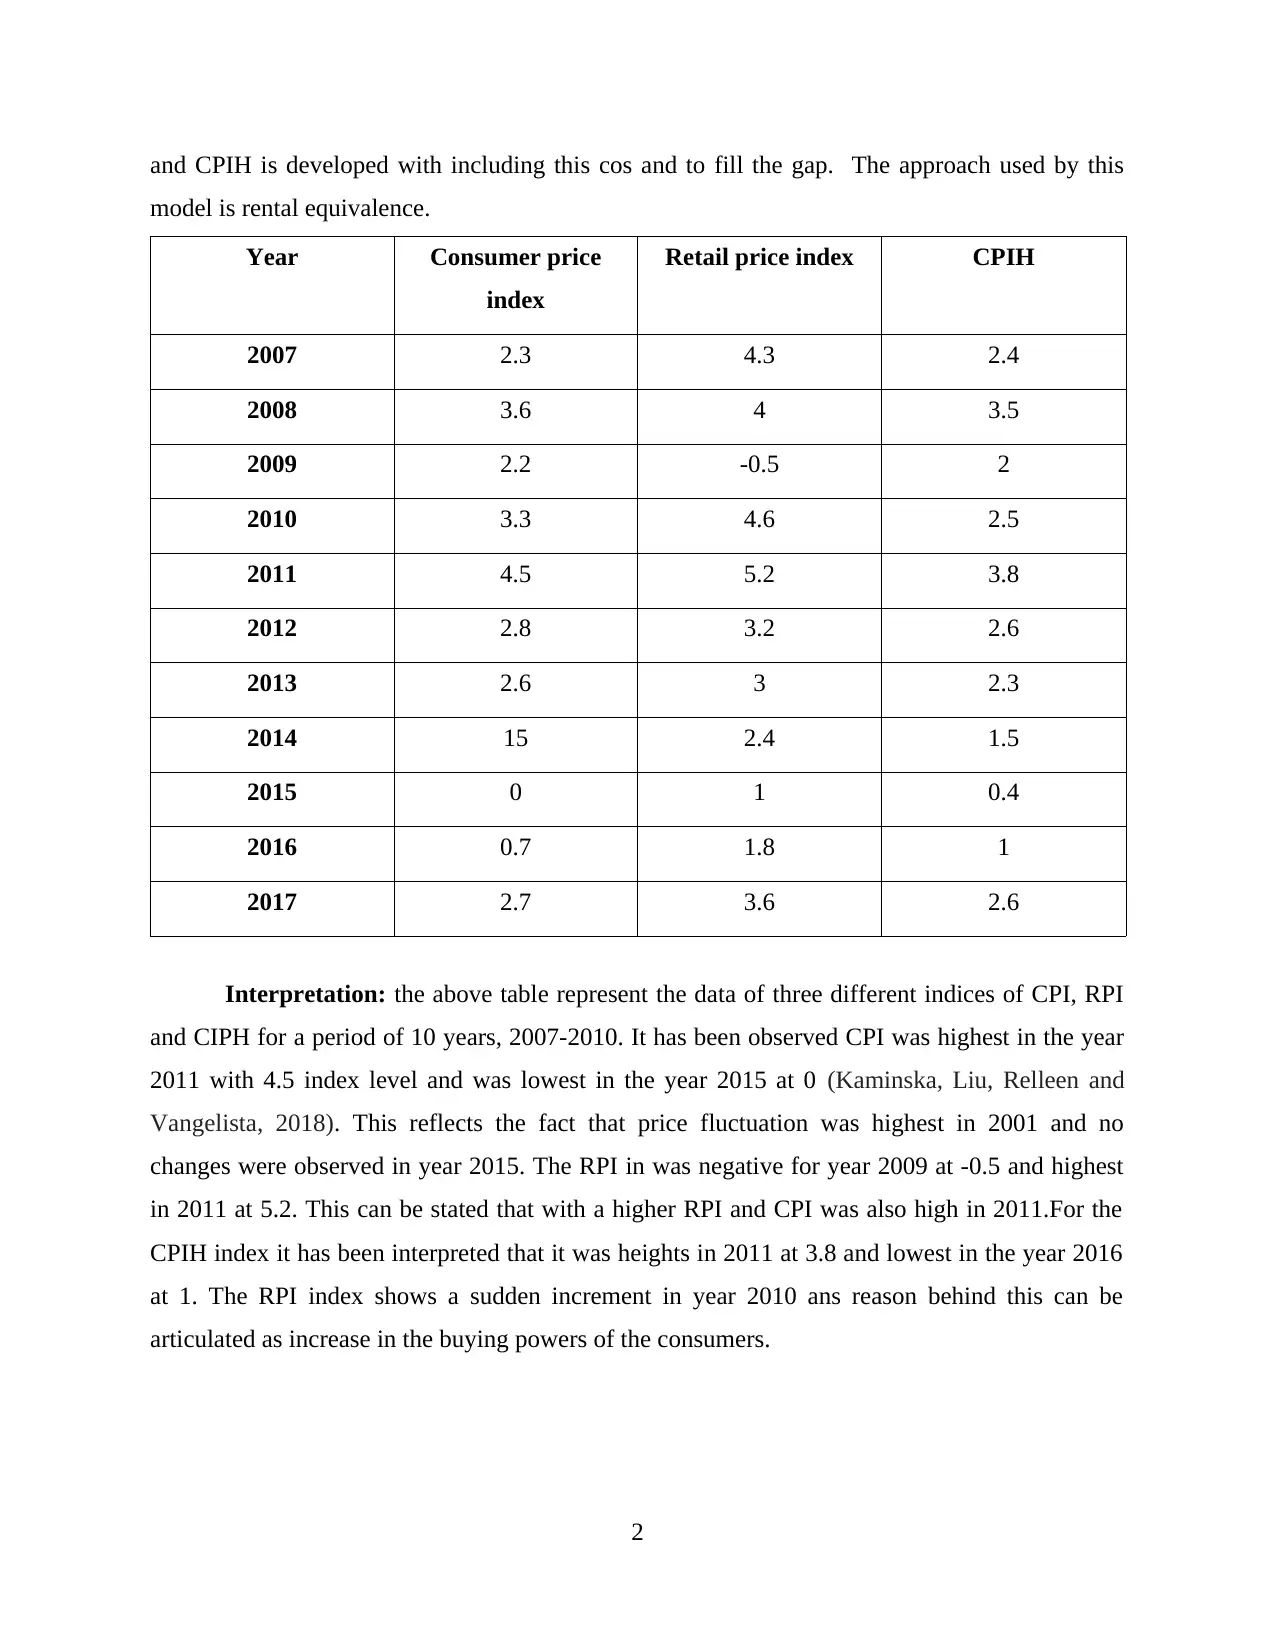
and CPIH is developed with including this cos and to fill the gap. The approach used by this
model is rental equivalence.
Year Consumer price
index
Retail price index CPIH
2007 2.3 4.3 2.4
2008 3.6 4 3.5
2009 2.2 -0.5 2
2010 3.3 4.6 2.5
2011 4.5 5.2 3.8
2012 2.8 3.2 2.6
2013 2.6 3 2.3
2014 15 2.4 1.5
2015 0 1 0.4
2016 0.7 1.8 1
2017 2.7 3.6 2.6
Interpretation: the above table represent the data of three different indices of CPI, RPI
and CIPH for a period of 10 years, 2007-2010. It has been observed CPI was highest in the year
2011 with 4.5 index level and was lowest in the year 2015 at 0 (Kaminska, Liu, Relleen and
Vangelista, 2018). This reflects the fact that price fluctuation was highest in 2001 and no
changes were observed in year 2015. The RPI in was negative for year 2009 at -0.5 and highest
in 2011 at 5.2. This can be stated that with a higher RPI and CPI was also high in 2011.For the
CPIH index it has been interpreted that it was heights in 2011 at 3.8 and lowest in the year 2016
at 1. The RPI index shows a sudden increment in year 2010 ans reason behind this can be
articulated as increase in the buying powers of the consumers.
2
Paraphrase This Document
Need a fresh take? Get an instant paraphrase of this document with our AI Paraphraser
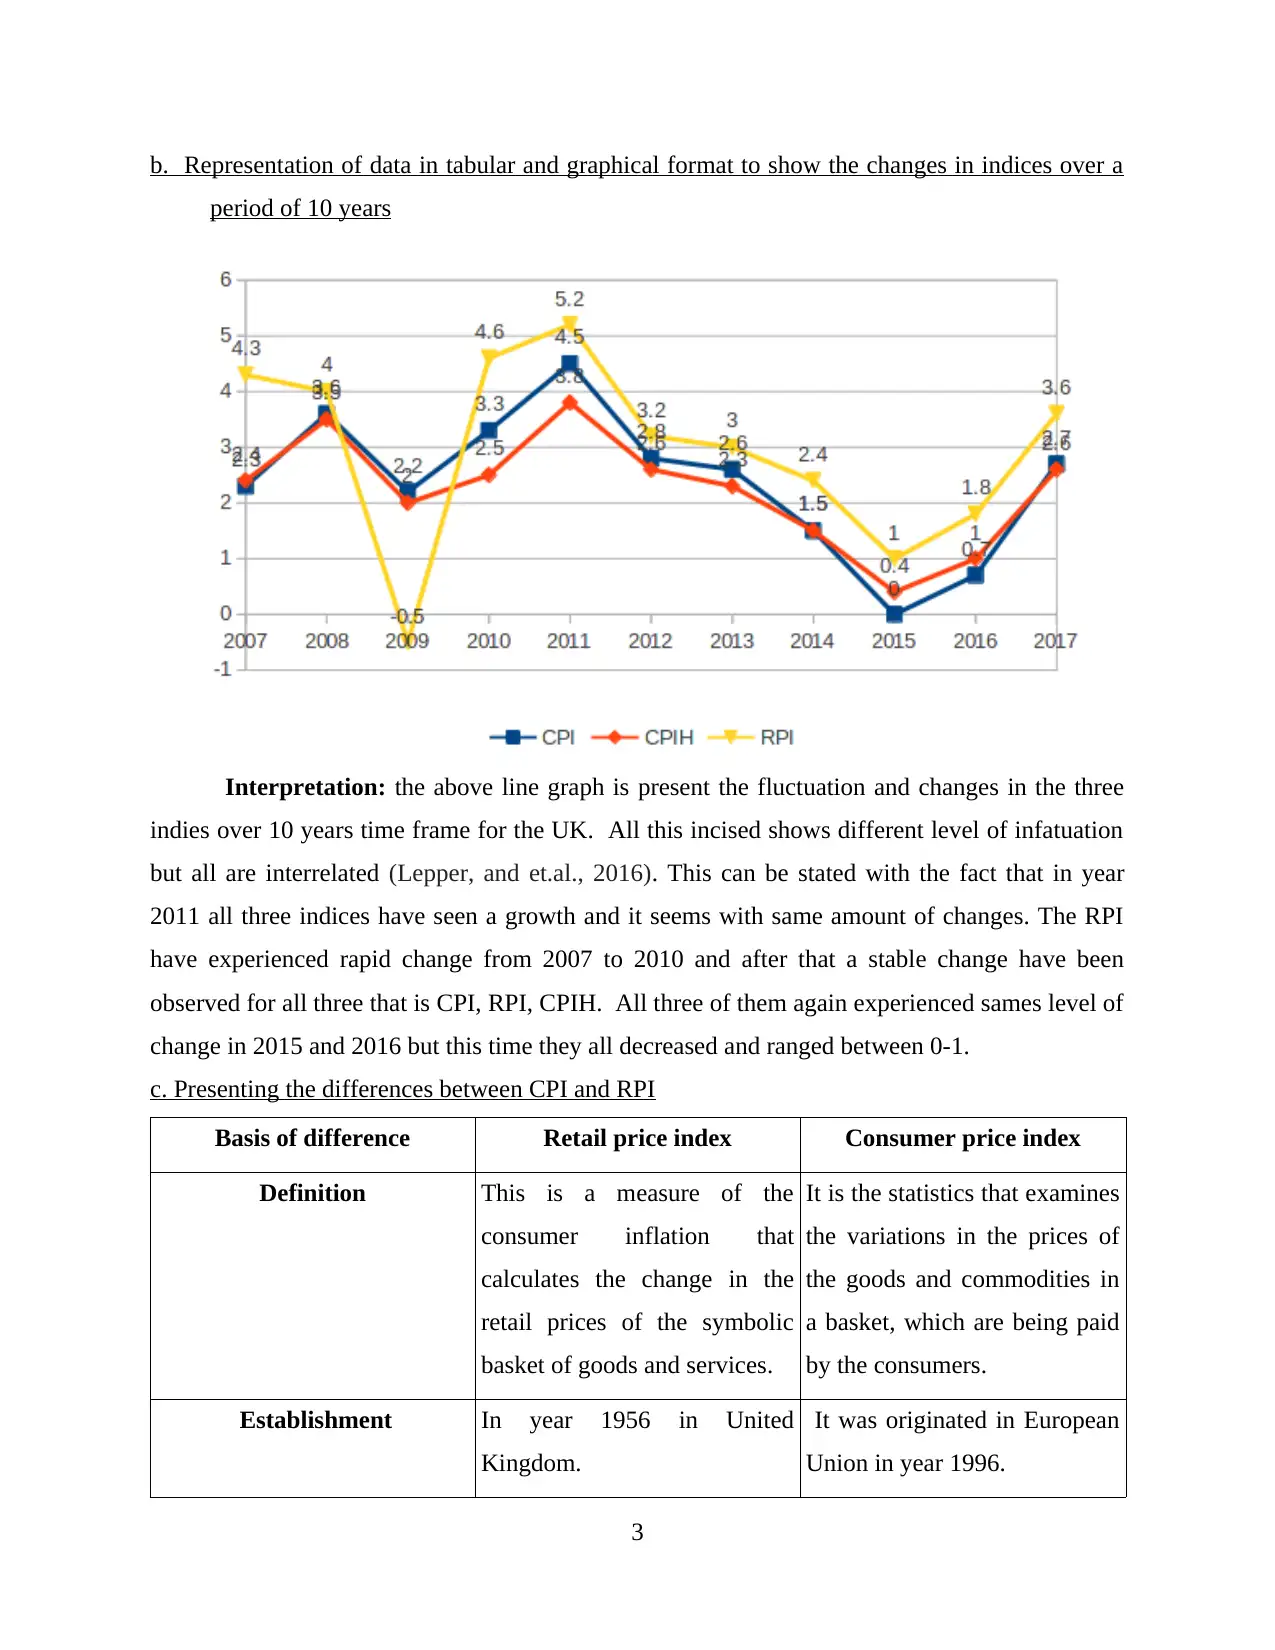
b. Representation of data in tabular and graphical format to show the changes in indices over a
period of 10 years
Interpretation: the above line graph is present the fluctuation and changes in the three
indies over 10 years time frame for the UK. All this incised shows different level of infatuation
but all are interrelated (Lepper, and et.al., 2016). This can be stated with the fact that in year
2011 all three indices have seen a growth and it seems with same amount of changes. The RPI
have experienced rapid change from 2007 to 2010 and after that a stable change have been
observed for all three that is CPI, RPI, CPIH. All three of them again experienced sames level of
change in 2015 and 2016 but this time they all decreased and ranged between 0-1.
c. Presenting the differences between CPI and RPI
Basis of difference Retail price index Consumer price index
Definition This is a measure of the
consumer inflation that
calculates the change in the
retail prices of the symbolic
basket of goods and services.
It is the statistics that examines
the variations in the prices of
the goods and commodities in
a basket, which are being paid
by the consumers.
Establishment In year 1956 in United
Kingdom.
It was originated in European
Union in year 1996.
3
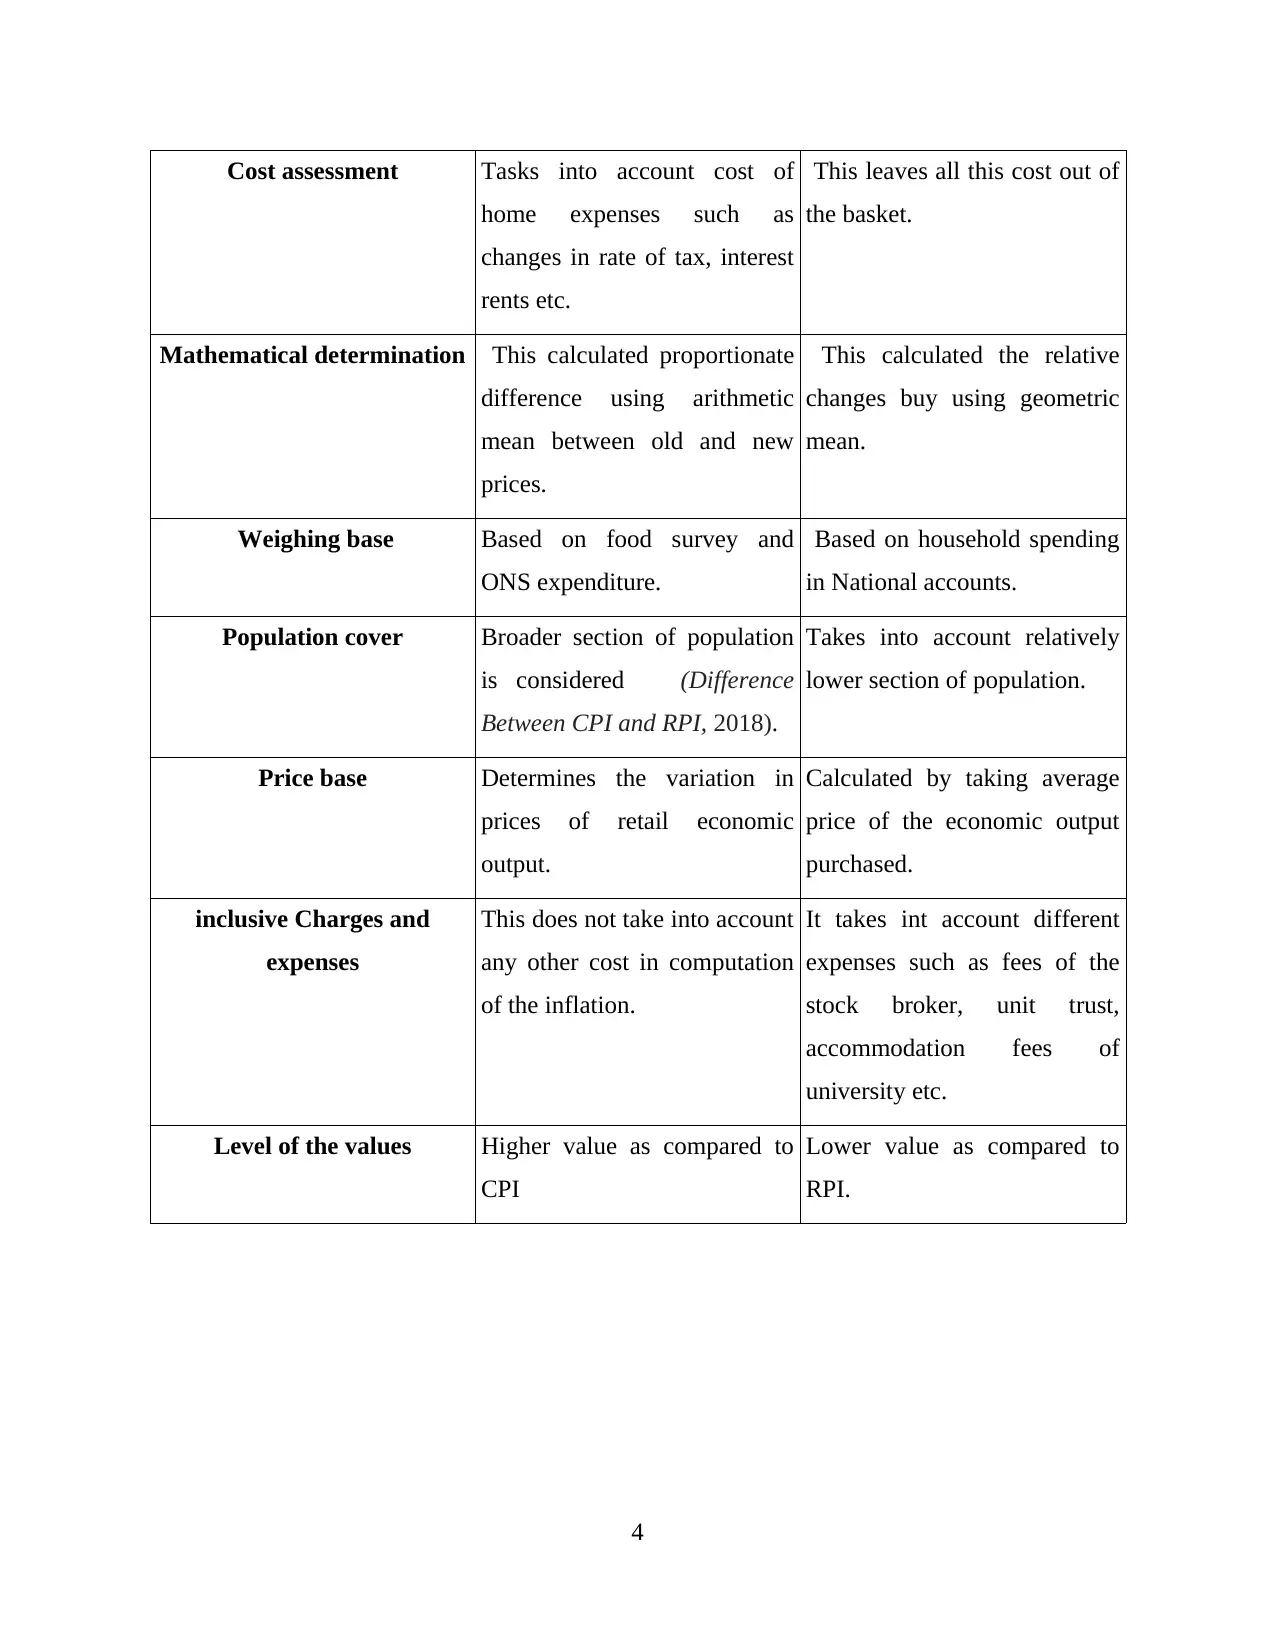
Cost assessment Tasks into account cost of
home expenses such as
changes in rate of tax, interest
rents etc.
This leaves all this cost out of
the basket.
Mathematical determination This calculated proportionate
difference using arithmetic
mean between old and new
prices.
This calculated the relative
changes buy using geometric
mean.
Weighing base Based on food survey and
ONS expenditure.
Based on household spending
in National accounts.
Population cover Broader section of population
is considered (Difference
Between CPI and RPI, 2018).
Takes into account relatively
lower section of population.
Price base Determines the variation in
prices of retail economic
output.
Calculated by taking average
price of the economic output
purchased.
inclusive Charges and
expenses
This does not take into account
any other cost in computation
of the inflation.
It takes int account different
expenses such as fees of the
stock broker, unit trust,
accommodation fees of
university etc.
Level of the values Higher value as compared to
CPI
Lower value as compared to
RPI.
4
⊘ This is a preview!⊘
Do you want full access?
Subscribe today to unlock all pages.
Trusted by 1+ million students worldwide
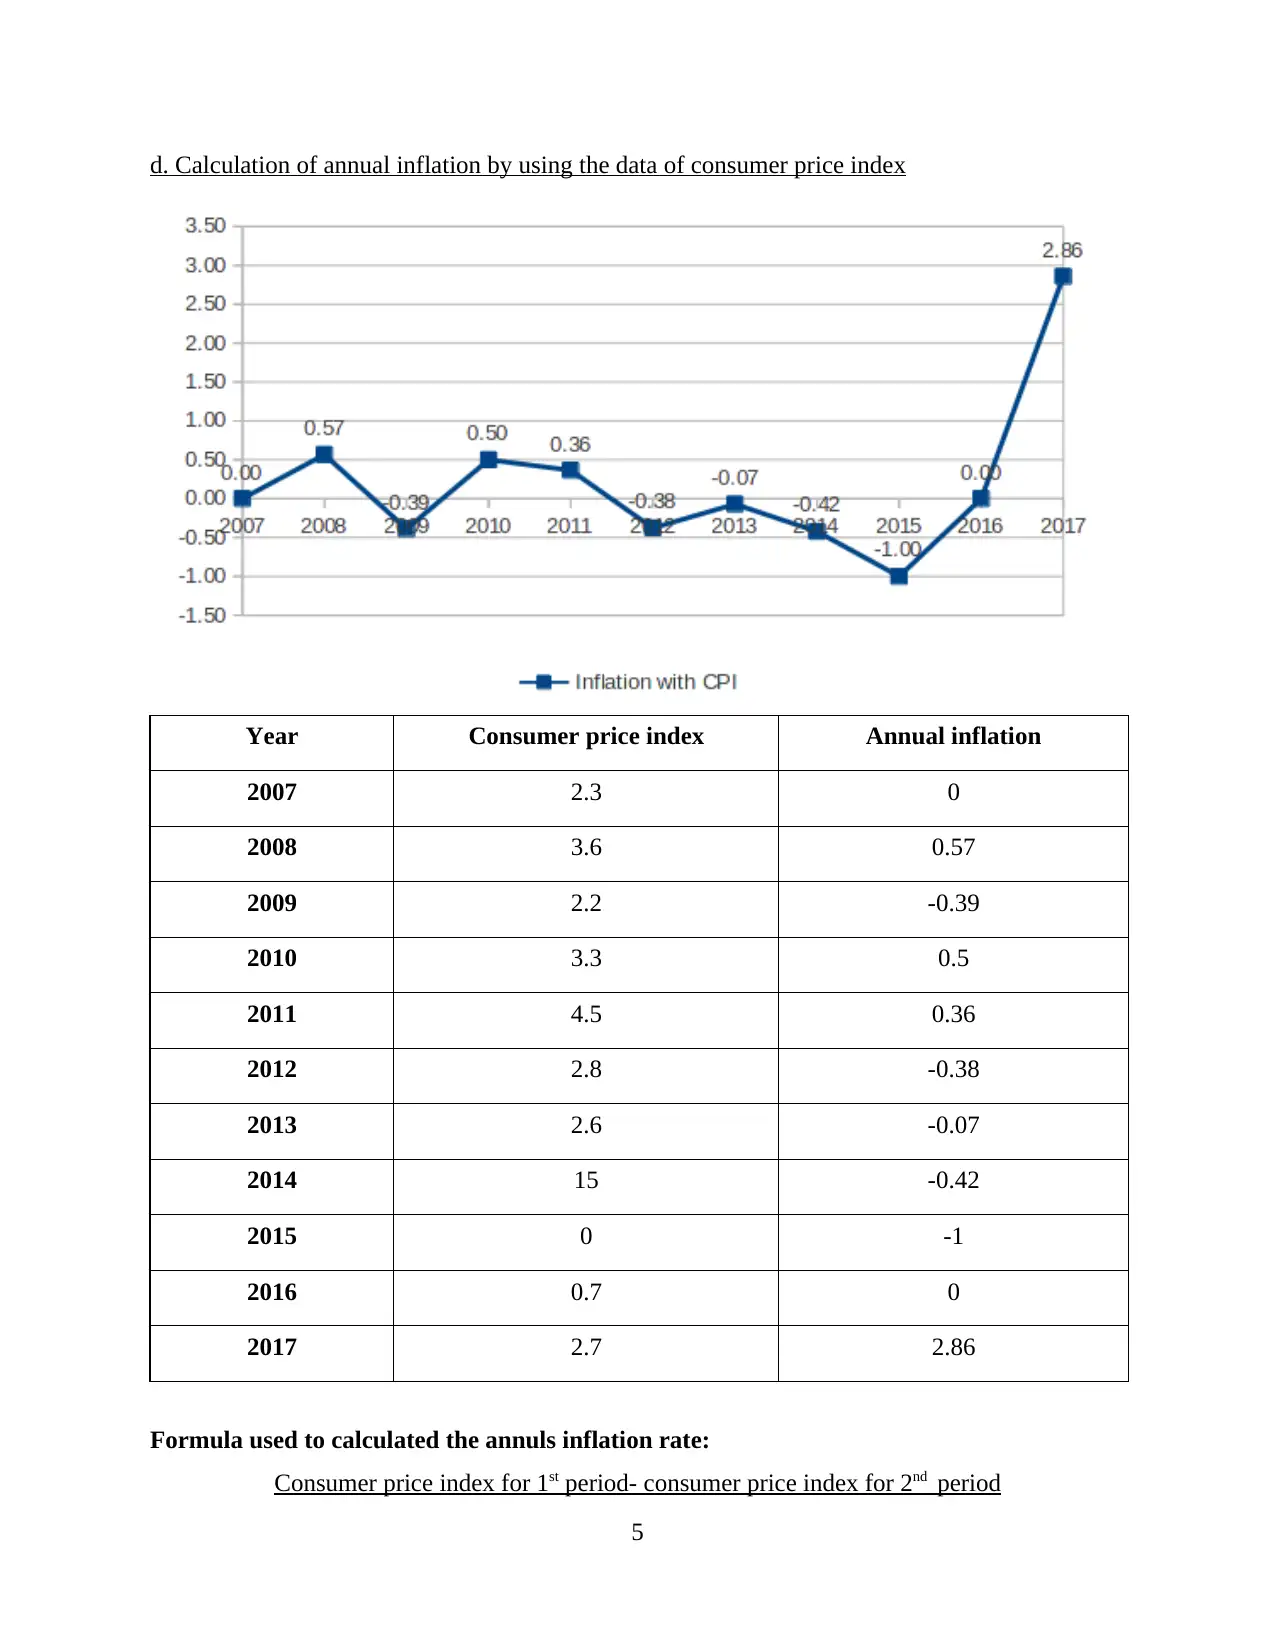
d. Calculation of annual inflation by using the data of consumer price index
Year Consumer price index Annual inflation
2007 2.3 0
2008 3.6 0.57
2009 2.2 -0.39
2010 3.3 0.5
2011 4.5 0.36
2012 2.8 -0.38
2013 2.6 -0.07
2014 15 -0.42
2015 0 -1
2016 0.7 0
2017 2.7 2.86
Formula used to calculated the annuls inflation rate:
Consumer price index for 1st period- consumer price index for 2nd period
5
Paraphrase This Document
Need a fresh take? Get an instant paraphrase of this document with our AI Paraphraser
Consumer price index for 1st period
e. Explaining the Importance of rate of inflations
Inflation: this is a measure that determined the hike and rise in the prices of goods and
services for a nation. There different methods to determined the inflation but most commonly
used tools are consumer price index (CPI) and retail price index (RPI). Both the indices take into
account different products which are used by us in daily life and are expressed in terms of
percentage.
The importance of the statistical tool can be established with the fact that the banks in
England uses the rates of inflation (Inflation explained, 2018). To set the rate of interest. If the
bank thinks that CPI inflation will be more than 2% for next two years the interest rate will be
increased to mitigate the effect of inflation. On the contrary, the rate of interest will be cut
down, if the inflation is expected to be lower than 2%. Organization used the inflation to set up
the annual rise in the pay.
ACTIVITY 2
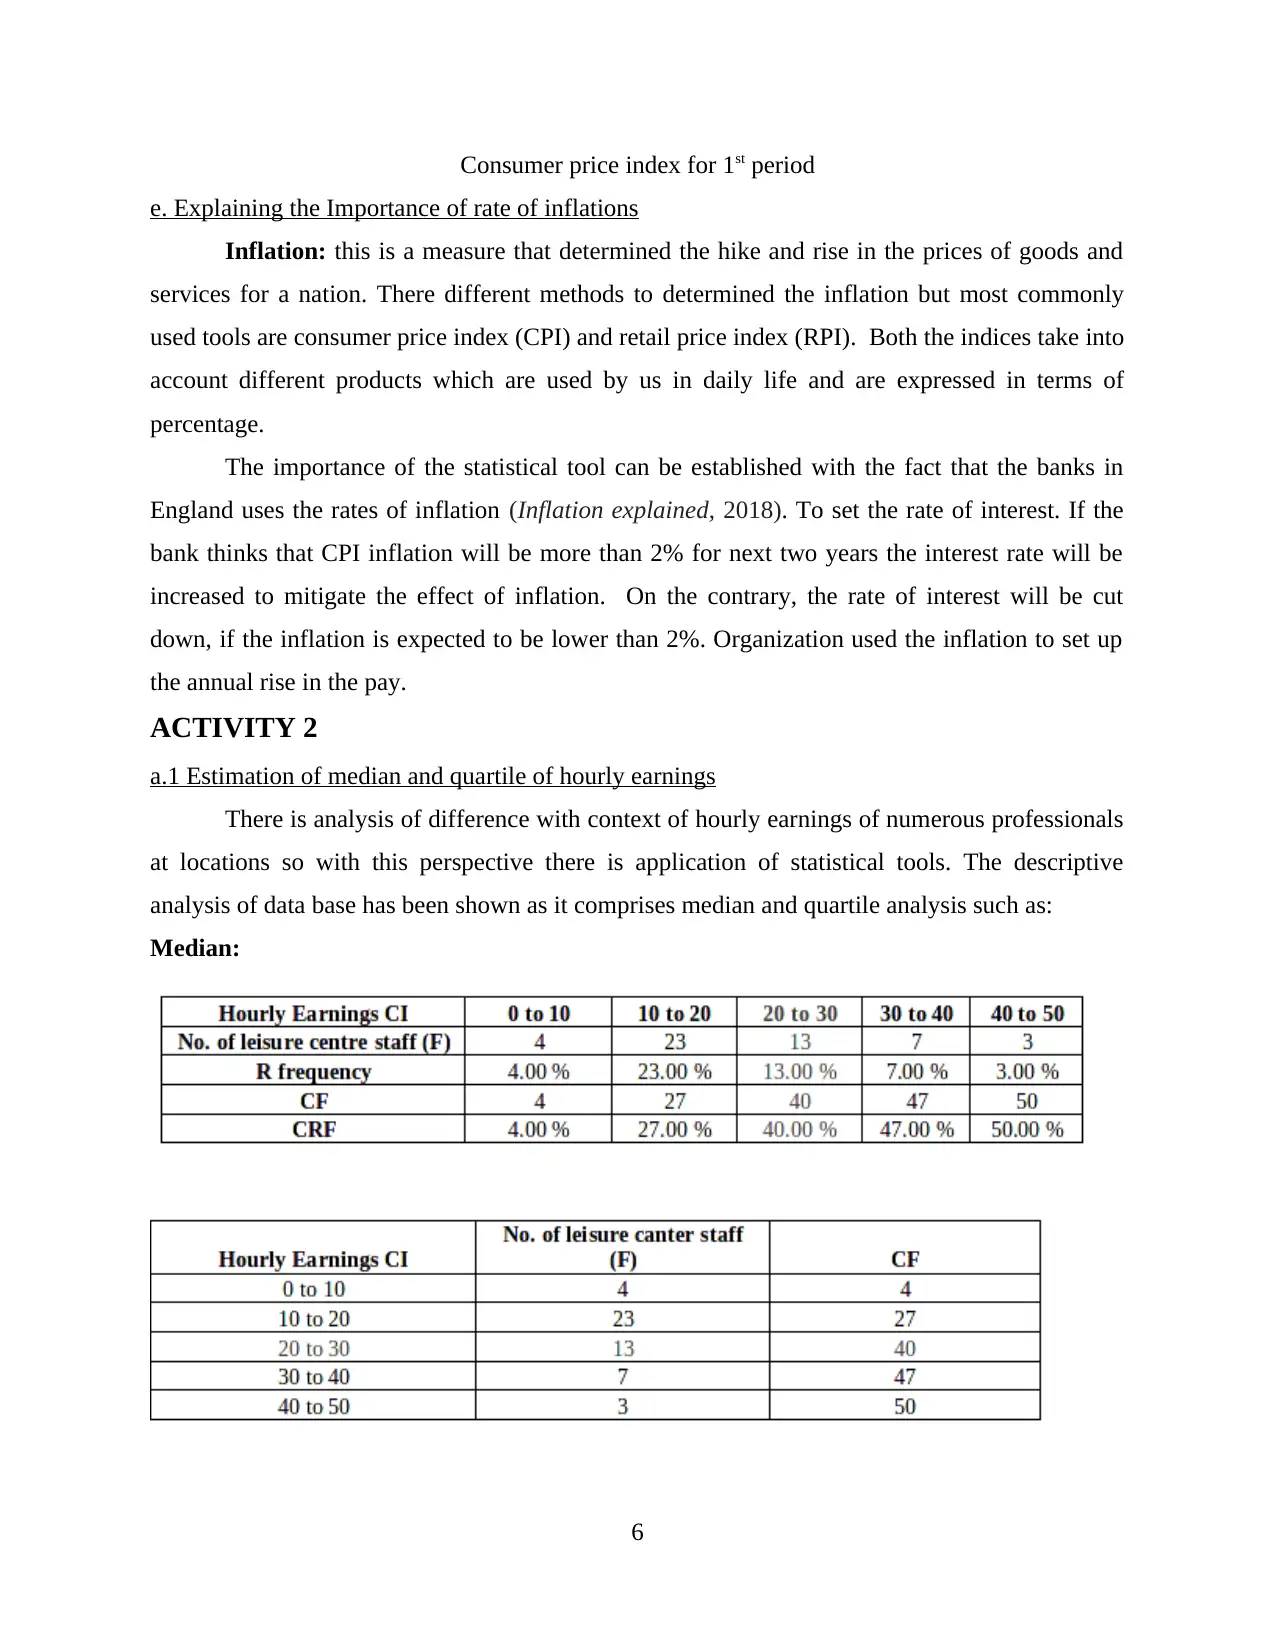
a.1 Estimation of median and quartile of hourly earnings
There is analysis of difference with context of hourly earnings of numerous professionals
at locations so with this perspective there is application of statistical tools. The descriptive
analysis of data base has been shown as it comprises median and quartile analysis such as:
Median:
6
e. Explaining the Importance of rate of inflations
Inflation: this is a measure that determined the hike and rise in the prices of goods and
services for a nation. There different methods to determined the inflation but most commonly
used tools are consumer price index (CPI) and retail price index (RPI). Both the indices take into
account different products which are used by us in daily life and are expressed in terms of
percentage.
The importance of the statistical tool can be established with the fact that the banks in
England uses the rates of inflation (Inflation explained, 2018). To set the rate of interest. If the
bank thinks that CPI inflation will be more than 2% for next two years the interest rate will be
increased to mitigate the effect of inflation. On the contrary, the rate of interest will be cut
down, if the inflation is expected to be lower than 2%. Organization used the inflation to set up
the annual rise in the pay.
ACTIVITY 2
a.1 Estimation of median and quartile of hourly earnings
There is analysis of difference with context of hourly earnings of numerous professionals
at locations so with this perspective there is application of statistical tools. The descriptive
analysis of data base has been shown as it comprises median and quartile analysis such as:
Median:
6
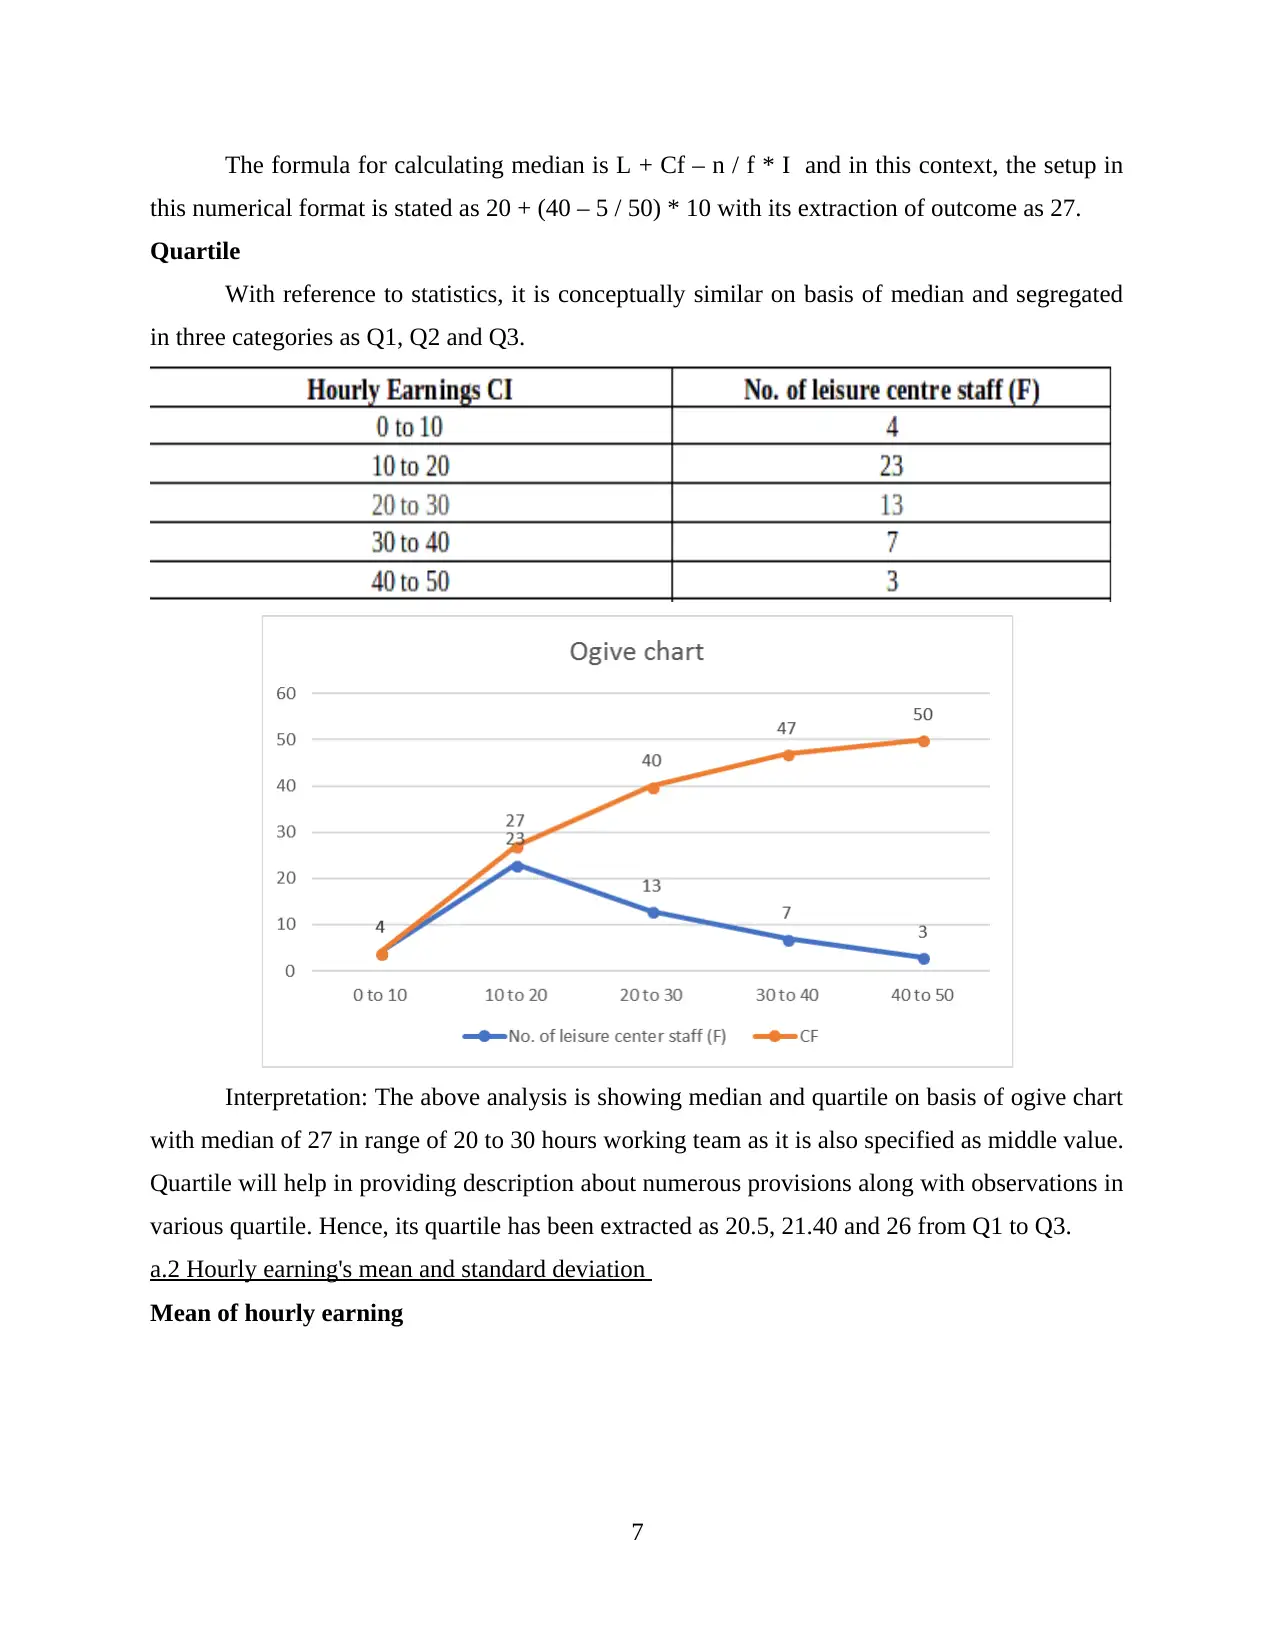
The formula for calculating median is L + Cf – n / f * I and in this context, the setup in
this numerical format is stated as 20 + (40 – 5 / 50) * 10 with its extraction of outcome as 27.
Quartile
With reference to statistics, it is conceptually similar on basis of median and segregated
in three categories as Q1, Q2 and Q3.
Interpretation: The above analysis is showing median and quartile on basis of ogive chart
with median of 27 in range of 20 to 30 hours working team as it is also specified as middle value.
Quartile will help in providing description about numerous provisions along with observations in
various quartile. Hence, its quartile has been extracted as 20.5, 21.40 and 26 from Q1 to Q3.
a.2 Hourly earning's mean and standard deviation
Mean of hourly earning
7
⊘ This is a preview!⊘
Do you want full access?
Subscribe today to unlock all pages.
Trusted by 1+ million students worldwide
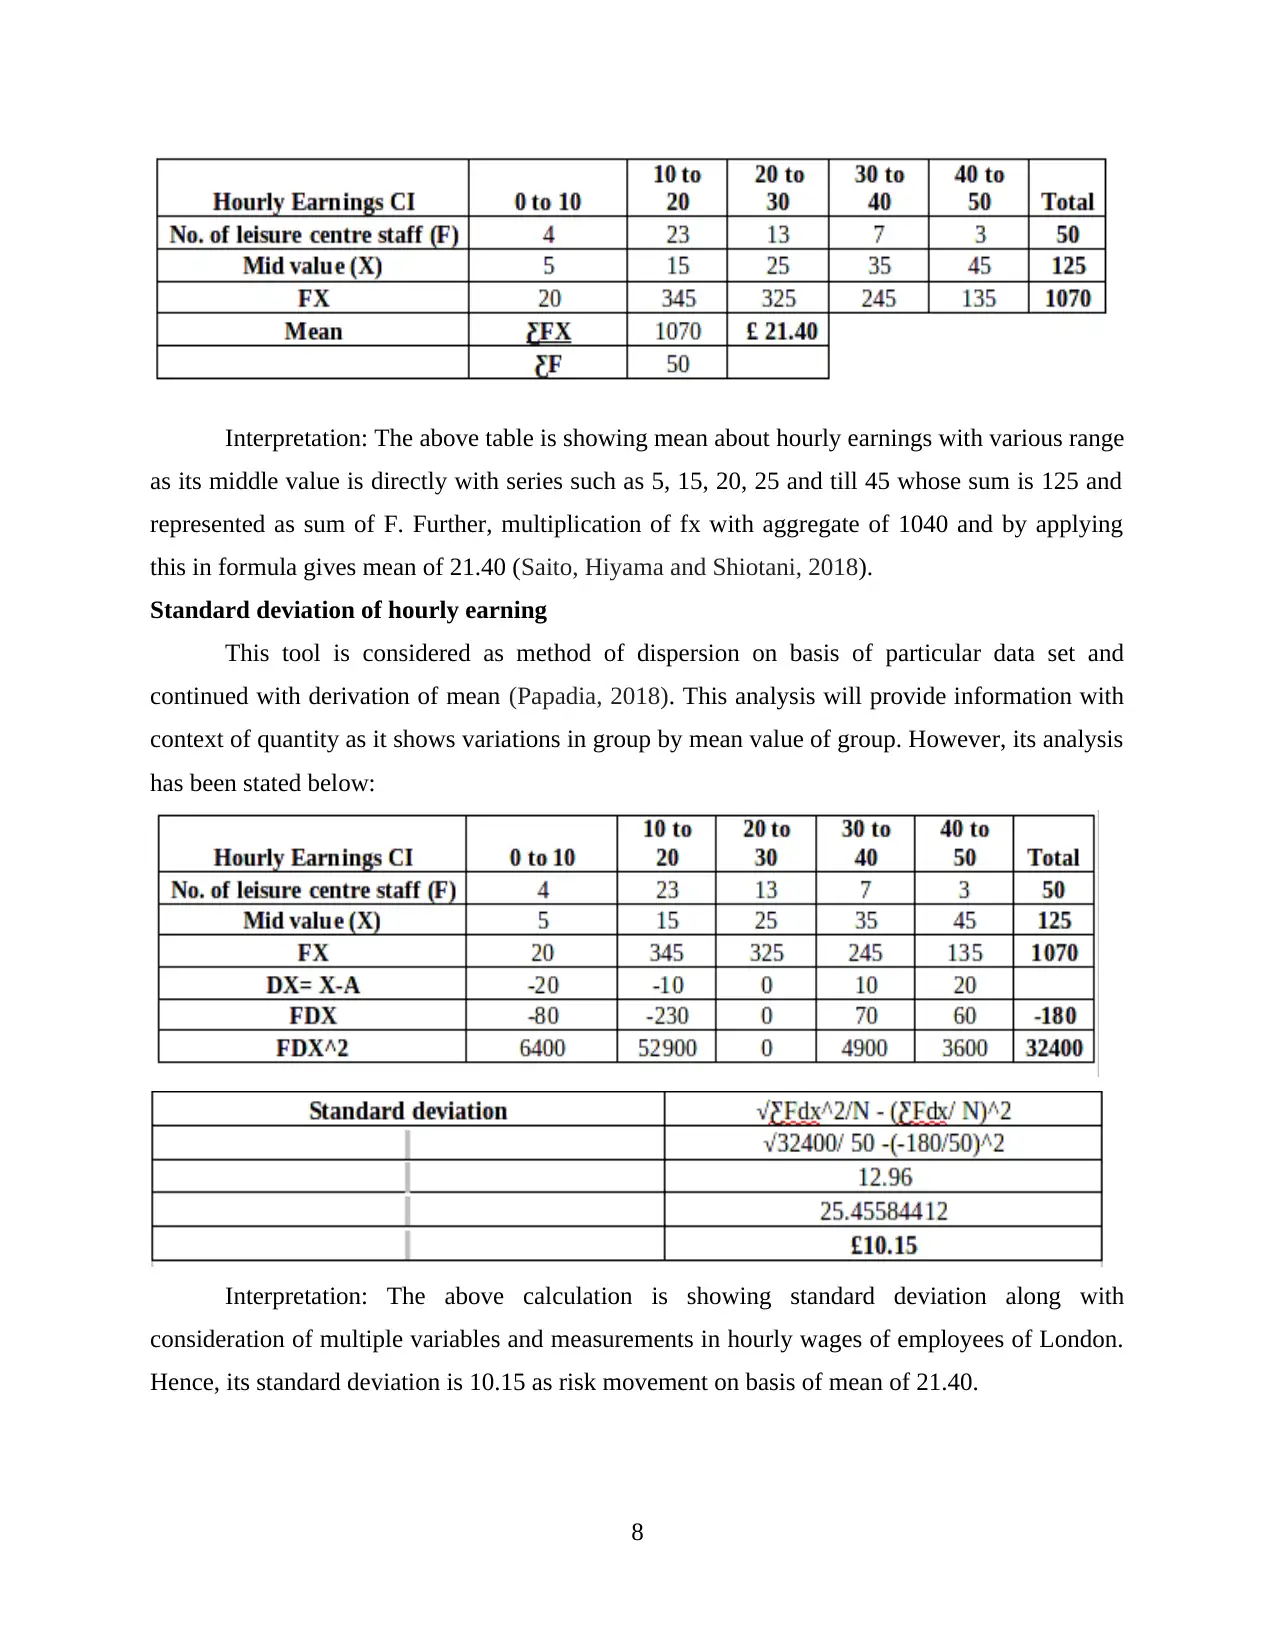
Interpretation: The above table is showing mean about hourly earnings with various range
as its middle value is directly with series such as 5, 15, 20, 25 and till 45 whose sum is 125 and
represented as sum of F. Further, multiplication of fx with aggregate of 1040 and by applying
this in formula gives mean of 21.40 (Saito, Hiyama and Shiotani, 2018).
Standard deviation of hourly earning
This tool is considered as method of dispersion on basis of particular data set and
continued with derivation of mean (Papadia, 2018). This analysis will provide information with
context of quantity as it shows variations in group by mean value of group. However, its analysis
has been stated below:
Interpretation: The above calculation is showing standard deviation along with
consideration of multiple variables and measurements in hourly wages of employees of London.
Hence, its standard deviation is 10.15 as risk movement on basis of mean of 21.40.
8
Paraphrase This Document
Need a fresh take? Get an instant paraphrase of this document with our AI Paraphraser
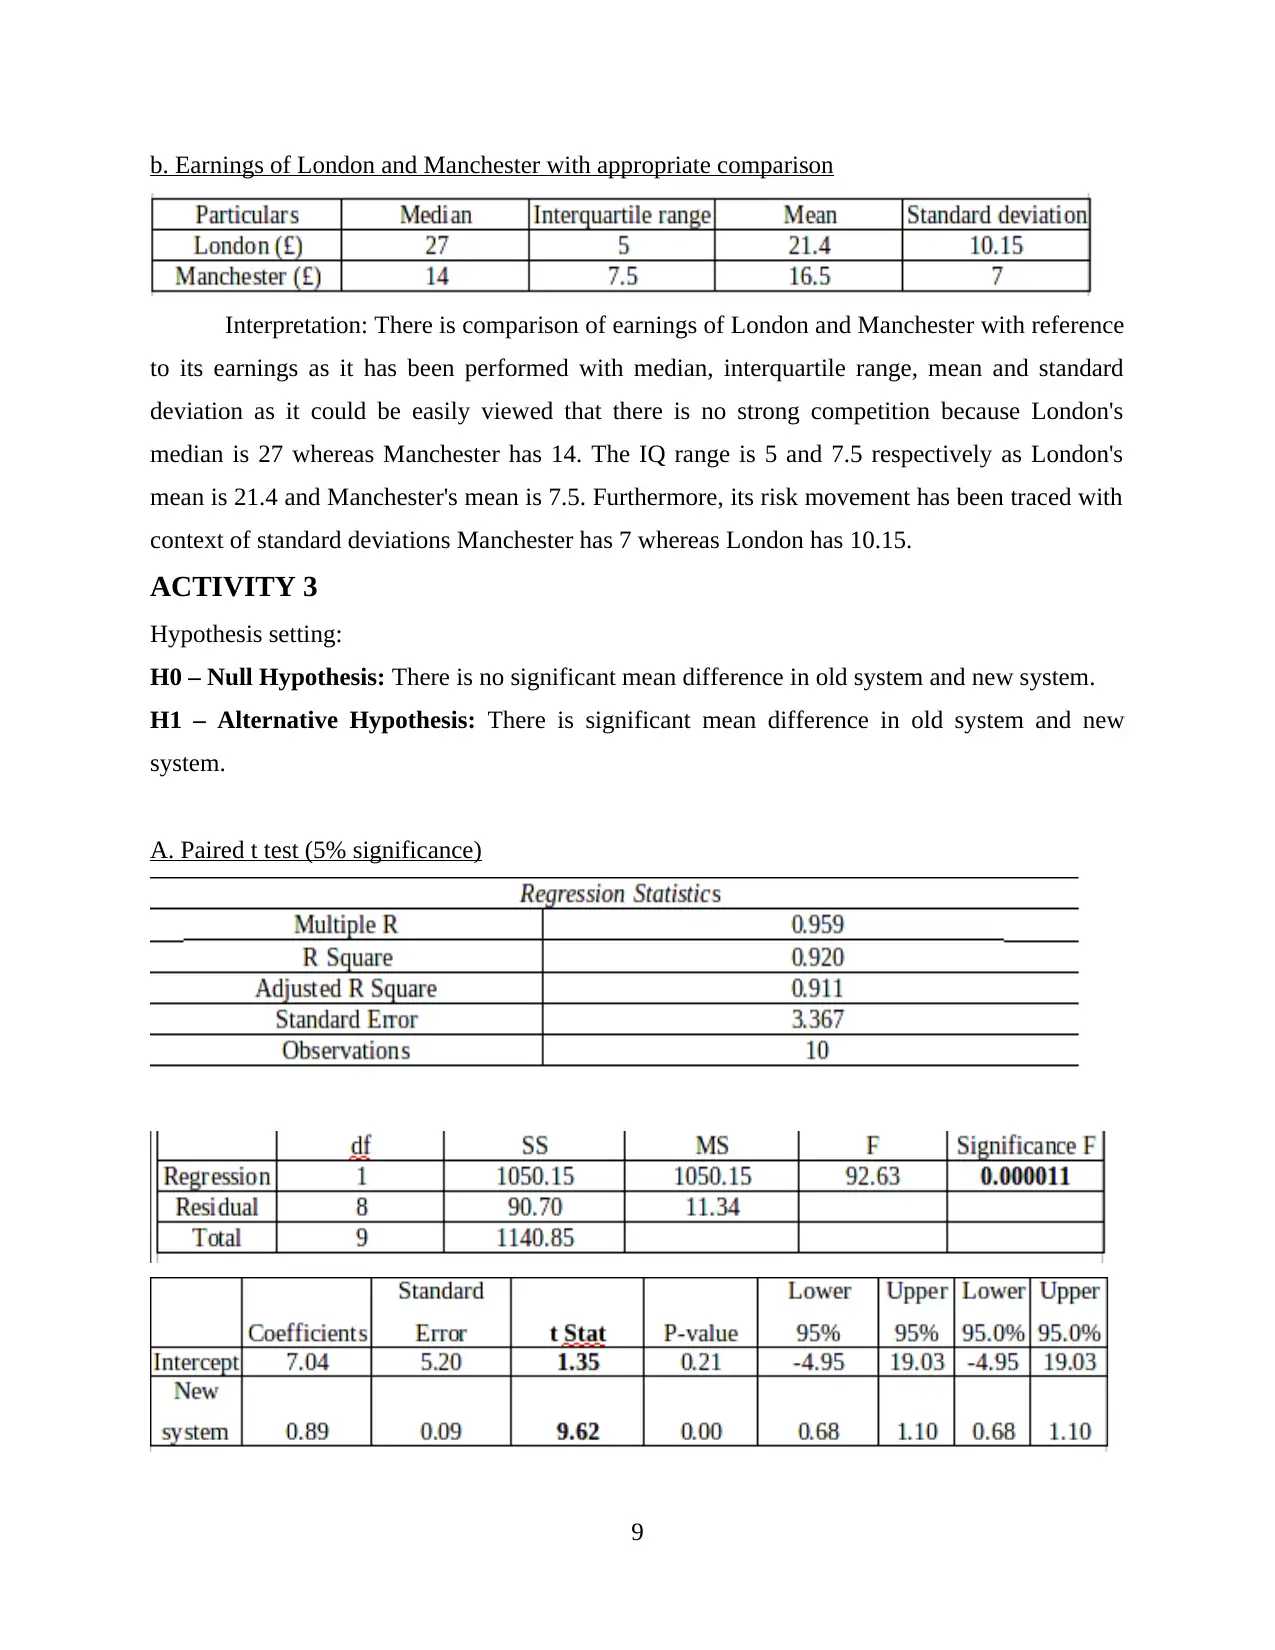
b. Earnings of London and Manchester with appropriate comparison
Interpretation: There is comparison of earnings of London and Manchester with reference
to its earnings as it has been performed with median, interquartile range, mean and standard
deviation as it could be easily viewed that there is no strong competition because London's
median is 27 whereas Manchester has 14. The IQ range is 5 and 7.5 respectively as London's
mean is 21.4 and Manchester's mean is 7.5. Furthermore, its risk movement has been traced with
context of standard deviations Manchester has 7 whereas London has 10.15.
ACTIVITY 3
Hypothesis setting:
H0 – Null Hypothesis: There is no significant mean difference in old system and new system.
H1 – Alternative Hypothesis: There is significant mean difference in old system and new
system.
A. Paired t test (5% significance)
9
B. Representing usual conditions for paired t test
Interpretation: The above outcome is analysis of paired t test with two sample mean as it
has considered 5% significance level or confidence interval of 95%. The selection criteria for
rejecting or accepting hypothesis is based on p value as if its is lower than 0.05 then alternative
hypothesis is accepted whereas it is more than 0.05 then null hypothesis is true. Hence, in this
paired two sample means the significance level is less than 0.05 then alternative hypothesis is
considered as true which elaborates about significant mean difference in old system and new
system as well (Ge, Yang and Chen, 2018).
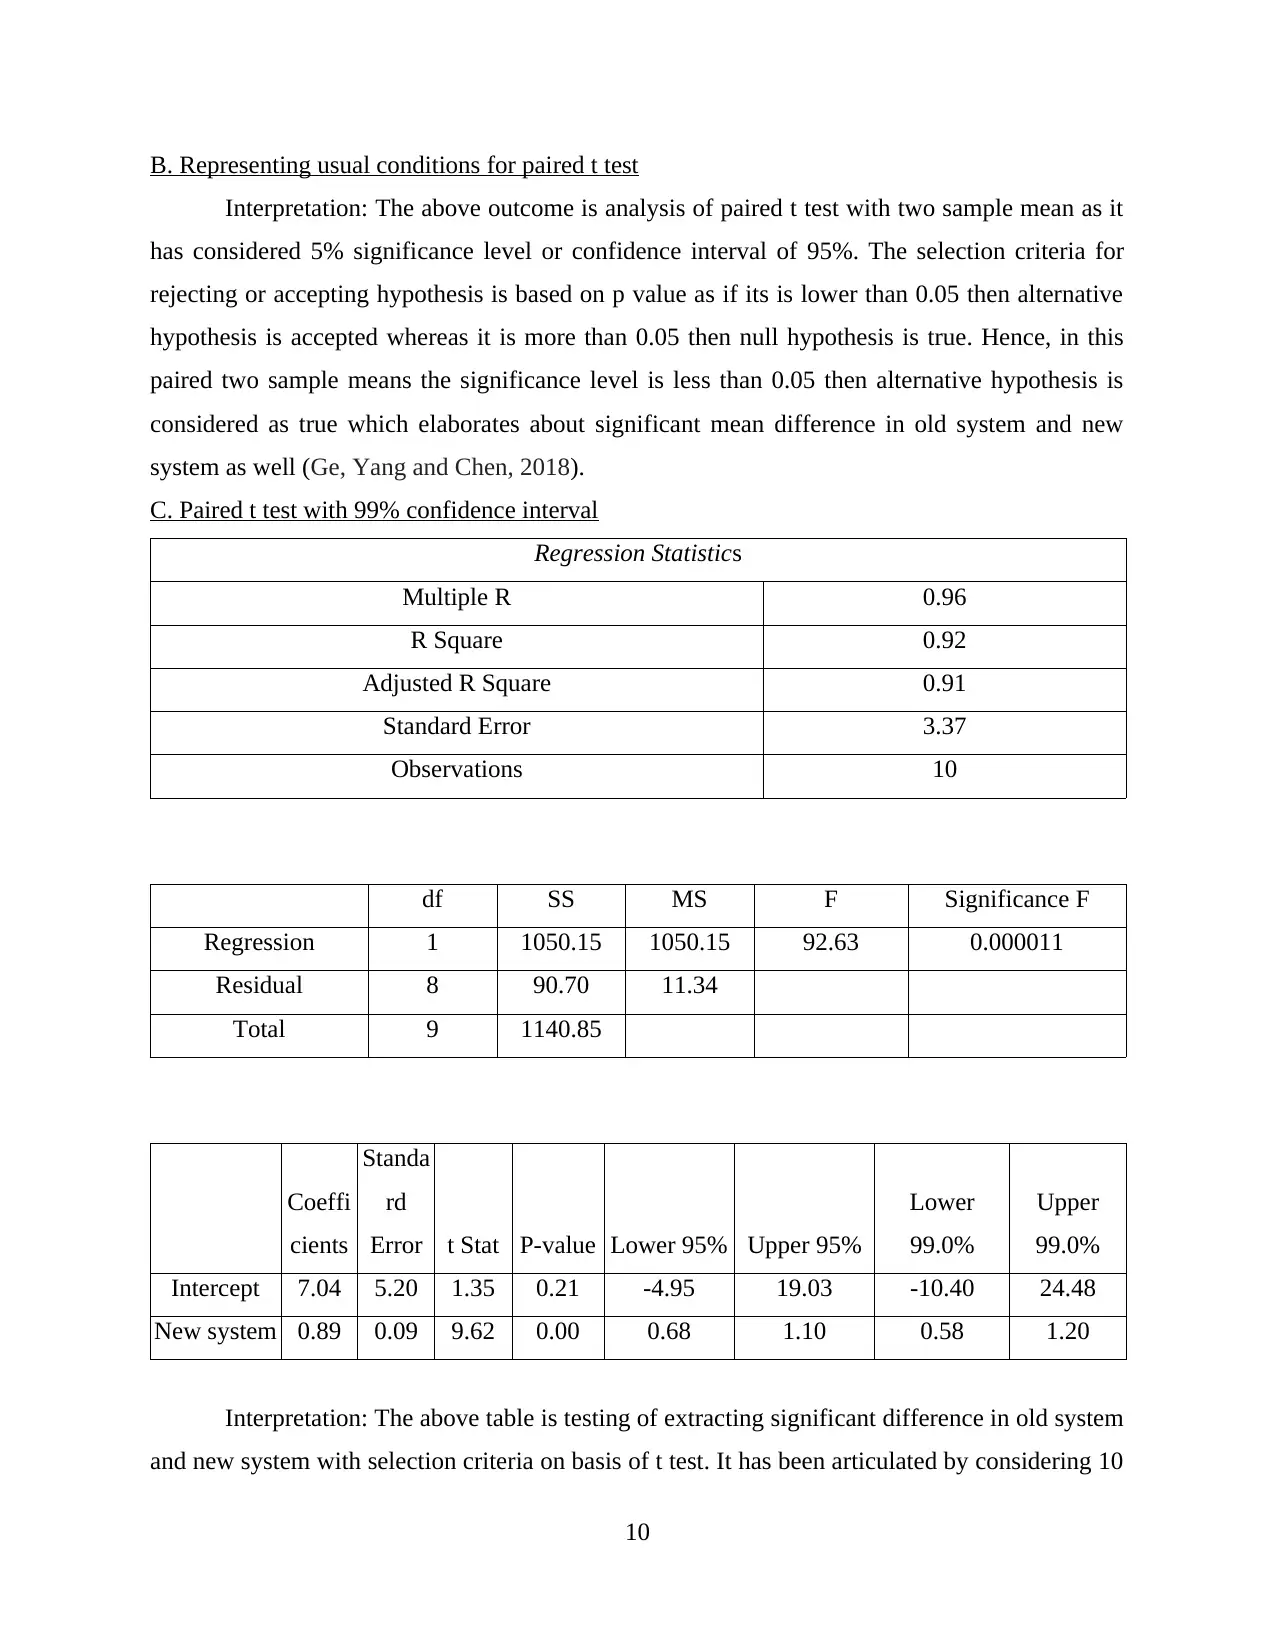
C. Paired t test with 99% confidence interval
Regression Statistics
Multiple R 0.96
R Square 0.92
Adjusted R Square 0.91
Standard Error 3.37
Observations 10
df SS MS F Significance F
Regression 1 1050.15 1050.15 92.63 0.000011
Residual 8 90.70 11.34
Total 9 1140.85
Coeffi
cients
Standa
rd
Error t Stat P-value Lower 95% Upper 95%
Lower
99.0%
Upper
99.0%
Intercept 7.04 5.20 1.35 0.21 -4.95 19.03 -10.40 24.48
New system 0.89 0.09 9.62 0.00 0.68 1.10 0.58 1.20
Interpretation: The above table is testing of extracting significant difference in old system
and new system with selection criteria on basis of t test. It has been articulated by considering 10
10
Interpretation: The above outcome is analysis of paired t test with two sample mean as it
has considered 5% significance level or confidence interval of 95%. The selection criteria for
rejecting or accepting hypothesis is based on p value as if its is lower than 0.05 then alternative
hypothesis is accepted whereas it is more than 0.05 then null hypothesis is true. Hence, in this
paired two sample means the significance level is less than 0.05 then alternative hypothesis is
considered as true which elaborates about significant mean difference in old system and new
system as well (Ge, Yang and Chen, 2018).
C. Paired t test with 99% confidence interval
Regression Statistics
Multiple R 0.96
R Square 0.92
Adjusted R Square 0.91
Standard Error 3.37
Observations 10
df SS MS F Significance F
Regression 1 1050.15 1050.15 92.63 0.000011
Residual 8 90.70 11.34
Total 9 1140.85
Coeffi
cients
Standa
rd
Error t Stat P-value Lower 95% Upper 95%
Lower
99.0%
Upper
99.0%
Intercept 7.04 5.20 1.35 0.21 -4.95 19.03 -10.40 24.48
New system 0.89 0.09 9.62 0.00 0.68 1.10 0.58 1.20
Interpretation: The above table is testing of extracting significant difference in old system
and new system with selection criteria on basis of t test. It has been articulated by considering 10
10
⊘ This is a preview!⊘
Do you want full access?
Subscribe today to unlock all pages.
Trusted by 1+ million students worldwide
1 out of 15
Related Documents


Your All-in-One AI-Powered Toolkit for Academic Success.
+13062052269
info@desklib.com
Available 24*7 on WhatsApp / Email
![[object Object]](/_next/static/media/star-bottom.7253800d.svg)
Unlock your academic potential
Copyright © 2020–2026 A2Z Services. All Rights Reserved. Developed and managed by ZUCOL.