Statistics for Management Report: Data Analysis and Insights
VerifiedAdded on 2020/11/12
|13
|2380
|481
Report
AI Summary
This report provides a comprehensive statistical analysis of business data, focusing on retail and consumer price indices (RPI) and consumer price indices (CPI). The analysis includes representing data using tables, charts, and graphs, reflecting variations in RPI and CPI, and calculating yearly inflation rates. The report also explores hourly pay rates across different UK regions, utilizing Ogive curves to determine median earnings and quartiles, and calculating standard deviation and mean. Additionally, it involves paired t-tests and t-tests with confidence intervals to assess the significance of differences in means. The report concludes with a bar chart illustrating changes in CPI and RPI over a decade and an Ogive chart for cumulative staff percentages versus hourly earnings. The methodology includes the use of statistical tools and techniques to interpret raw business data, with references to relevant sources.

STATISTICS FOR
MANAGEMENT
MANAGEMENT
Paraphrase This Document
Need a fresh take? Get an instant paraphrase of this document with our AI Paraphraser
TABLE OF CONTENTS
INTRODUCTION...........................................................................................................................1
ACTIVITY 1....................................................................................................................................1
A. Representing data with context of retail and consumer price index via Office of National
Statistics.......................................................................................................................................1
B. Framing table, charts and graphs for shoeing alteration in above stated indices (2007 –
2017)............................................................................................................................................2
C. Reflecting variations in RPI and CPI......................................................................................3
D. Application for calculating yearly inflation............................................................................3
E. Explaining reason with significance of rate of inflation.........................................................4
ACTIVITY 2 (Client B)...................................................................................................................4
Hourly pay rates in various region of UK....................................................................................4
A.1 Reflecting Ogive for determining median hourly earnings along with quartiles..................4
A.2 Extracting standard deviation and mean for hourly earnings...............................................6
B. Specifying comparison in earnings of two regions.................................................................7
ACTIVITY 3 (Client E)...................................................................................................................8
A. Paired t test with significance level of 5%..............................................................................8
B. Paired t test with usual conditions...........................................................................................8
C. t test with 99% confidence interval for reducing mean...........................................................8
ACTIVITY 4....................................................................................................................................9
A. Bar chart for showing change in CPI and RPI of year (2007 – 2017)....................................9
B. Ogive for cumulative % of staff vs hourly earnings ............................................................10
CONCLUSION..............................................................................................................................10
REFERENCES..............................................................................................................................11
INTRODUCTION
Statistics is replicated as form of mathematical analysis which is using various qualified
models, synopses and representations of specified set of experimental data and real life studies.
Usually this term summarizes process with application of charactering data base. In case data set
is highly dependent on larger population sample then the analyst would be developing numerous
interpretations with context of population which were initially on basis of statistical results to
form sample. The statistical analysis comprises process of evaluating and gathering data and then
it is summarised in mathematical aspect. Statistics helps organizations for increasing global
competition as it is necessary for managers with objective of specifying different uncertainties
with use of scientific methods and main aim for decision makers.
The present report will provide brief discussion about appropriate evaluation of raw
business data with analysis of information via published sources. In the same series it will
represent analysis of different statistical method on basis of raw business data which is
articulated in graphical and statistical method. This report will be gathering data from Office of
National statistics website such as Retail and consumer price index.
ACTIVITY 1
A. Representing data with context of retail and consumer price index via Office of National
Statistics
Consumer price index: It is an economic indicator which is used as inflation measure
through proxy along with effectiveness of economic policy of government. In the similar aspect,
it is measure which helps in examining weighted average of price of basket of consumer services
and goods like transportation, food and medical care as well (Koutras and Koutras, 2018).
Retail price Index: This index is termed as measure of inflation which is published on
public platform where it traces change in cost as representatives of sample of various retail goods
and services. In simple words, it reflects alterations in cost of living along with price movement
in range of services and goods like household goods, food, housing, bus fares, housing and
petrol.
Year 2007 2008 2009 2010 2011 2012 2013 2014 2015 2016 2017
CPIH 2.4 3.5 2 2.5 3.8 2.6 2.3 1.5 0.4 1 2.6
RPI 4.3 4 -0.5 4.6 5.2 3.2 3 2.4 1 1.8 3.6
1
⊘ This is a preview!⊘
Do you want full access?
Subscribe today to unlock all pages.
Trusted by 1+ million students worldwide
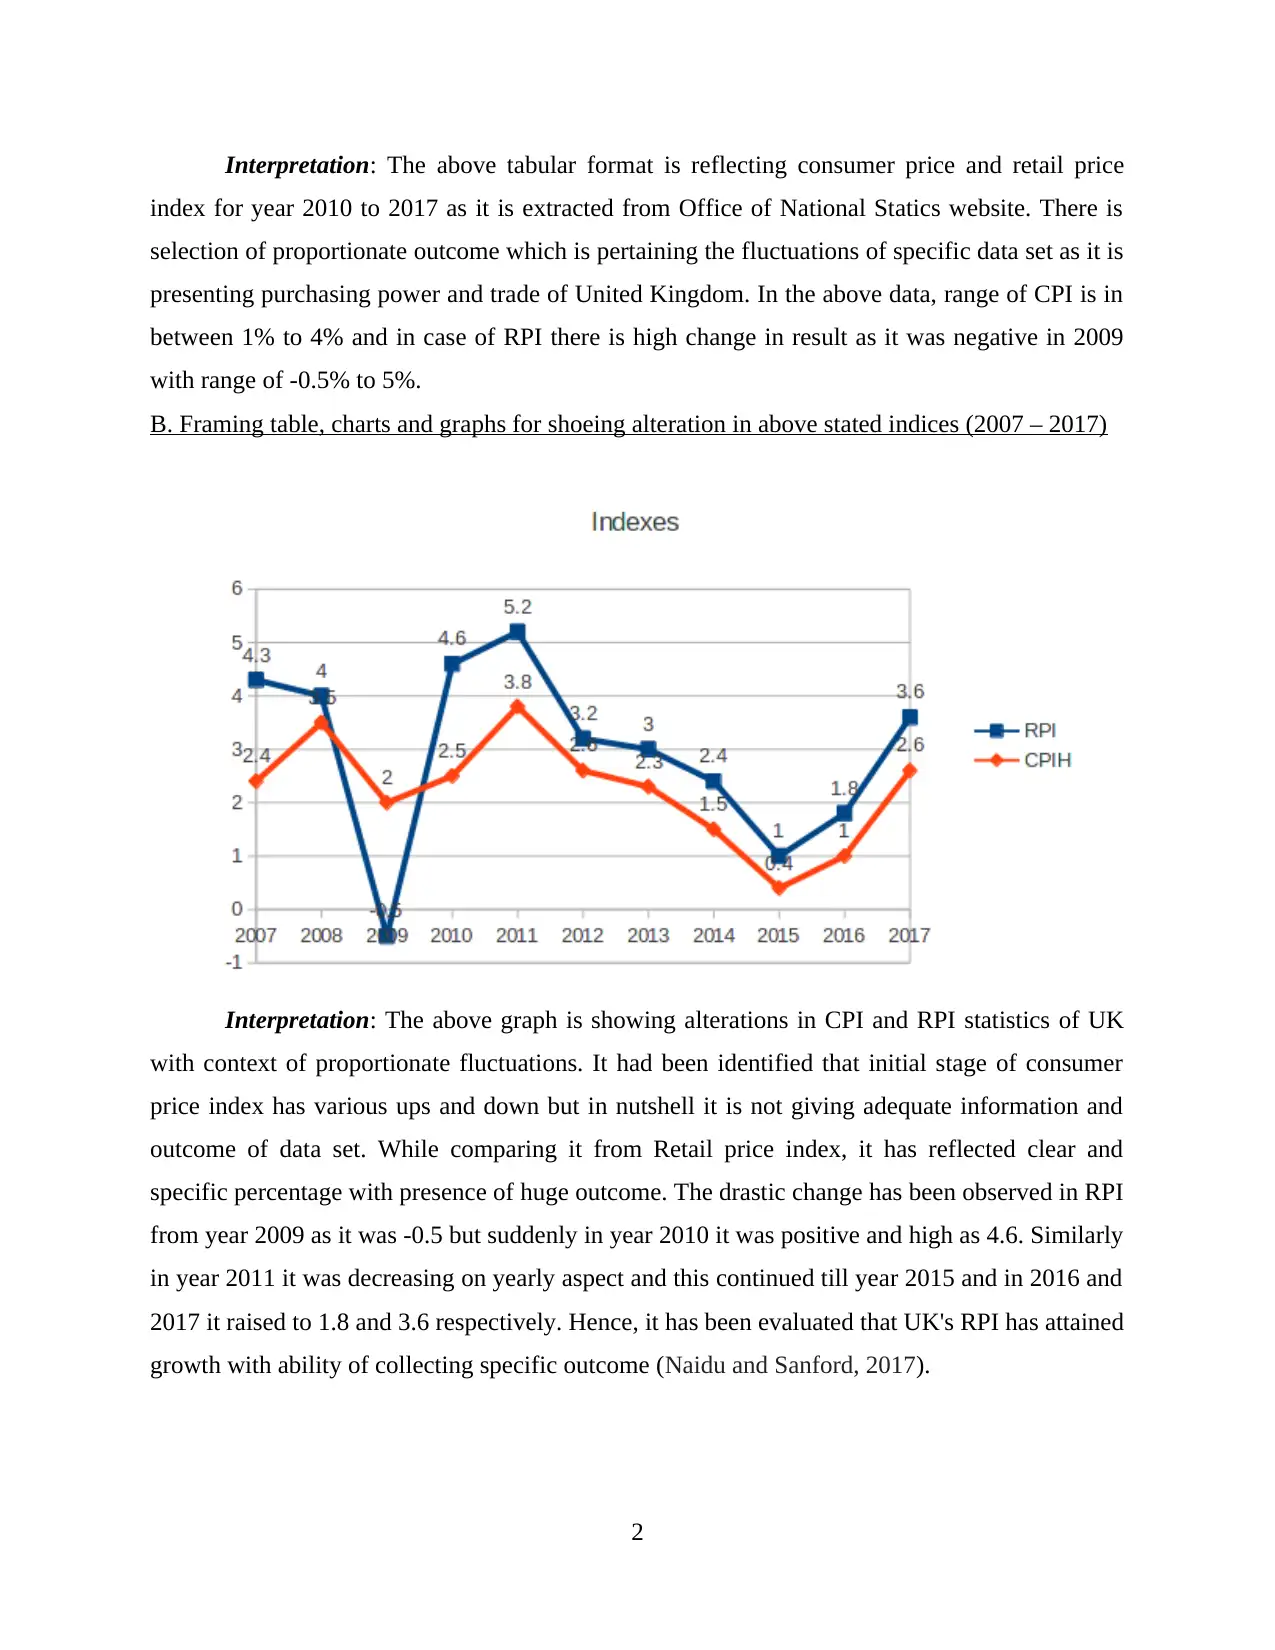
Interpretation: The above tabular format is reflecting consumer price and retail price
index for year 2010 to 2017 as it is extracted from Office of National Statics website. There is
selection of proportionate outcome which is pertaining the fluctuations of specific data set as it is
presenting purchasing power and trade of United Kingdom. In the above data, range of CPI is in
between 1% to 4% and in case of RPI there is high change in result as it was negative in 2009
with range of -0.5% to 5%.
B. Framing table, charts and graphs for shoeing alteration in above stated indices (2007 – 2017)
Interpretation: The above graph is showing alterations in CPI and RPI statistics of UK
with context of proportionate fluctuations. It had been identified that initial stage of consumer
price index has various ups and down but in nutshell it is not giving adequate information and
outcome of data set. While comparing it from Retail price index, it has reflected clear and
specific percentage with presence of huge outcome. The drastic change has been observed in RPI
from year 2009 as it was -0.5 but suddenly in year 2010 it was positive and high as 4.6. Similarly
in year 2011 it was decreasing on yearly aspect and this continued till year 2015 and in 2016 and
2017 it raised to 1.8 and 3.6 respectively. Hence, it has been evaluated that UK's RPI has attained
growth with ability of collecting specific outcome (Naidu and Sanford, 2017).
2
Paraphrase This Document
Need a fresh take? Get an instant paraphrase of this document with our AI Paraphraser
C. Reflecting variations in RPI and CPI
CPI and RPI both are considered as popular method as inflation measure as both indices
use specific goods for inflation as it is very difficult for differentiating. Consumer price Index is
forecasted by considering average of price of purchased economic result through customer as
specific base whereas RPI observes differences in price of retail economic output. The basic
aspects for observing variations are stated below:
CPI examines differences in paid price through consumer for market of particular basket
of services and goods. The measure of consumer inflation extracts alterations in retail
price of basket of services and goods is referred as retail price index.
There is application of geometric mean in CPI for extracting variation among previous
and current price. Conversely RPI uses arithmetic mean where items are divided with
sum of price.
The large population is covered in CPI as compared to RPI.
CPI will not include cost of housing like depreciation on house, payments of mortgage
interests, road fund license along with council tax. RPI considers cost in basket of various
services and consumer goods.
The CPI's value is lower as compared to RPI (CPI(H) vs RPI, 2017).
CPI would be accounting number of charges like stock broker's fees along with unit trust
as well as RPI would be not considering these costs.
D. Application for calculating yearly inflation
Year 2007 2008 2009 2010 2011 2012 2013 2014 2015 2016 2017
Inflati
on rate 0 0.46 -0.43 0.25 0.52 -0.32 -0.12 -0.35 -0.73 1.5 1.6
CPIH 2.4 3.5 2 2.5 3.8 2.6 2.3 1.5 0.4 1 2.6
Interpretation: The above table is extracting rate of inflation with consideration of
Consumer price index as it had been observed that level of inflation is raising as compared to
previous year. The outcome of payments are not wholly satisfied on basis of decreasing inflation
rate as there was negative inflation in year 2012 to year 2915 which is in favour of market
situation of economy. On the other hand, there was drastic change in 2016 and 2017 with
context of inflation rate. Further, it had observed positive change in inflation which is challenge
3
to economy and high commodity prices with its affect of per capita income and financial
condition is not stable as well (Weaver, 2018).
E. Explaining reason with significance of rate of inflation
Inflation will essentially work as economy;s stabilising tools as there are various reasons
for ups and down in prices. In case inflation rate gets high then currency would be becoming
virtually worthless. If economy is not running in particular capacity which signifies that unused
resource or labour along with inflation theoretically helps for raise in production. In the similar
aspect, if consumer prices are falling in consistent aspect due to becoming productive country as
customers hold purchases for better deal. Its net impact is for decreasing sum of demand and will
directly lead to less production, faltering and lay-off of economy.
Inflation creates ease for debtors as one who repay loan with money which is not highly
valuable as compared to borrowed money. In other words, it is encouraging lending and
borrowing which raises spending on each level. According to different economists, they had
belief of inverse relationship among unemployment and inflation which is against raised
inflation. The necessities of customer would be directly met as they would be highly spending on
commodity as it will be great help to economy for purpose of various circulation in monetary
format. In the similar aspect, supply level of money would be increased as government will be
collecting funds for reserves with objective of different future developments.
ACTIVITY 2 (Client B)
Hourly pay rates in various region of UK
A.1 Reflecting Ogive for determining median hourly earnings along with quartiles
The variations of hourly earnings are appropriately analysed with different locations and
use of various statistical tool as well. It will be reflecting descriptive analysis of this particular
dataset which is included for analysing median and quartile such as:
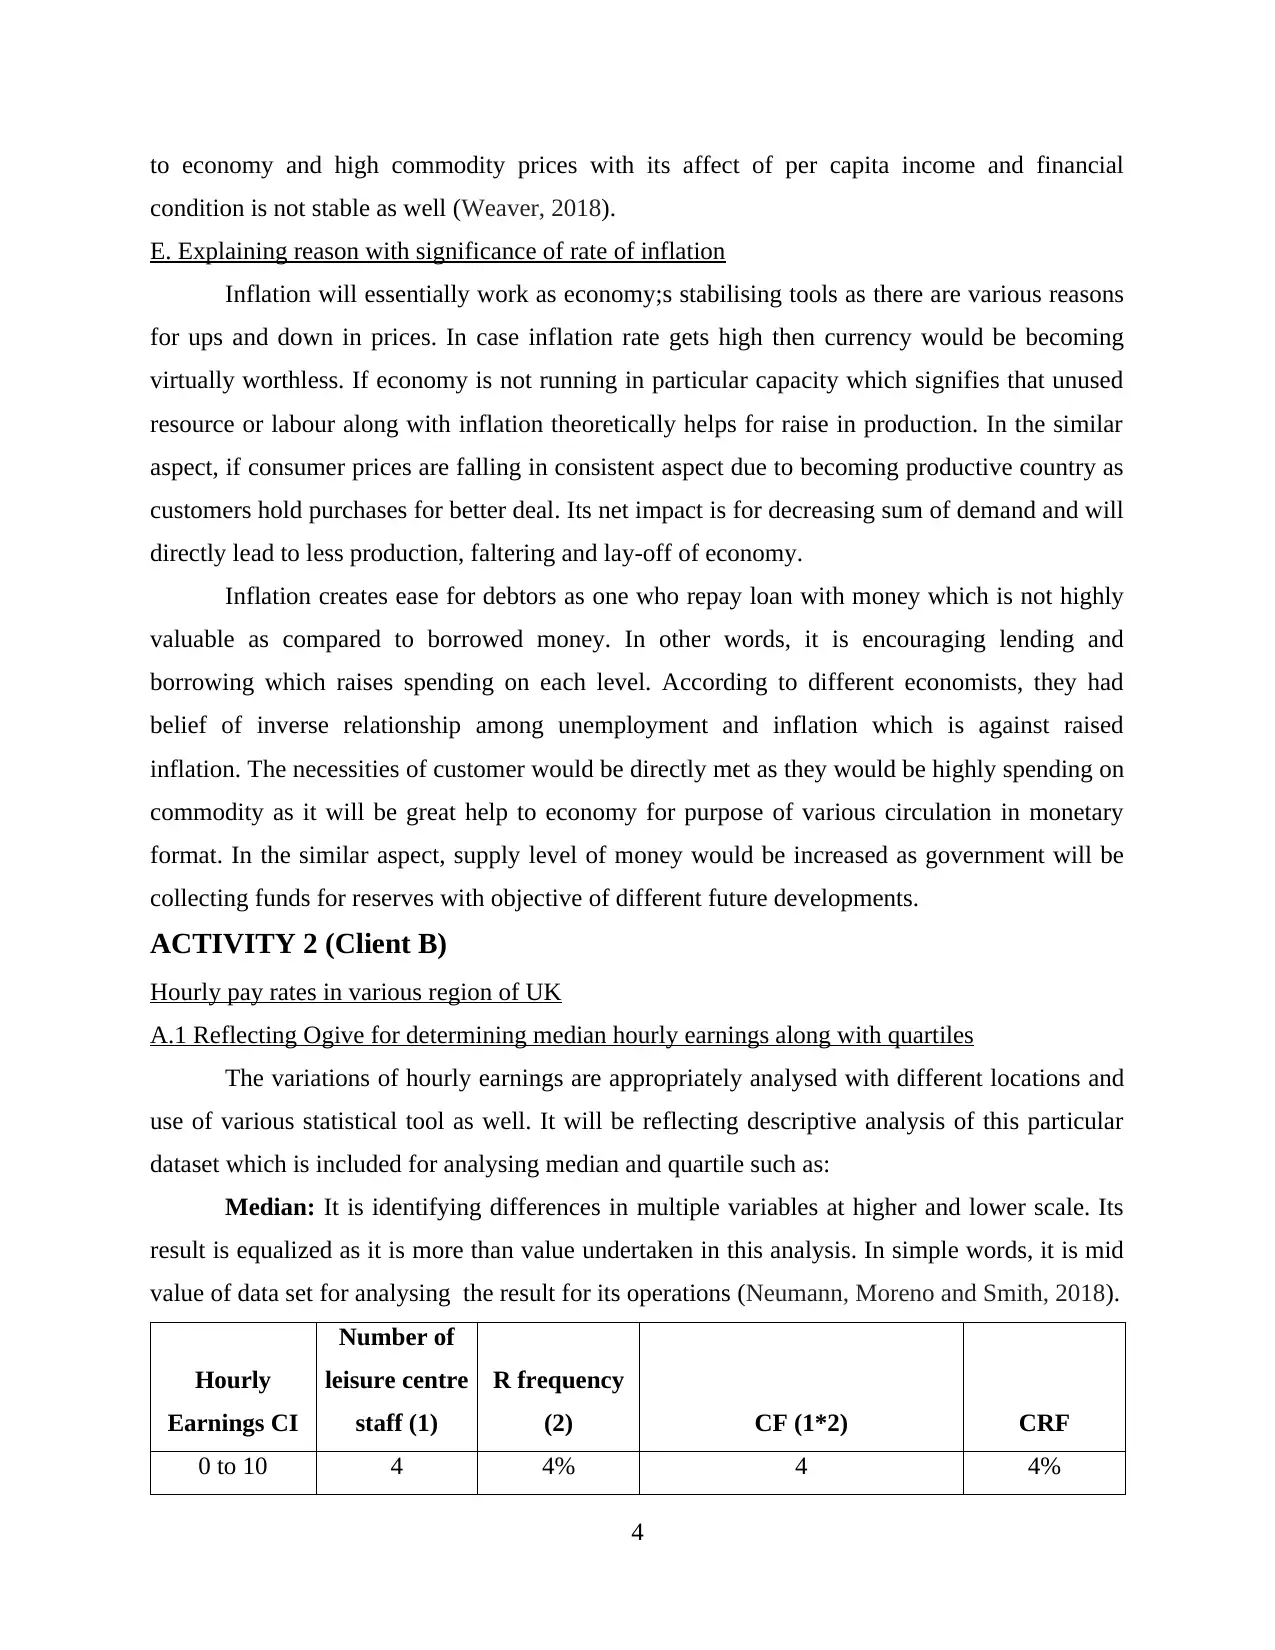
Median: It is identifying differences in multiple variables at higher and lower scale. Its
result is equalized as it is more than value undertaken in this analysis. In simple words, it is mid
value of data set for analysing the result for its operations (Neumann, Moreno and Smith, 2018).
Hourly
Earnings CI
Number of
leisure centre
staff (1)
R frequency
(2) CF (1*2) CRF
0 to 10 4 4% 4 4%
4
condition is not stable as well (Weaver, 2018).
E. Explaining reason with significance of rate of inflation
Inflation will essentially work as economy;s stabilising tools as there are various reasons
for ups and down in prices. In case inflation rate gets high then currency would be becoming
virtually worthless. If economy is not running in particular capacity which signifies that unused
resource or labour along with inflation theoretically helps for raise in production. In the similar
aspect, if consumer prices are falling in consistent aspect due to becoming productive country as
customers hold purchases for better deal. Its net impact is for decreasing sum of demand and will
directly lead to less production, faltering and lay-off of economy.
Inflation creates ease for debtors as one who repay loan with money which is not highly
valuable as compared to borrowed money. In other words, it is encouraging lending and
borrowing which raises spending on each level. According to different economists, they had
belief of inverse relationship among unemployment and inflation which is against raised
inflation. The necessities of customer would be directly met as they would be highly spending on
commodity as it will be great help to economy for purpose of various circulation in monetary
format. In the similar aspect, supply level of money would be increased as government will be
collecting funds for reserves with objective of different future developments.
ACTIVITY 2 (Client B)
Hourly pay rates in various region of UK
A.1 Reflecting Ogive for determining median hourly earnings along with quartiles
The variations of hourly earnings are appropriately analysed with different locations and
use of various statistical tool as well. It will be reflecting descriptive analysis of this particular
dataset which is included for analysing median and quartile such as:
Median: It is identifying differences in multiple variables at higher and lower scale. Its
result is equalized as it is more than value undertaken in this analysis. In simple words, it is mid
value of data set for analysing the result for its operations (Neumann, Moreno and Smith, 2018).
Hourly
Earnings CI
Number of
leisure centre
staff (1)
R frequency
(2) CF (1*2) CRF
0 to 10 4 4% 4 4%
4
⊘ This is a preview!⊘
Do you want full access?
Subscribe today to unlock all pages.
Trusted by 1+ million students worldwide
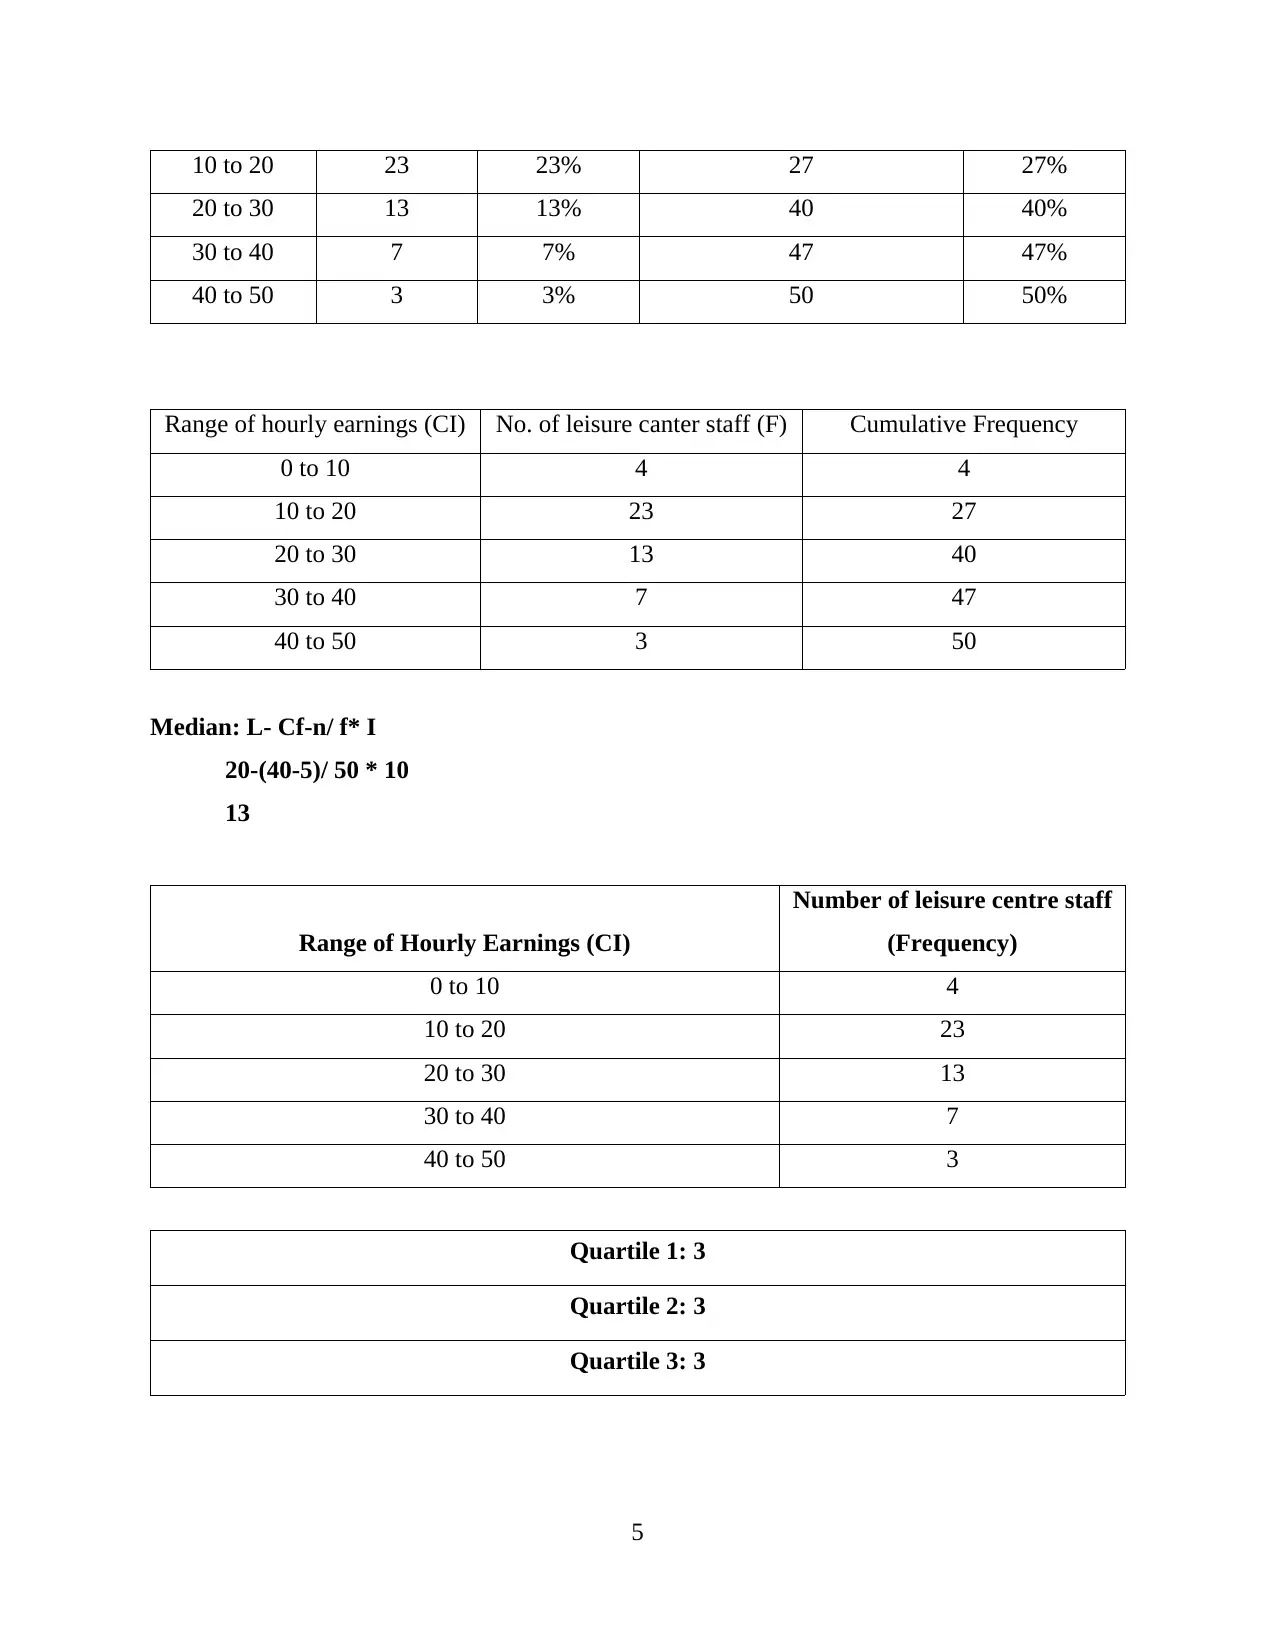
10 to 20 23 23% 27 27%
20 to 30 13 13% 40 40%
30 to 40 7 7% 47 47%
40 to 50 3 3% 50 50%
Range of hourly earnings (CI) No. of leisure canter staff (F) Cumulative Frequency
0 to 10 4 4
10 to 20 23 27
20 to 30 13 40
30 to 40 7 47
40 to 50 3 50
Median: L- Cf-n/ f* I
20-(40-5)/ 50 * 10
13
Range of Hourly Earnings (CI)
Number of leisure centre staff
(Frequency)
0 to 10 4
10 to 20 23
20 to 30 13
30 to 40 7
40 to 50 3
Quartile 1: 3
Quartile 2: 3
Quartile 3: 3
5
Paraphrase This Document
Need a fresh take? Get an instant paraphrase of this document with our AI Paraphraser
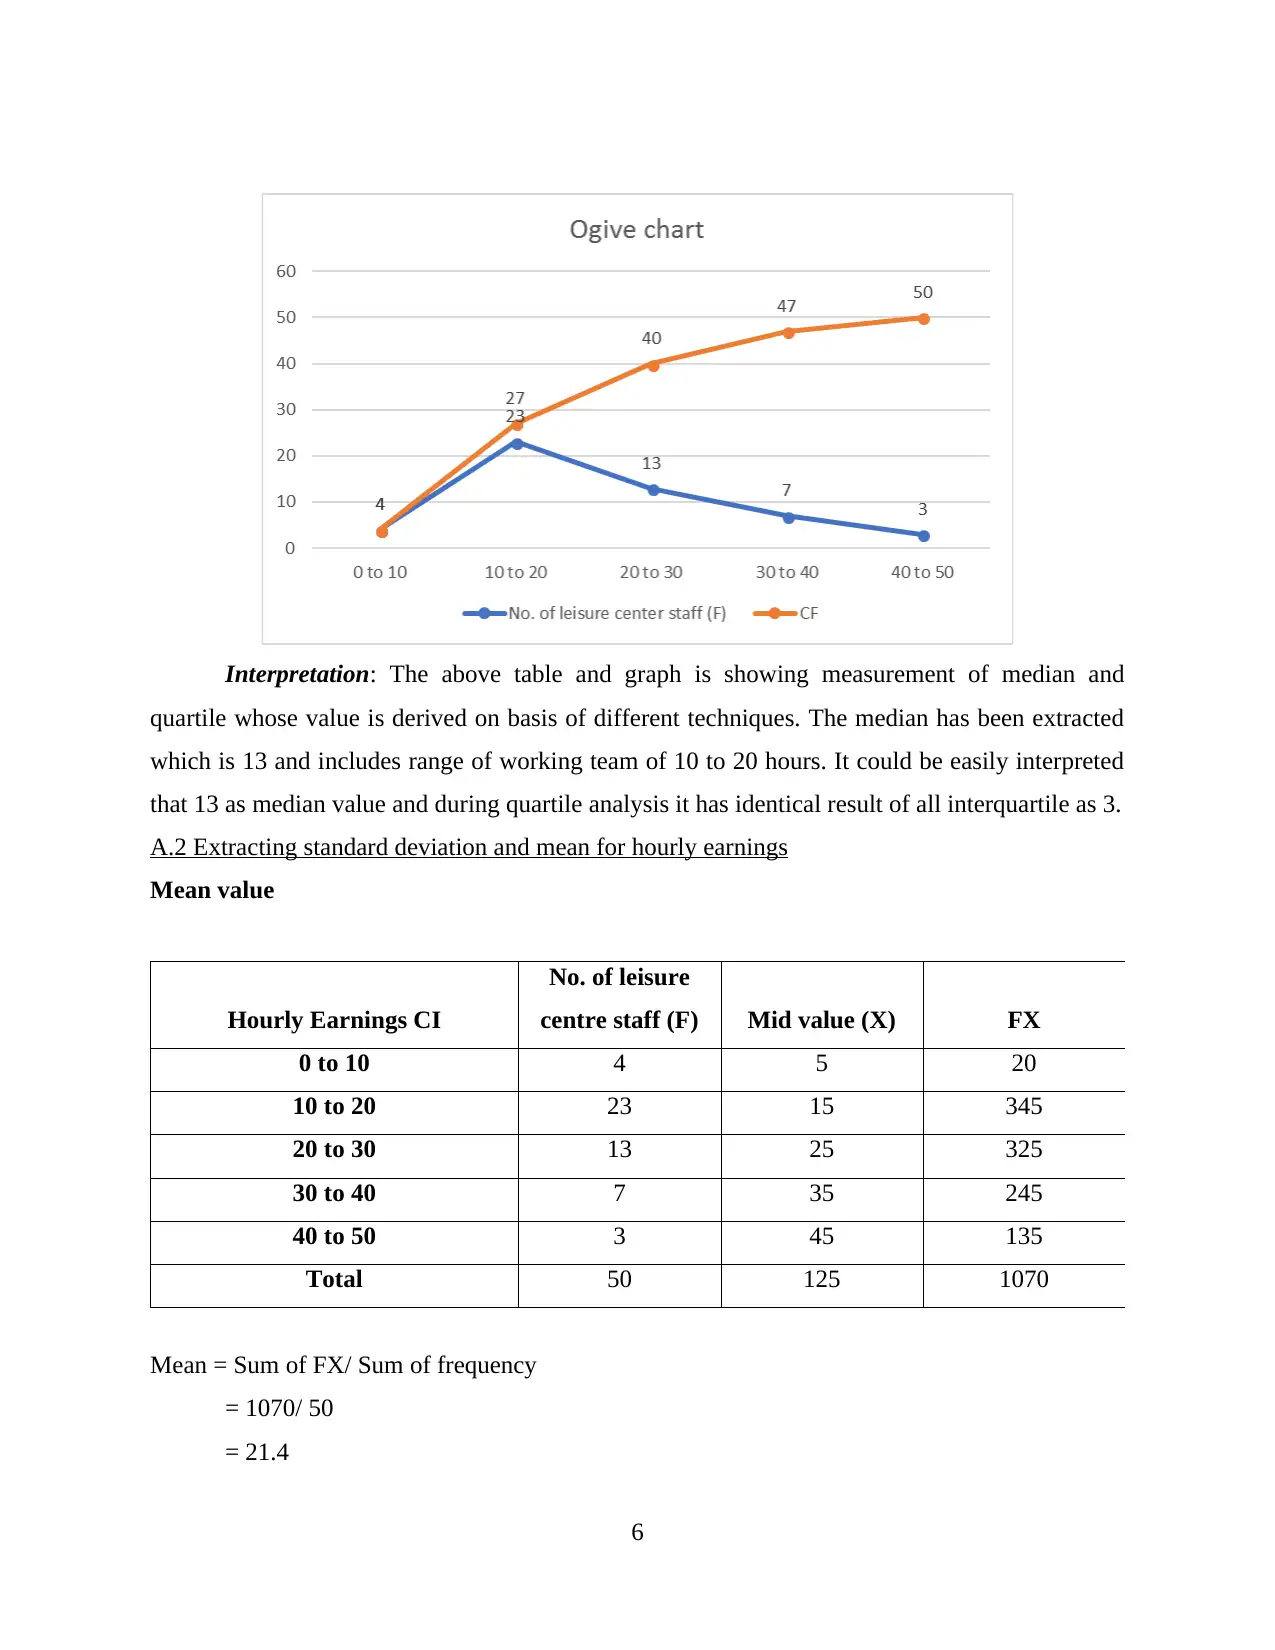
Interpretation: The above table and graph is showing measurement of median and
quartile whose value is derived on basis of different techniques. The median has been extracted
which is 13 and includes range of working team of 10 to 20 hours. It could be easily interpreted
that 13 as median value and during quartile analysis it has identical result of all interquartile as 3.
A.2 Extracting standard deviation and mean for hourly earnings
Mean value
Hourly Earnings CI
No. of leisure
centre staff (F) Mid value (X) FX
0 to 10 4 5 20
10 to 20 23 15 345
20 to 30 13 25 325
30 to 40 7 35 245
40 to 50 3 45 135
Total 50 125 1070
Mean = Sum of FX/ Sum of frequency
= 1070/ 50
= 21.4
6
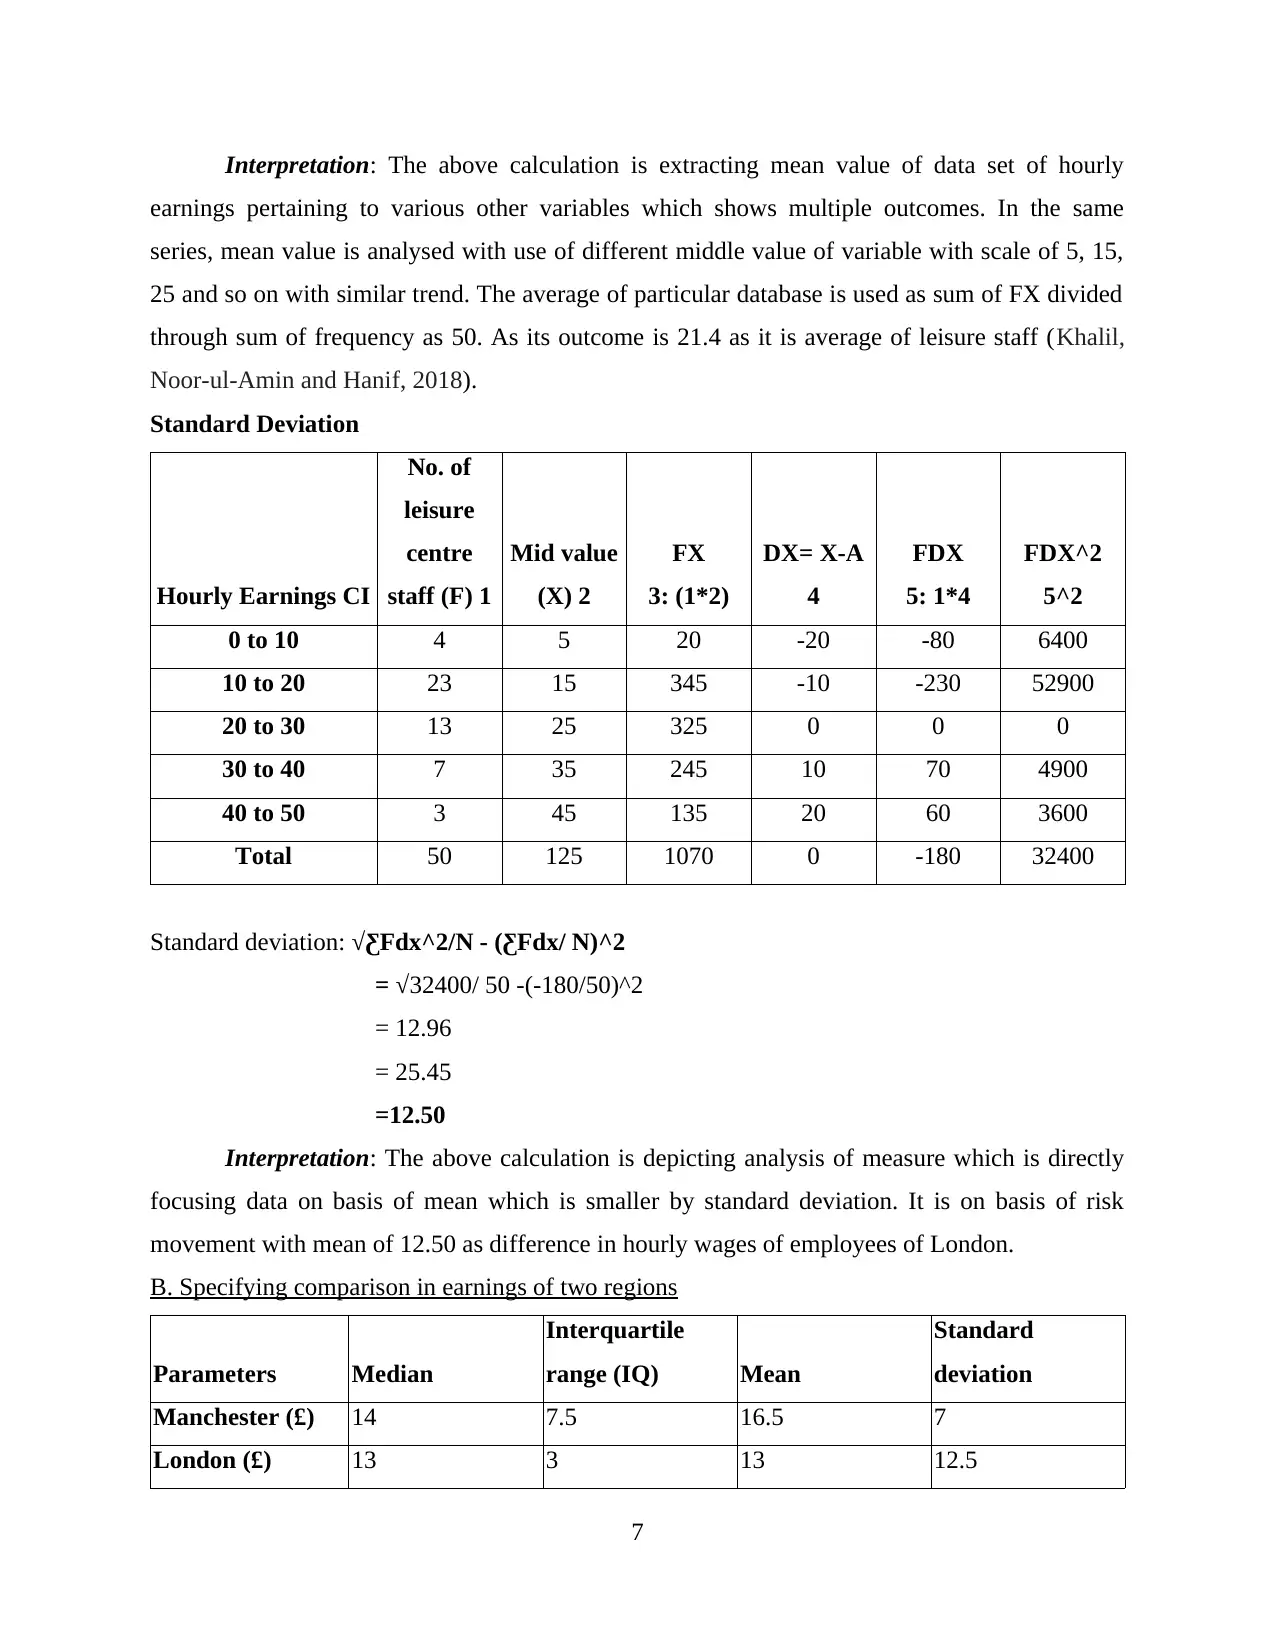
Interpretation: The above calculation is extracting mean value of data set of hourly
earnings pertaining to various other variables which shows multiple outcomes. In the same
series, mean value is analysed with use of different middle value of variable with scale of 5, 15,
25 and so on with similar trend. The average of particular database is used as sum of FX divided
through sum of frequency as 50. As its outcome is 21.4 as it is average of leisure staff (Khalil,
Noor-ul-Amin and Hanif, 2018).
Standard Deviation
Hourly Earnings CI
No. of
leisure
centre
staff (F) 1
Mid value
(X) 2
FX
3: (1*2)
DX= X-A
4
FDX
5: 1*4
FDX^2
5^2
0 to 10 4 5 20 -20 -80 6400
10 to 20 23 15 345 -10 -230 52900
20 to 30 13 25 325 0 0 0
30 to 40 7 35 245 10 70 4900
40 to 50 3 45 135 20 60 3600
Total 50 125 1070 0 -180 32400
Standard deviation: √ƸFdx^2/N - (ƸFdx/ N)^2
= √32400/ 50 -(-180/50)^2
= 12.96
= 25.45
=12.50
Interpretation: The above calculation is depicting analysis of measure which is directly
focusing data on basis of mean which is smaller by standard deviation. It is on basis of risk
movement with mean of 12.50 as difference in hourly wages of employees of London.
B. Specifying comparison in earnings of two regions
Parameters Median
Interquartile
range (IQ) Mean
Standard
deviation
Manchester (£) 14 7.5 16.5 7
London (£) 13 3 13 12.5
7
⊘ This is a preview!⊘
Do you want full access?
Subscribe today to unlock all pages.
Trusted by 1+ million students worldwide
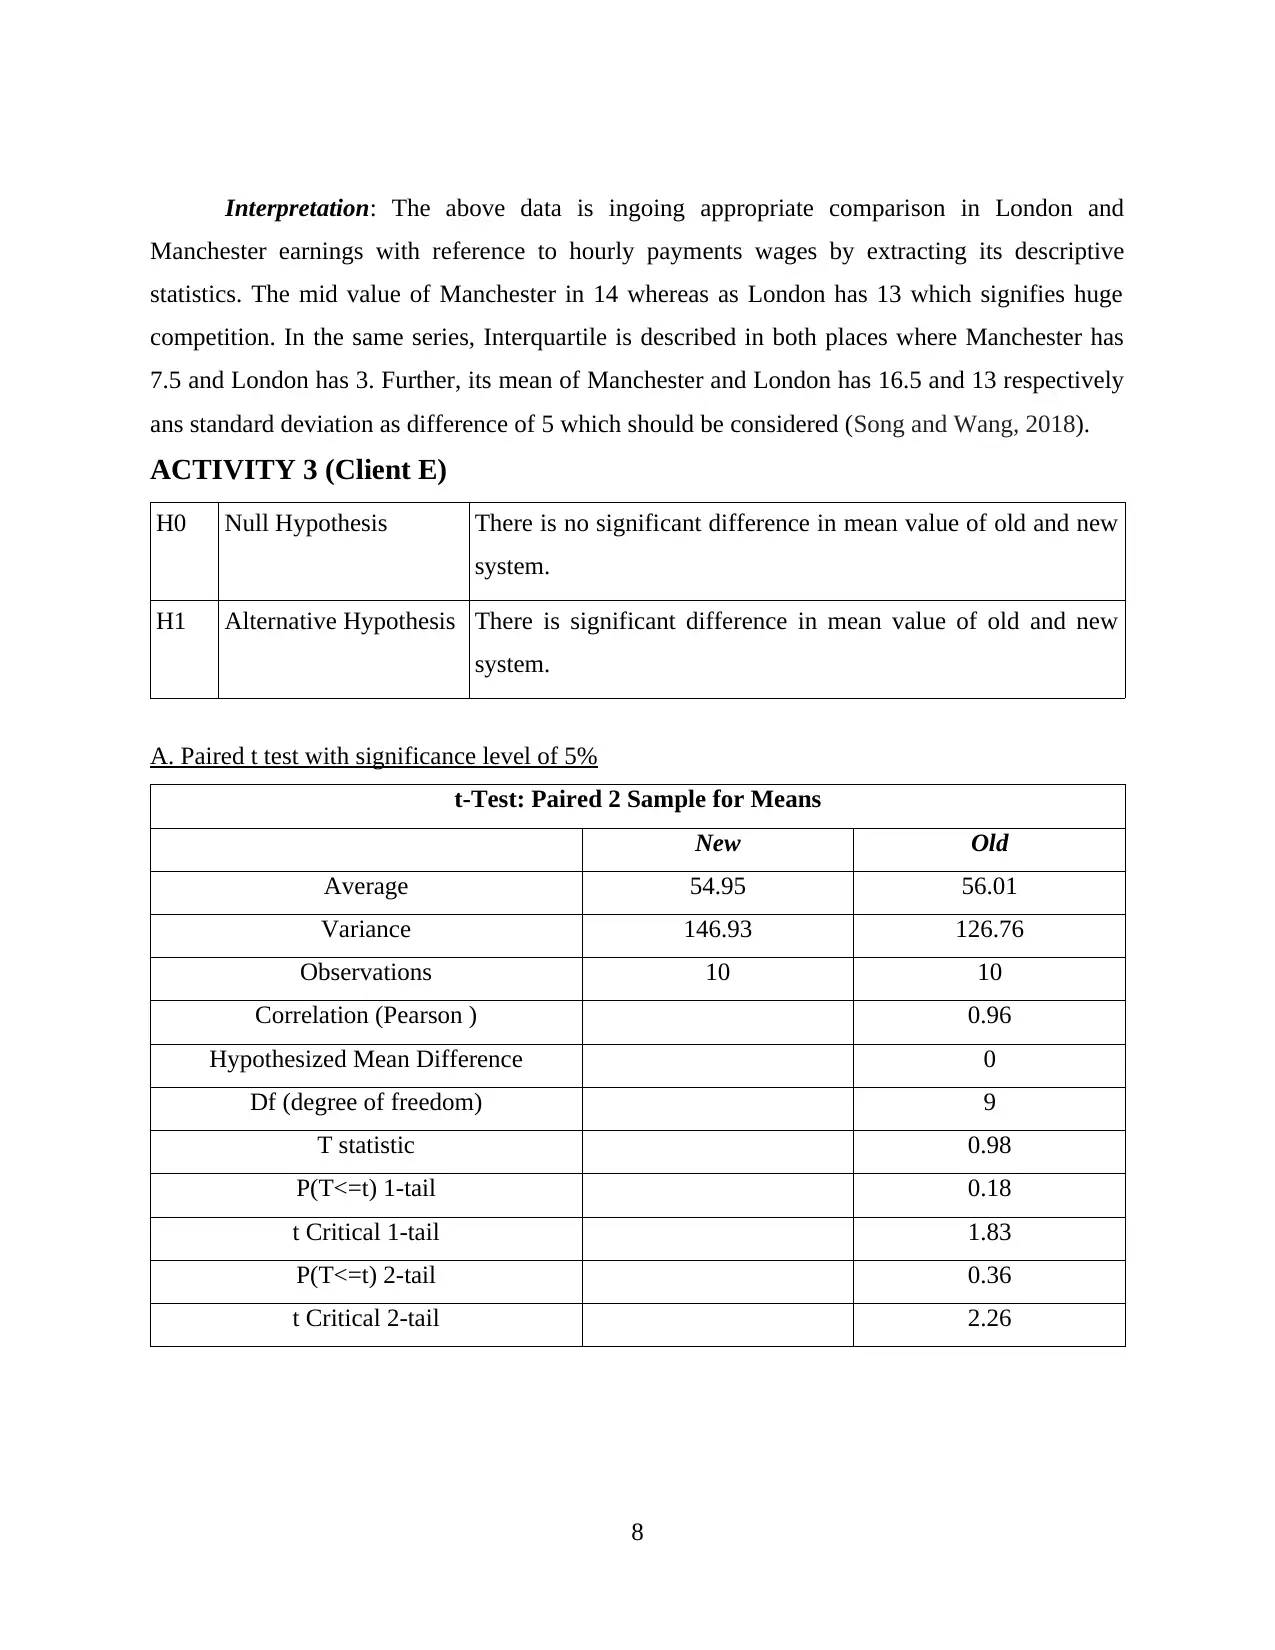
Interpretation: The above data is ingoing appropriate comparison in London and
Manchester earnings with reference to hourly payments wages by extracting its descriptive
statistics. The mid value of Manchester in 14 whereas as London has 13 which signifies huge
competition. In the same series, Interquartile is described in both places where Manchester has
7.5 and London has 3. Further, its mean of Manchester and London has 16.5 and 13 respectively
ans standard deviation as difference of 5 which should be considered (Song and Wang, 2018).
ACTIVITY 3 (Client E)
H0 Null Hypothesis There is no significant difference in mean value of old and new
system.
H1 Alternative Hypothesis There is significant difference in mean value of old and new
system.
A. Paired t test with significance level of 5%
t-Test: Paired 2 Sample for Means
New Old
Average 54.95 56.01
Variance 146.93 126.76
Observations 10 10
Correlation (Pearson ) 0.96
Hypothesized Mean Difference 0
Df (degree of freedom) 9
T statistic 0.98
P(T<=t) 1-tail 0.18
t Critical 1-tail 1.83
P(T<=t) 2-tail 0.36
t Critical 2-tail 2.26
8
Paraphrase This Document
Need a fresh take? Get an instant paraphrase of this document with our AI Paraphraser
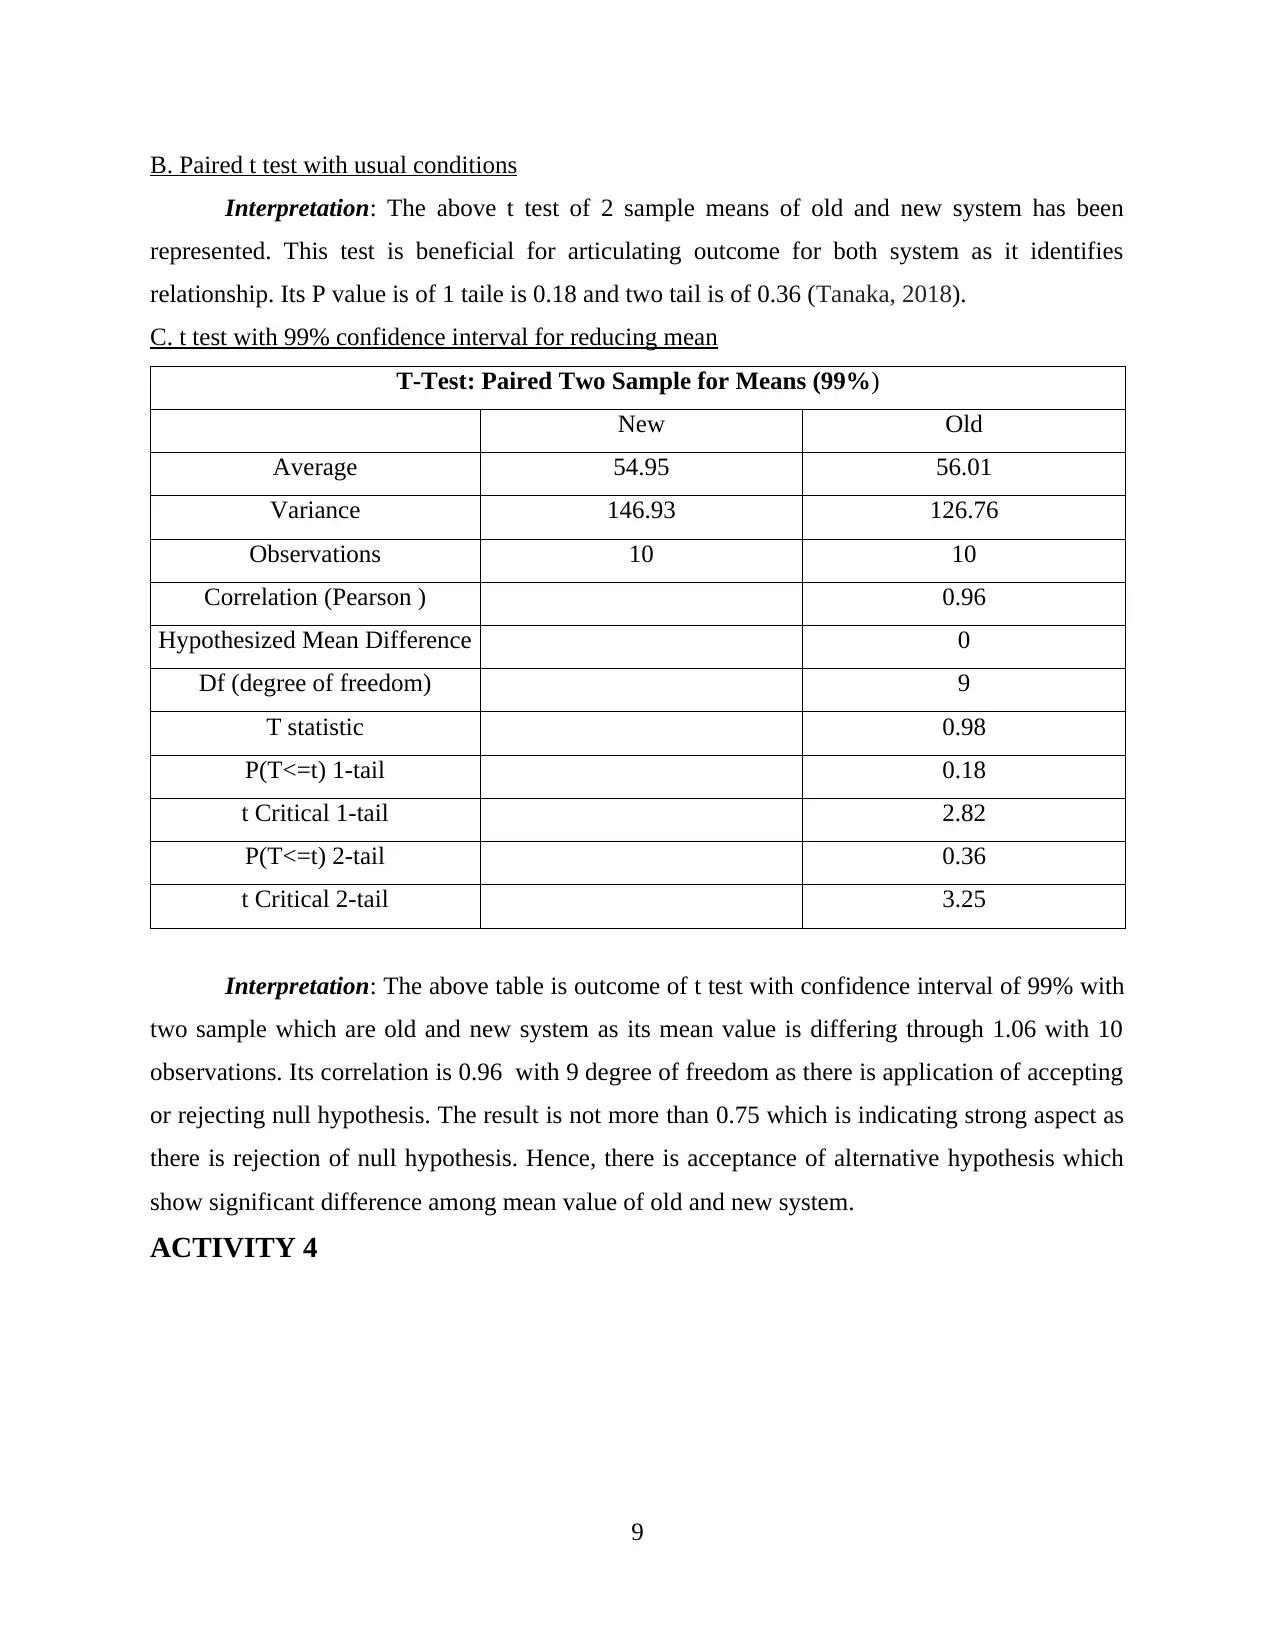
B. Paired t test with usual conditions
Interpretation: The above t test of 2 sample means of old and new system has been
represented. This test is beneficial for articulating outcome for both system as it identifies
relationship. Its P value is of 1 taile is 0.18 and two tail is of 0.36 (Tanaka, 2018).
C. t test with 99% confidence interval for reducing mean
T-Test: Paired Two Sample for Means (99%)
New Old
Average 54.95 56.01
Variance 146.93 126.76
Observations 10 10
Correlation (Pearson ) 0.96
Hypothesized Mean Difference 0
Df (degree of freedom) 9
T statistic 0.98
P(T<=t) 1-tail 0.18
t Critical 1-tail 2.82
P(T<=t) 2-tail 0.36
t Critical 2-tail 3.25
Interpretation: The above table is outcome of t test with confidence interval of 99% with
two sample which are old and new system as its mean value is differing through 1.06 with 10
observations. Its correlation is 0.96 with 9 degree of freedom as there is application of accepting
or rejecting null hypothesis. The result is not more than 0.75 which is indicating strong aspect as
there is rejection of null hypothesis. Hence, there is acceptance of alternative hypothesis which
show significant difference among mean value of old and new system.
ACTIVITY 4
9
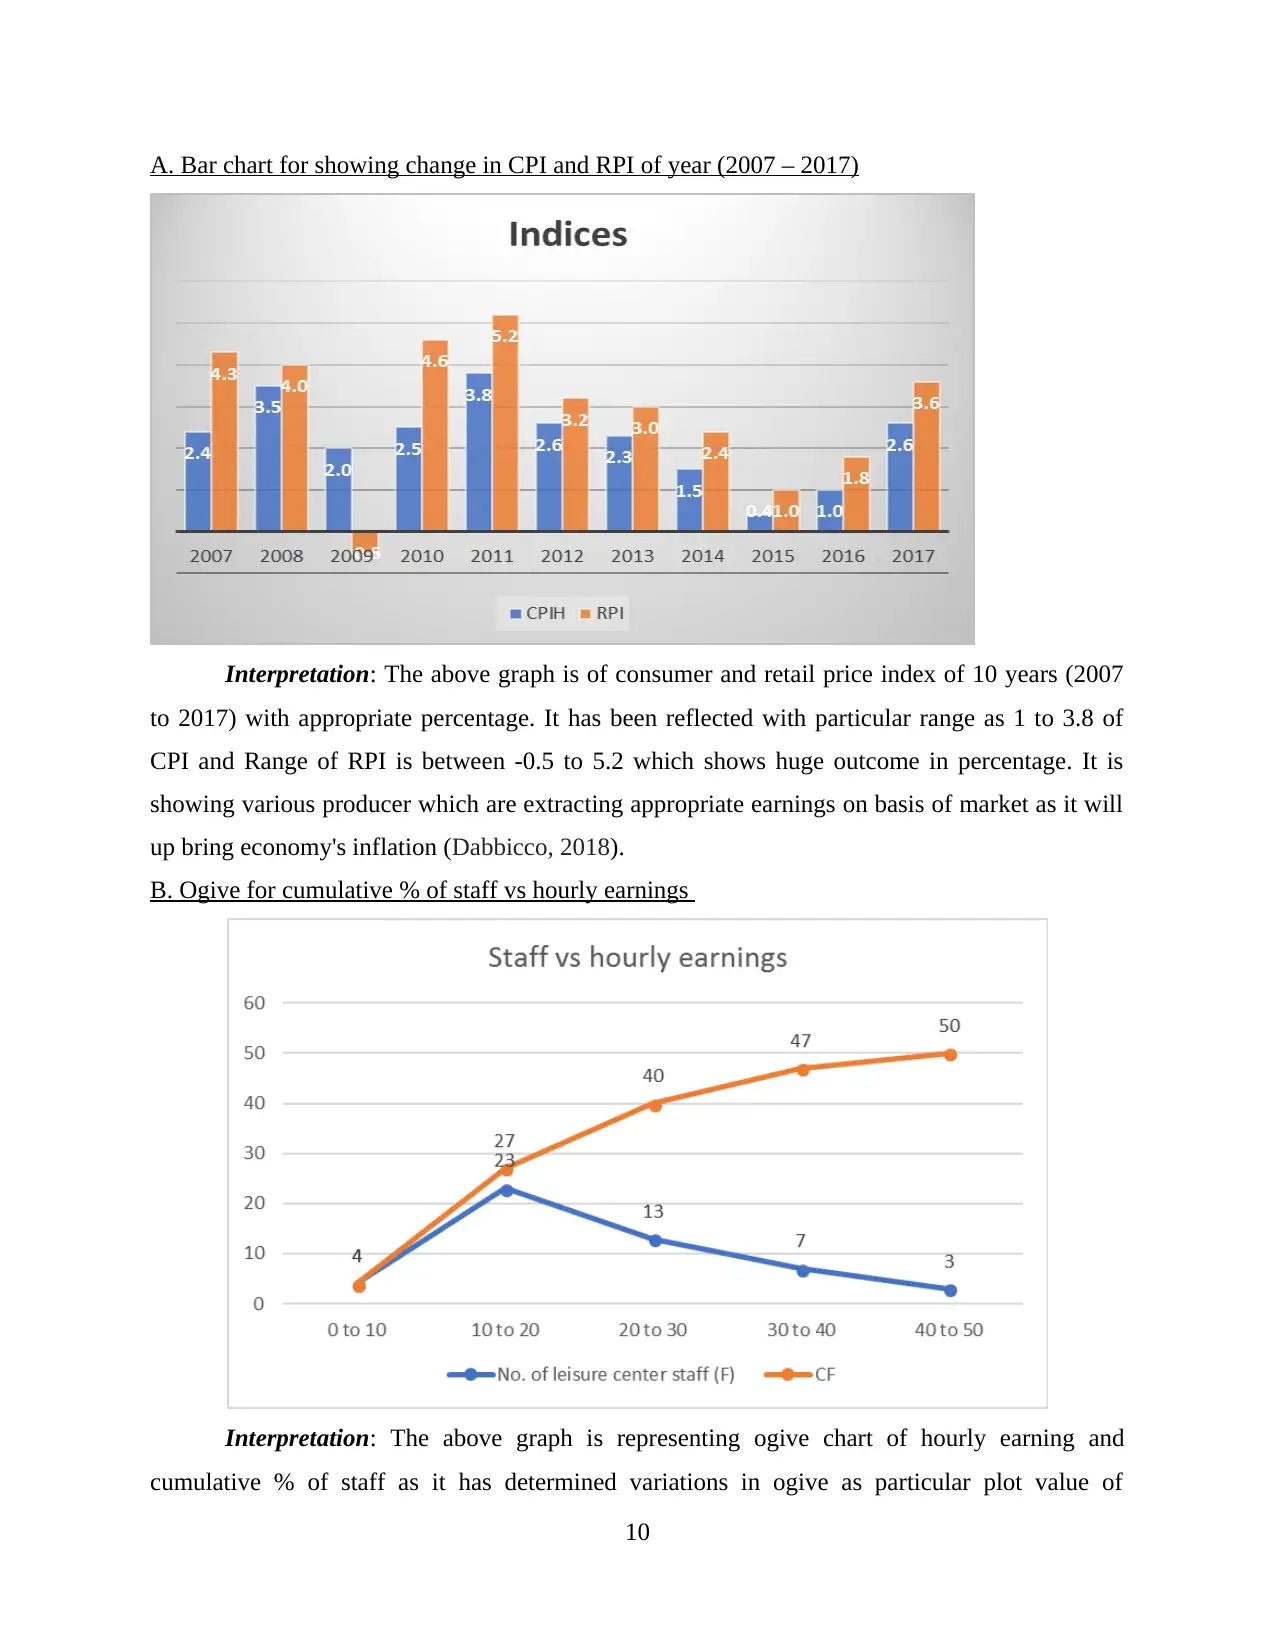
A. Bar chart for showing change in CPI and RPI of year (2007 – 2017)
Interpretation: The above graph is of consumer and retail price index of 10 years (2007
to 2017) with appropriate percentage. It has been reflected with particular range as 1 to 3.8 of
CPI and Range of RPI is between -0.5 to 5.2 which shows huge outcome in percentage. It is
showing various producer which are extracting appropriate earnings on basis of market as it will
up bring economy's inflation (Dabbicco, 2018).
B. Ogive for cumulative % of staff vs hourly earnings
Interpretation: The above graph is representing ogive chart of hourly earning and
cumulative % of staff as it has determined variations in ogive as particular plot value of
10
⊘ This is a preview!⊘
Do you want full access?
Subscribe today to unlock all pages.
Trusted by 1+ million students worldwide
1 out of 13
Related Documents


Your All-in-One AI-Powered Toolkit for Academic Success.
+13062052269
info@desklib.com
Available 24*7 on WhatsApp / Email
![[object Object]](/_next/static/media/star-bottom.7253800d.svg)
Unlock your academic potential
Copyright © 2020–2026 A2Z Services. All Rights Reserved. Developed and managed by ZUCOL.