Ask a question from expert
Statistics for Management Assignment Solution
16 Pages3449 Words157 Views
Added on 2020-10-04
Statistics for Management Assignment Solution
Added on 2020-10-04
BookmarkShareRelated Documents
STATISTICS FORMANAGEMENT
TABLE OF CONTENTSINTRODUCTION...........................................................................................................................1ACTIVITY 1 ...................................................................................................................................1a) Use Of office national statistic to locate data relating to CPI , CPIH and RPI........................1b) Changes in price indices from 2007 to 2017 ..........................................................................2c) Difference between CPI and RPI ............................................................................................2d) Use of consumer price index to explain its use to calculate annual inflation.........................4e) Importance to measure the rate of inflation ............................................................................5ACTIVITY 2....................................................................................................................................5a) 1. Ogive to estimate the median hourly earning and the quartiles..........................................52. Hourly earning mean and standard deviation..........................................................................7b) Comparison between Manchester and London earnings.........................................................9ACTIVITY 3....................................................................................................................................9A) Paired t test at 5 % level of significance.................................................................................9B) Assessing paired t test with normal conditions.....................................................................10C) 99% confidence interval with aim of reduction in mean......................................................10ACTIVITY 4..................................................................................................................................11a) Using data from ONS to produce charts indicating change in CPI, CPIH and RPI from 2007to 2017.......................................................................................................................................11b) Ogive for cumulative % staff v/s hourly earning..................................................................12CONCLUSION .............................................................................................................................12REFERENCES..............................................................................................................................14
INTRODUCTIONStatistics refers to the collection of numerical data which is used to measure thequantitative information. Statistics is used in management for financial analysis, for decisionmaking, auditing and market research. It is used by management as it gives a technique to obtain,consider, analyse and relate numerical data. This study will include consumer price index andretail price index which is been collected from the office of national statistics. Furthermore, itwill include statistical methods used in business planning. Moreover, it will provideunderstanding of business data using statistical methods. Statistics are used in business to makegood and sound decision for company. It helps in comparing the trend and changes bycollecting various data.ACTIVITY 1 a) Use Of office national statistic to locate data relating to CPI , CPIH and RPI. Consumer price index : It is a measure that helps in examining the weighted average ofprices of consumer goods and services. It helps in measuring the changes in prices of goods andservices (Definition of 'Consumer Price Index', 2017). It is calculated by dividing the price ofbasket of goods and services in the given year by the price of the same basket in the base year(Keller, 2015). After this ,the ratio is multiplied by 100 which gives the consumer price index.In the base year, Consumer price index adds up to 100. CPIH : It stands for consumer price inflation including owner occupiers housing cost.Also, it does not include the changes in house prices. It is produced each month in UK by theoffice of national statistics but adjusted to reflect changes in average residential rents (Haimes,2015). These rents are used as proxy measure to identify estimated cost for homeowners to renttheir own homes. CPIH is used instead of CPI to better reflect the cost pressures faced by UKhouseholds.Retail price index : It is used to measure the inflation which is published in the office ofnational statistics. It helps in measuring the change in the cost of retail goods and services(Anderson And et.al., 2018). The measurements are made by recording the goods and serviceswhich people are expected to buy ,putting them into an imaginary shopping basket known as“basket of Goods”. RPI include cost of housing such as mortgage interest cost and council taxwhich CPI does not include.1
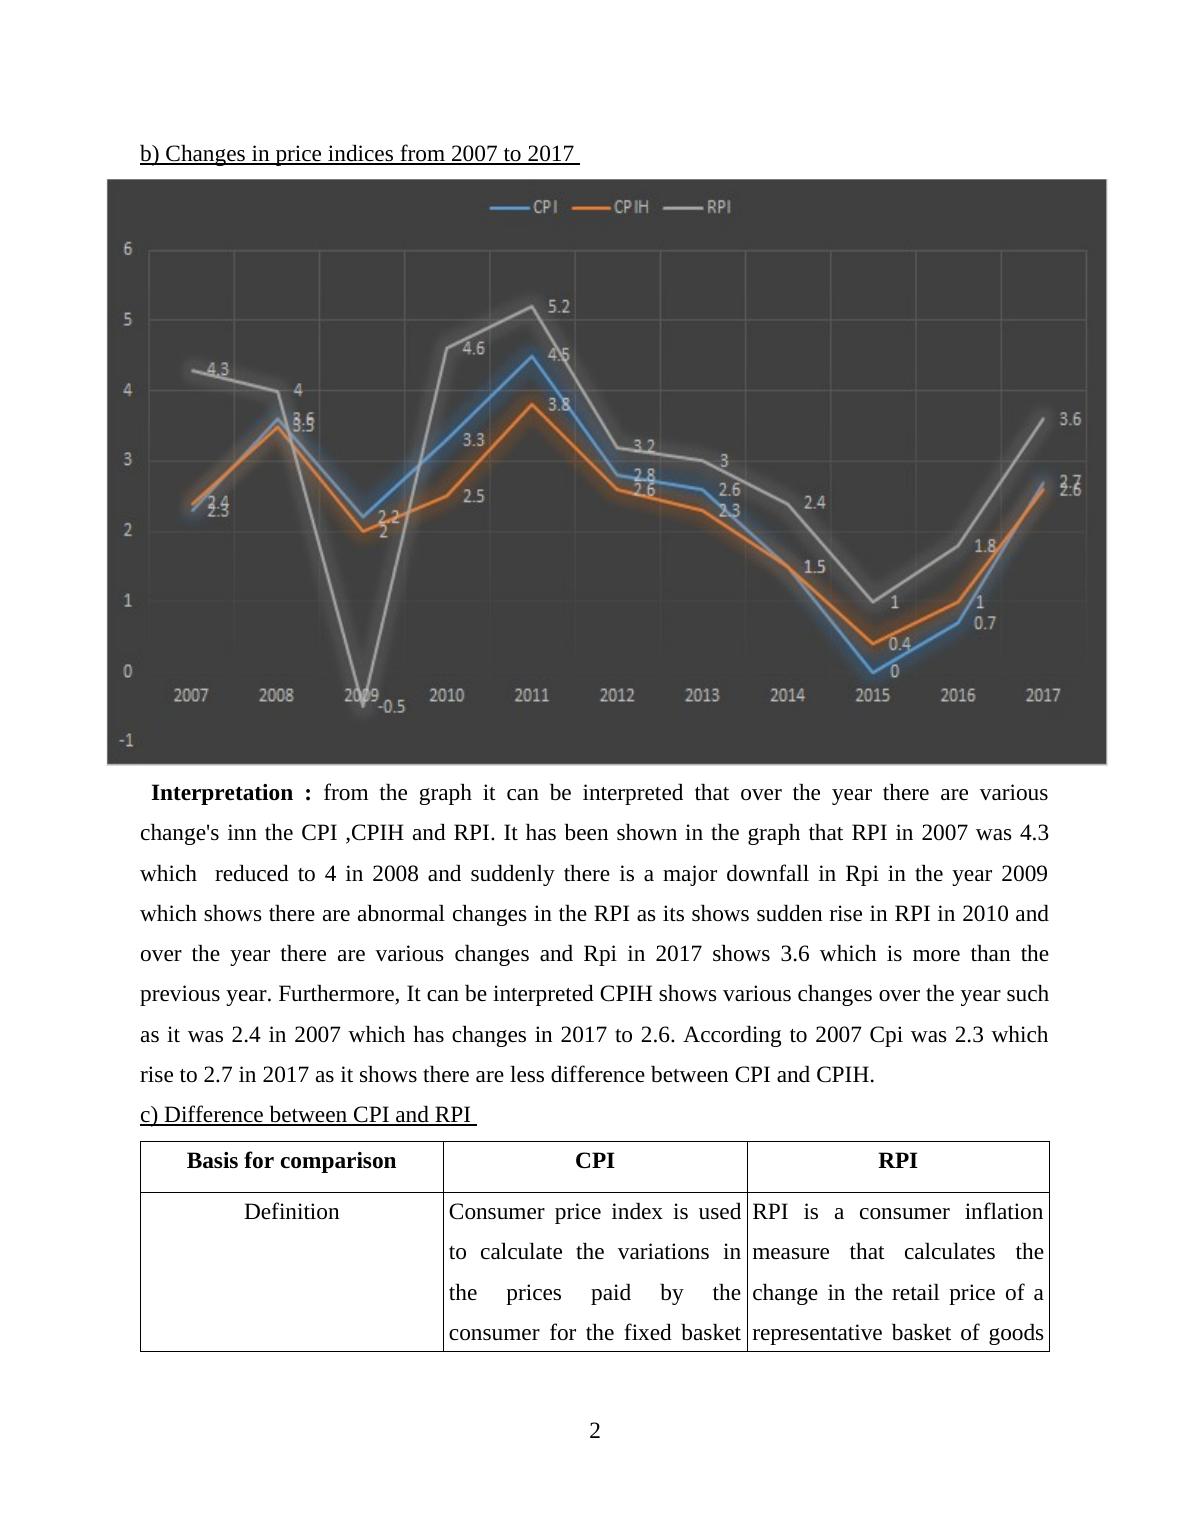
b) Changes in price indices from 2007 to 2017 Interpretation : from the graph it can be interpreted that over the year there are variouschange's inn the CPI ,CPIH and RPI. It has been shown in the graph that RPI in 2007 was 4.3which reduced to 4 in 2008 and suddenly there is a major downfall in Rpi in the year 2009which shows there are abnormal changes in the RPI as its shows sudden rise in RPI in 2010 andover the year there are various changes and Rpi in 2017 shows 3.6 which is more than theprevious year. Furthermore, It can be interpreted CPIH shows various changes over the year suchas it was 2.4 in 2007 which has changes in 2017 to 2.6. According to 2007 Cpi was 2.3 whichrise to 2.7 in 2017 as it shows there are less difference between CPI and CPIH. c) Difference between CPI and RPI Basis for comparisonCPIRPI Definition Consumer price index is usedto calculate the variations inthe prices paid by theconsumer for the fixed basketRPI is a consumer inflationmeasure that calculates thechange in the retail price of arepresentative basket of goods2
End of preview
Want to access all the pages? Upload your documents or become a member.
Related Documents
Statistics For Management (pdf)lg...
|15
|3242
|330
(PDF) Statistics for management | Assignment Samplelg...
|15
|2703
|98
Statistics for Management : Assignment Samplelg...
|16
|4020
|369
Statistics for Management : PDFlg...
|20
|4443
|300
Inflationary Analysis Using Consumer Price Index and Retail Price Indexlg...
|17
|3322
|335
Statics for MANAGEMENT INTRODUCTIONlg...
|20
|4724
|57